. 2017:2017:7961231.
doi: 10.1155/2017/7961231. Epub 2017 May 11.

Active Ingredients of Epimedii Folium and Ligustri Lucidi Fructus Balanced GR/HSP90 to Improve the Sensitivity of Asthmatic Rats to Budesonide

Affiliations

Active Ingredients of Epimedii Folium and Ligustri Lucidi Fructus Balanced GR/HSP90 to Improve the Sensitivity of Asthmatic Rats to Budesonide

Xiufeng Tang et al. Evid Based Complement Alternat Med. 2017.

Abstract

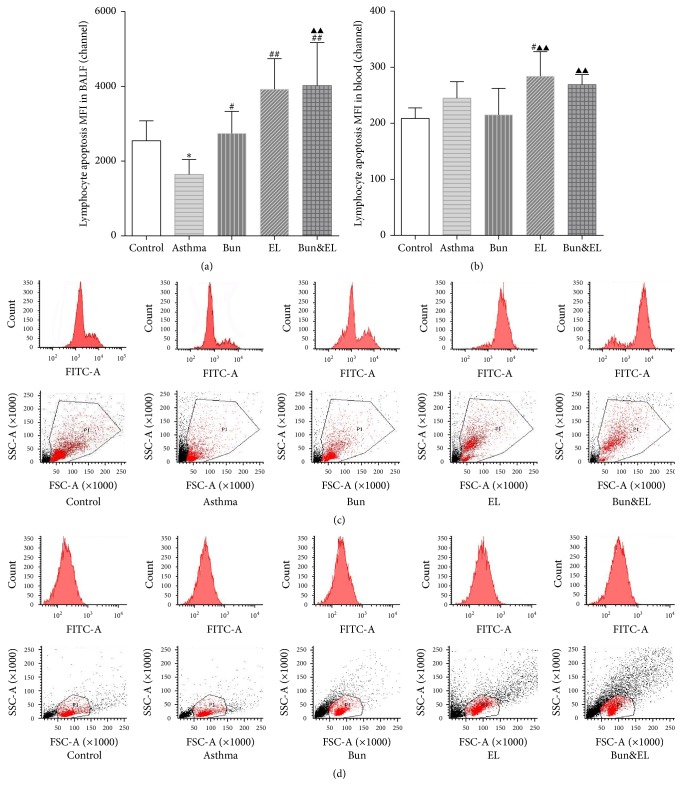
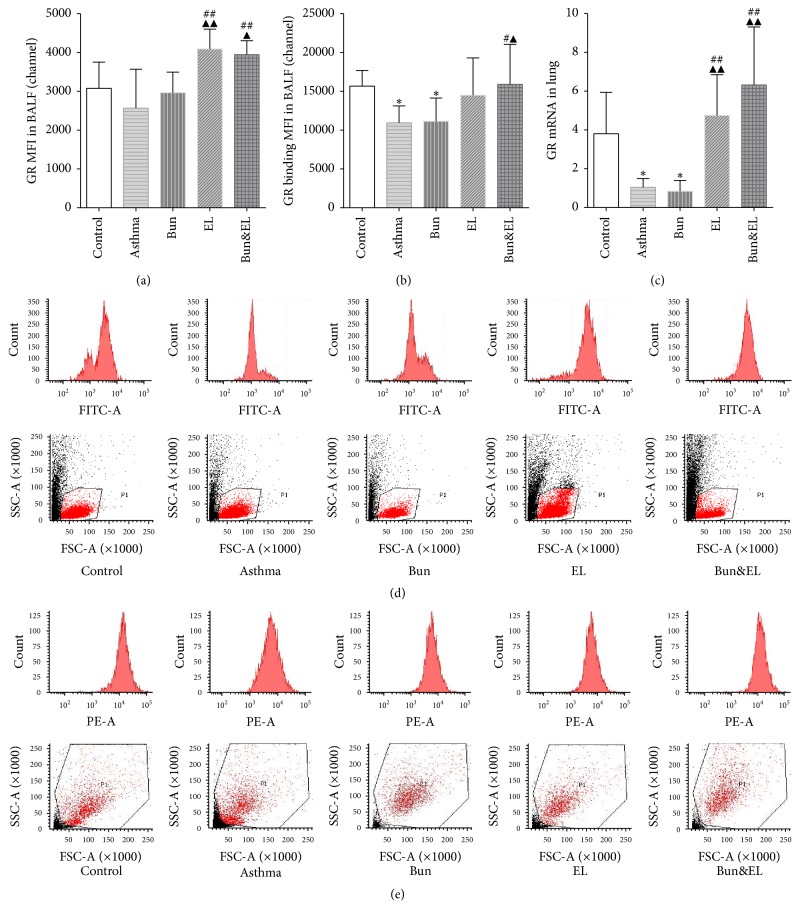
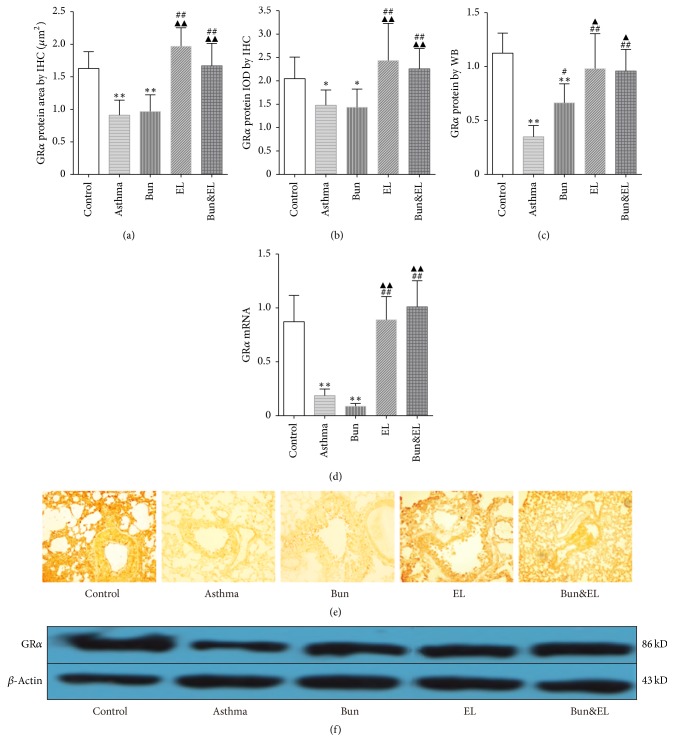
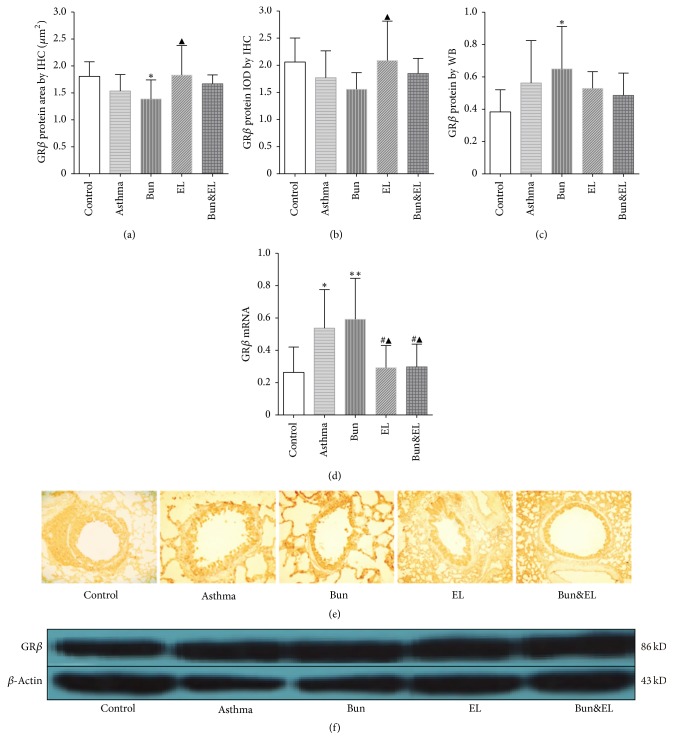
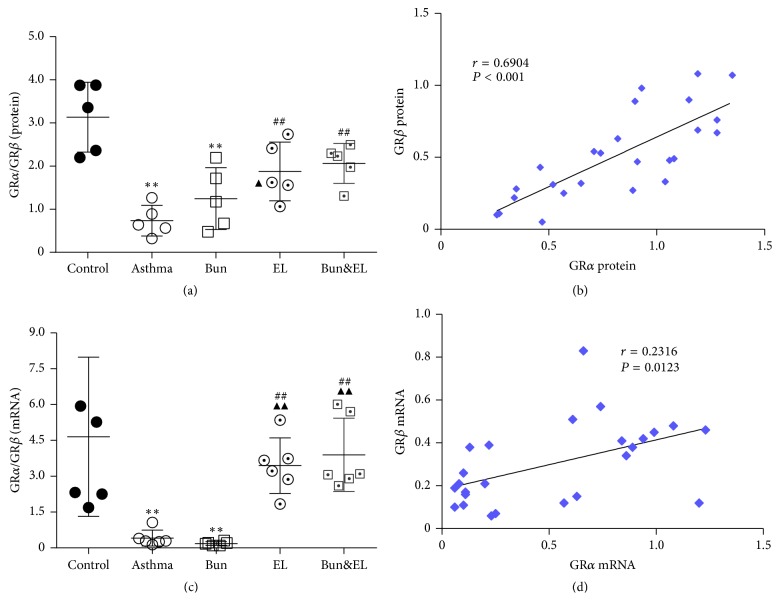
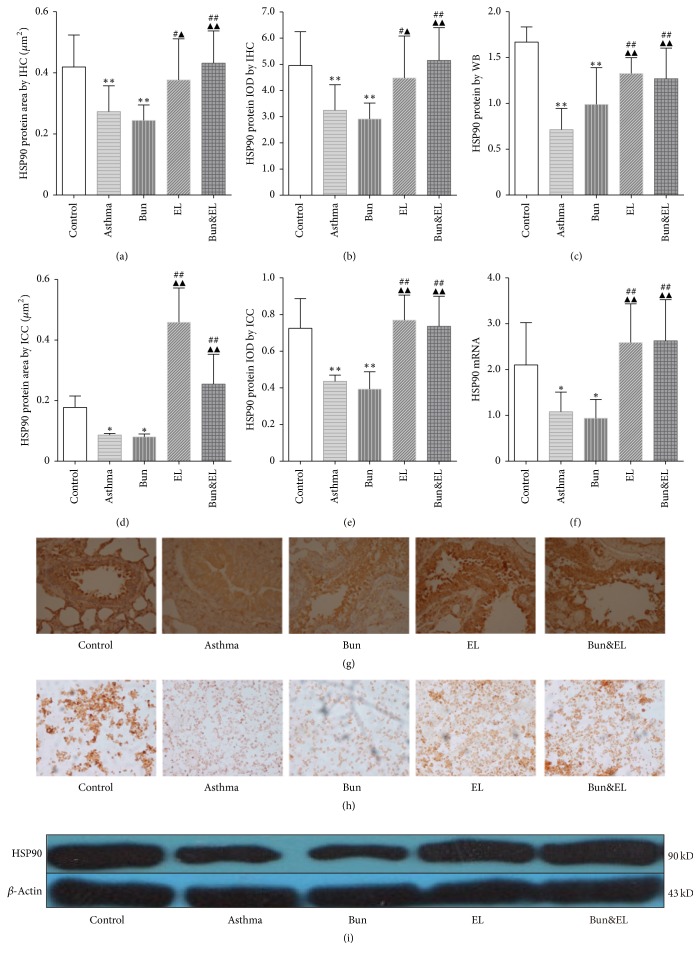
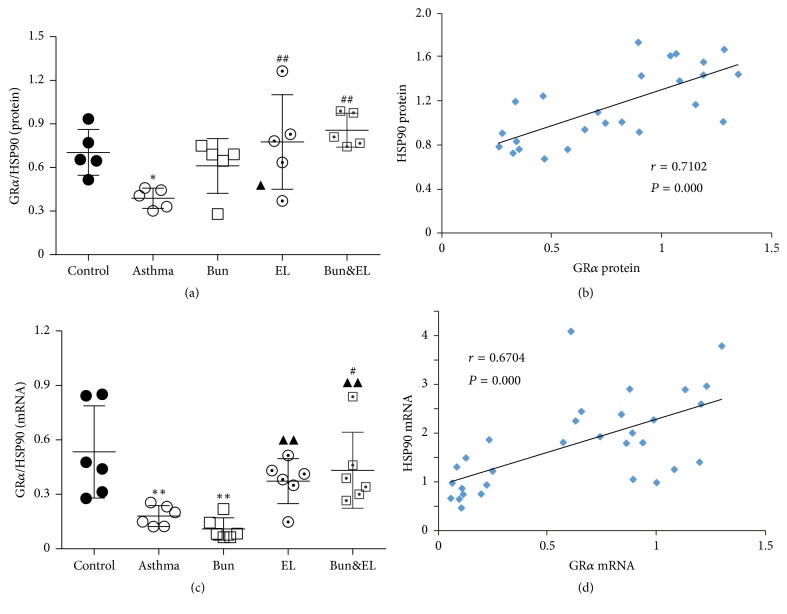
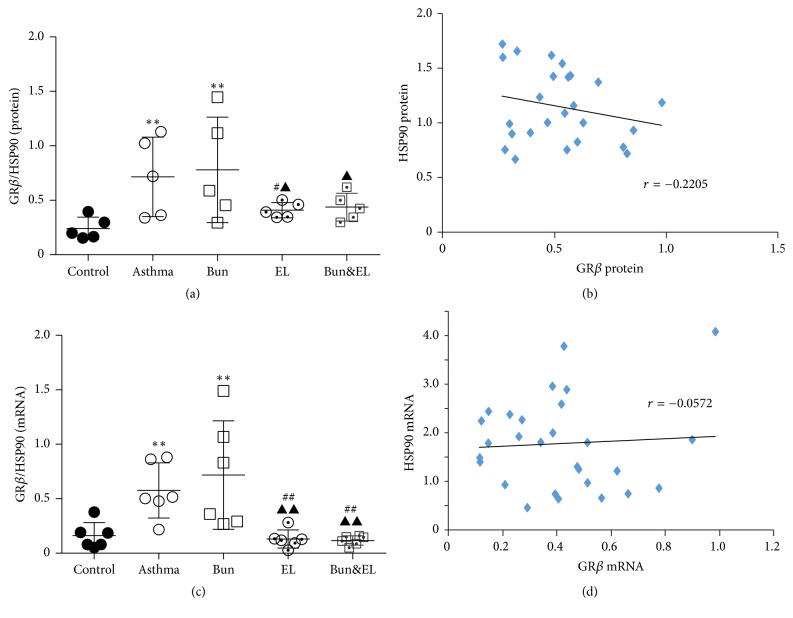
This study aimed to investigate the possible molecular mechanisms of active ingredients of Epimedii Folium (EF) and Ligustri Lucidi Fructus (LLF) combined with Budesonide (Bun) in asthmatic rats. Rats were divided into 5 groups, including normal group, asthma model group, Bun group, group of active ingredients of EL and LLF (EL), and group of coadministration of Bun with EL (Bun&EL). The asthmatic model was prepared by ovalbumin sensitizing and challenging. Lymphocyte apoptosis, GR protein and binding, and the protein and mRNA of GRα, GRβ, and HSP90 were tested. The results showed that Bun&EL ① markedly increased lymphocyte apoptosis, GR and HSP90 protein, and GR binding in BALF and ② enhanced the expressions of GRα and HSP90 and the ratio of GRα to GRβ or to HSP90 both in protein and in mRNA levels in lung, ③ while decrease occurred in GRβ mRNA and the mRNA ratio of GRβ to HSP90 compared with asthma or Bun group. Moreover, there was a significant correlation between GRα and GRβ in protein level, or between GRα and HSP90 both in protein and in mRNA levels. EL may effectively enhance the sensitivity of asthmatic rats to Bun via balancing GR/HSP90. And these findings will be beneficial for the treatment of asthma in the future.


Figures

Figure 1
Figure 1
Effects of Bun and EL on lymphocyte apoptosis in blood and BALF. The levels of lymphocyte apoptosis in BALF and peripheral blood were detected by FCM with TUNEL assay in control, asthma, Bun, EL, and Bun&EL groups. (a) Summarized data of MFI of lymphocyte apoptosis in BALF. (b) Summarized data of MFI of lymphocyte apoptosis in peripheral blood. Representative FCM photographs of lymphocyte apoptosis in BALF (c) and peripheral blood (d), including the single parameter histogram and the dot plots of SSC versus FSC, were viewed in control, asthma, Bun, EL, and Bun&EL groups. Values are expressed as mean ± SD. n = 7 in control, asthma, Bun, EL, and Bun&EL group, respectively. P < 0.05 versus control group; #P < 0.05 and ##P < 0.01 versus asthma group; ▲▲P < 0.01 versus Bun group.
Figure 2
Figure 2
Effects of Bun and EL on GR. GR protein and binding capacity in BALF were detected by FCM in control, asthma, Bun, EL, and Bun&EL groups. (a) Summarized data of MFI of GR protein in BALF. (b) Summarized data of MFI of GR binding capacity in BALF. (c) The mRNA expression of GR was measured by qPCR analysis with 18S as an internal control. Representative FCM photographs of GR protein (d) or GR binding capacity (e) in BALF, including the single parameter histogram and the dot plots of SSC versus FSC, were viewed in control, asthma, Bun, EL, and Bun&EL groups. Values are expressed as mean ± SD. n = 6 in control, asthma, Bun, EL, and Bun&EL group, respectively. P < 0.05 versus control group; #P < 0.05 and ##P < 0.01 versus asthma group; P < 0.05 and ▲▲P < 0.01 versus Bun group. P < 0.05 versus control group.
Figure 3
Figure 3
Effects of Bun and EL on GRα. GRα protein and mRNA expressions in lung tissues were detected by IHC, WB, and qPCR. (a) Summarized data of positive area of GRα protein expression in lung tissues measured by IHC. (b) Summarized data of IOD of GRα protein expression in lung tissues measured by IHC. (c) Summarized data of sumdensity of GRα protein expression in lung tissues measured by WB, normalized to β-actin. (d) The mRNA expression of GRα was measured by qPCR analysis with 18S as an internal control. (e) Representative IHC photographs of GRα were viewed at a magnification of 400x in control, asthma, Bun, EL, and Bun&EL groups. (f) Representative WB photographs of GRα were viewed, and β-actin was used for normalization in control, asthma, Bun, EL, and Bun&EL groups. Values are expressed as mean ± SD. n = 7 (a, b), n = 5 (c), or n = 6 (d). P < 0.05 and ∗∗P < 0.01 versus control group; ##P < 0.01 versus asthma group; P < 0.05 and ▲▲P < 0.01 versus Bun group. #P < 0.05.
Figure 4
Figure 4
Effects of Bun and EL on GRβ expression. GRβ protein and mRNA expressions in lung tissues were detected by IHC, WB, and qPCR. (a) Summarized data of positive area of GRβ protein expression in lung tissues measured by IHC. (b) Summarized data of IOD of GRβ protein expression in lung tissues measured by IHC. (c) Summarized data of sumdensity of GRβ protein expression in lung tissues measured by WB, normalized to β-actin. (d) The mRNA expression of GRβ was measured by qPCR analysis with 18S as an internal control. (e) Representative IHC photographs of GRβ were viewed at a magnification of 400x in control, asthma, Bun, EL, and Bun&EL groups. (f) Representative WB photographs of GRβ were viewed, and β-actin was used for normalization in control, asthma, Bun, EL, and Bun&EL groups. Values are expressed as mean ± SD. n = 7 (a, b), n = 5 (c), and n = 6 (d). P < 0.05 and ∗∗P < 0.01 versus control group; #P < 0.05 versus asthma group; P < 0.05 versus Bun group.
Figure 5
Figure 5
Effects of Bun and EL on correlation between GRα and GRβ. (a) The ratio of GRα to GRβ was calculated in the level of relative protein measured by WB, normalized to β-actin. (b) The correlation between GRα and GRβ was analyzed in the level of relative protein measured by WB, normalized to β-actin. (c) The ratio of GRα to GRβ was calculated in the level of relative mRNA expression measured by qPCR with 18S as an internal control. (d) The correlation between GRα and GRβ was analyzed in the level of relative mRNA expression measured by qPCR with 18S as an internal control. Values are expressed as mean ± SD. n = 5 (a), n = 6 (c), n = 25 (b), or n = 30 (d). ∗∗P < 0.01 versus control group; ##P < 0.01 versus asthma group; ▲▲P < 0.01 versus Bun group.
Figure 6
Figure 6
Effects of Bun and EL on HSP90. HSP90 protein and mRNA expressions in lung tissues were detected by IHC, WB, and qPCR. And HSP90 protein expression in BALF was detected by ICC. (a) Summarized data of positive area of HSP90 protein expression in lung tissues measured by IHC. (b) Summarized data of IOD of HSP90 protein expression in lung tissues measured by IHC. (c) Summarized data of sumdensity of HSP90 protein expression in lung tissues measured by WB, normalized to β-actin. (d) Summarized data of positive area of HSP90 protein expression in BALF measured by ICC. (e) Summarized data of IOD of HSP90 protein expression in BALF measured by ICC. (f) The mRNA expression of HSP90 was measured by qPCR analysis with 18S as an internal control. (g) Representative IHC photographs of HSP90 were viewed at a magnification of 400x in control, asthma, Bun, EL, and Bun&EL groups. (h) Representative ICC photographs of HSP90 were viewed at a magnification of 400x in control, asthma, Bun, EL, and Bun&EL groups. (i) Representative WB photographs of GRβ were viewed, and β-actin was used for normalization in control, asthma, Bun, EL, and Bun&EL groups. Values are expressed as mean ± SD. n = 8 (a, b) and n = 6 (c, d, e, f). P < 0.05 and ∗∗P < 0.01 versus control group; #P < 0.05 and ##P < 0.01 versus asthma group; P < 0.05 and ▲▲P < 0.01 versus Bun group.
Figure 7
Figure 7
Effects of Bun and EL on correlation between GRα and HSP90. (a) The ratio of GRα to HSP90 was calculated in the level of relative protein measured by WB, normalized to β-actin. (b) The correlation between GRα and HSP90 was analyzed in the level of relative protein measured by WB, normalized to β-actin. (c) The ratio of GRα to HSP90 was calculated in the level of relative mRNA expression measured by qPCR with 18S as an internal control. (d) The correlation between GRα and HSP90 was analyzed in the level of relative mRNA expression measured by qPCR with 18S as an internal control. Values are expressed as mean ± SD. n = 5 (a), n = 6 (c), n = 25 (b), and n = 30 (d). ∗∗P < 0.01 versus control group. #P < 0.05 and ##P < 0.01 versus asthma group; P < 0.05 and ▲▲P < 0.01 versus Bun group. P < 0.05 versus control group.
Figure 8
Figure 8
Effects of Bun and EL on correlation between GRβ and HSP90. (a) The ratio of GRβ to HSP90 was calculated in the level of relative protein measured by WB, normalized to β-actin. (b) The correlation between GRβ and HSP90 was analyzed in the level of relative protein measured by WB, normalized to β-actin. (c) The ratio of GRβ to HSP90 was calculated in the level of relative mRNA expression measured by qPCR with 18S as an internal control. (d) The correlation between GRβ and HSP90 was analyzed in the level of relative mRNA expression measured by qPCR with 18S as an internal control. Values are expressed as mean ± SD. n = 5 (a), n = 6 (c), n = 25 (b), and n = 30 (d).∗∗P < 0.01 versus control group. #P < 0.05 and ##P < 0.01 versus asthma group; P < 0.05 and ▲▲P < 0.01 versus Bun group.

Similar articles

Cited by

References

    1. Agarwal R., Gupta D. Severe asthma and fungi: current evidence. Medical Mycology. 2011;49(Supplement 1):S150–S157. doi: 10.3109/13693786.2010.504752. - DOI - PubMed
    1. Covar R. A. Pivotal efficacy trials of inhaled corticosteroids in asthma. Annals of Allergy, Asthma & Immunology. 2016;117(6):582–588. doi: 10.1016/j.anai.2016.07.035. - DOI - PubMed
    1. Barnes P. J. Glucocorticosteroids: current and future directions. British Journal of Pharmacology. 2011;163(1):29–43. doi: 10.1111/j.1476-5381.2010.01199.x. - DOI - PMC - PubMed
    1. Zhang P., Fang L., Wu H., Ding P., Shen Q., Liu R. Down-regulation of GRα expression and inhibition of its nuclear translocation by hypoxia. Life Sciences. 2016;146:92–99. doi: 10.1016/j.lfs.2015.12.059. - DOI - PubMed
    1. Zöllner E. W., Lombard C., Galal U., Hough S., Irusen E., Weinberg E. Hypothalamic-pituitary-adrenal axis suppression in asthmatic children on inhaled and nasal corticosteroids - more common than expected? Journal of Pediatric Endocrinology and Metabolism. 2011;24(7-8):529–534. doi: 10.1515/JPEM.2011.198. - DOI - PubMed

LinkOut - more resources