

Transcriptome analysis reveals the regulation of brassinosteroids on petal growth in Gerbera hybrida
- PMID: 28584713
- PMCID: PMC5455292
- DOI: 10.7717/peerj.3382
Transcriptome analysis reveals the regulation of brassinosteroids on petal growth in Gerbera hybrida
Abstract
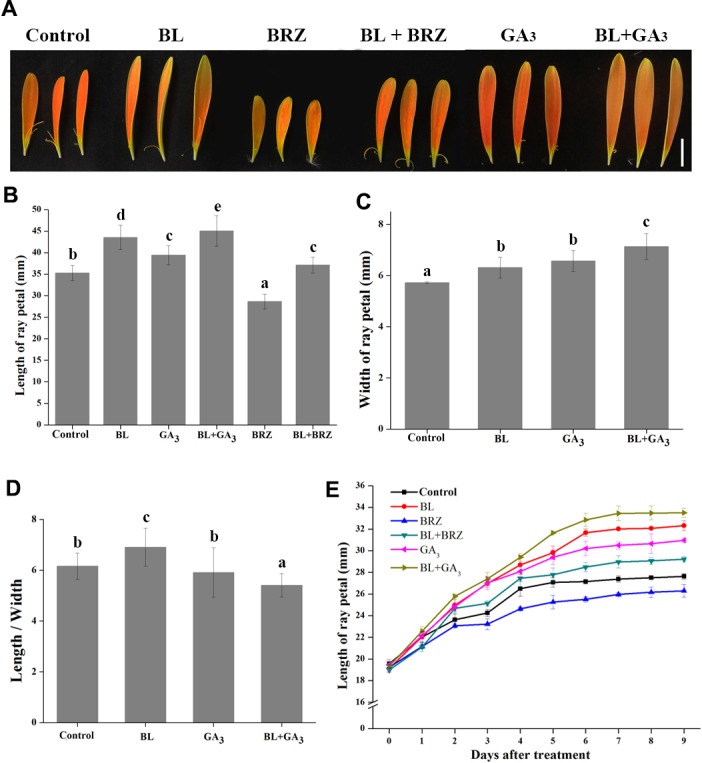
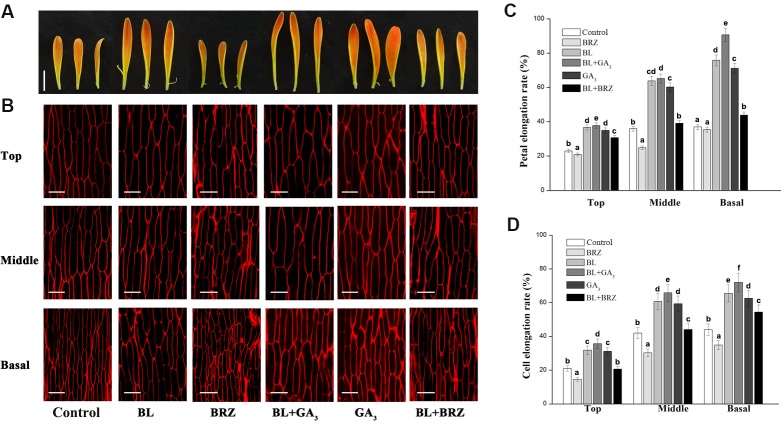
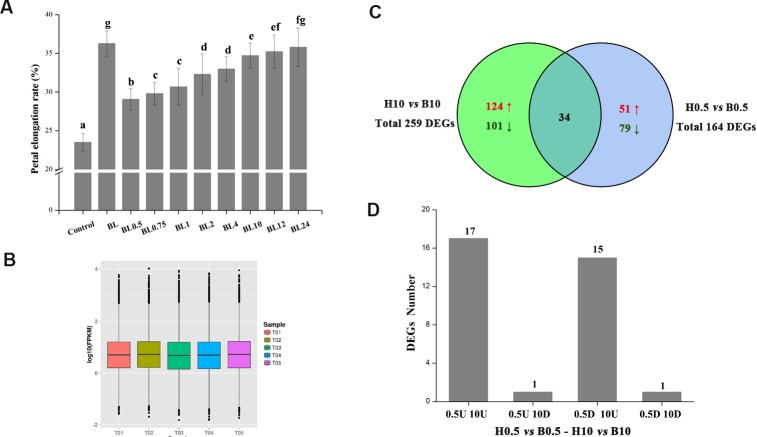
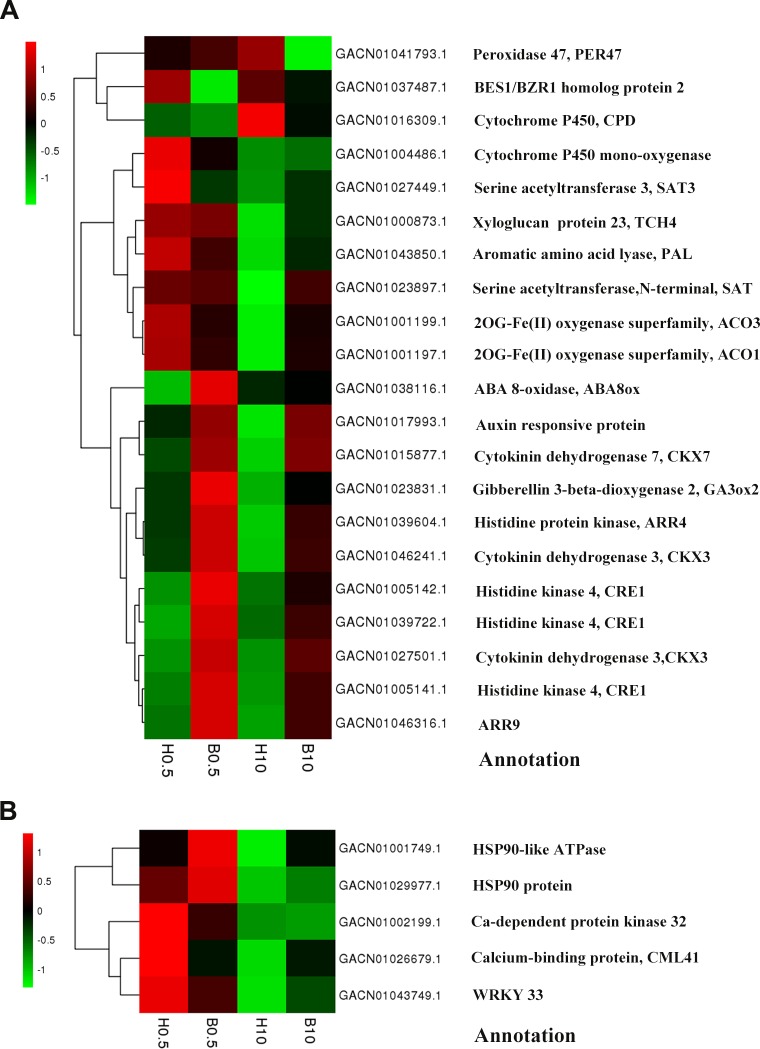
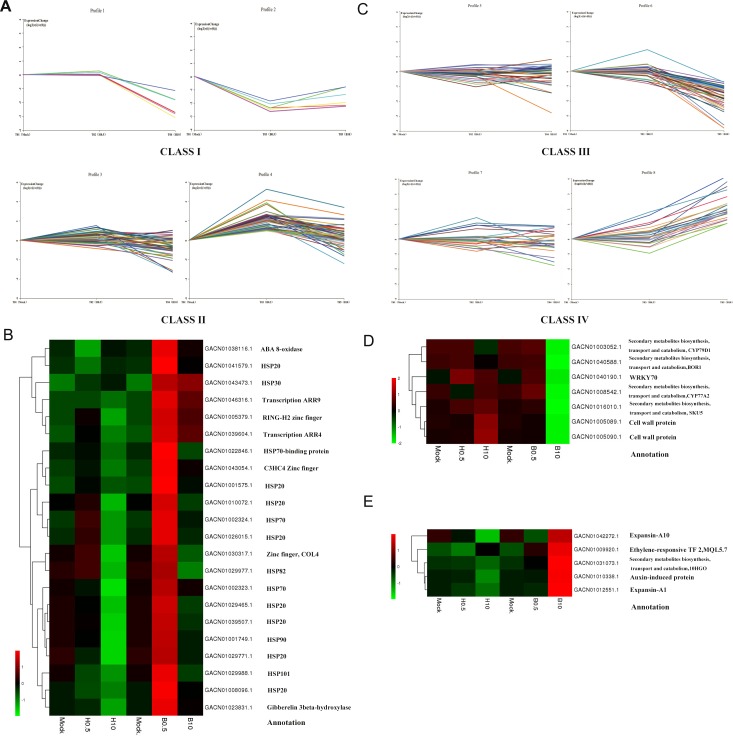
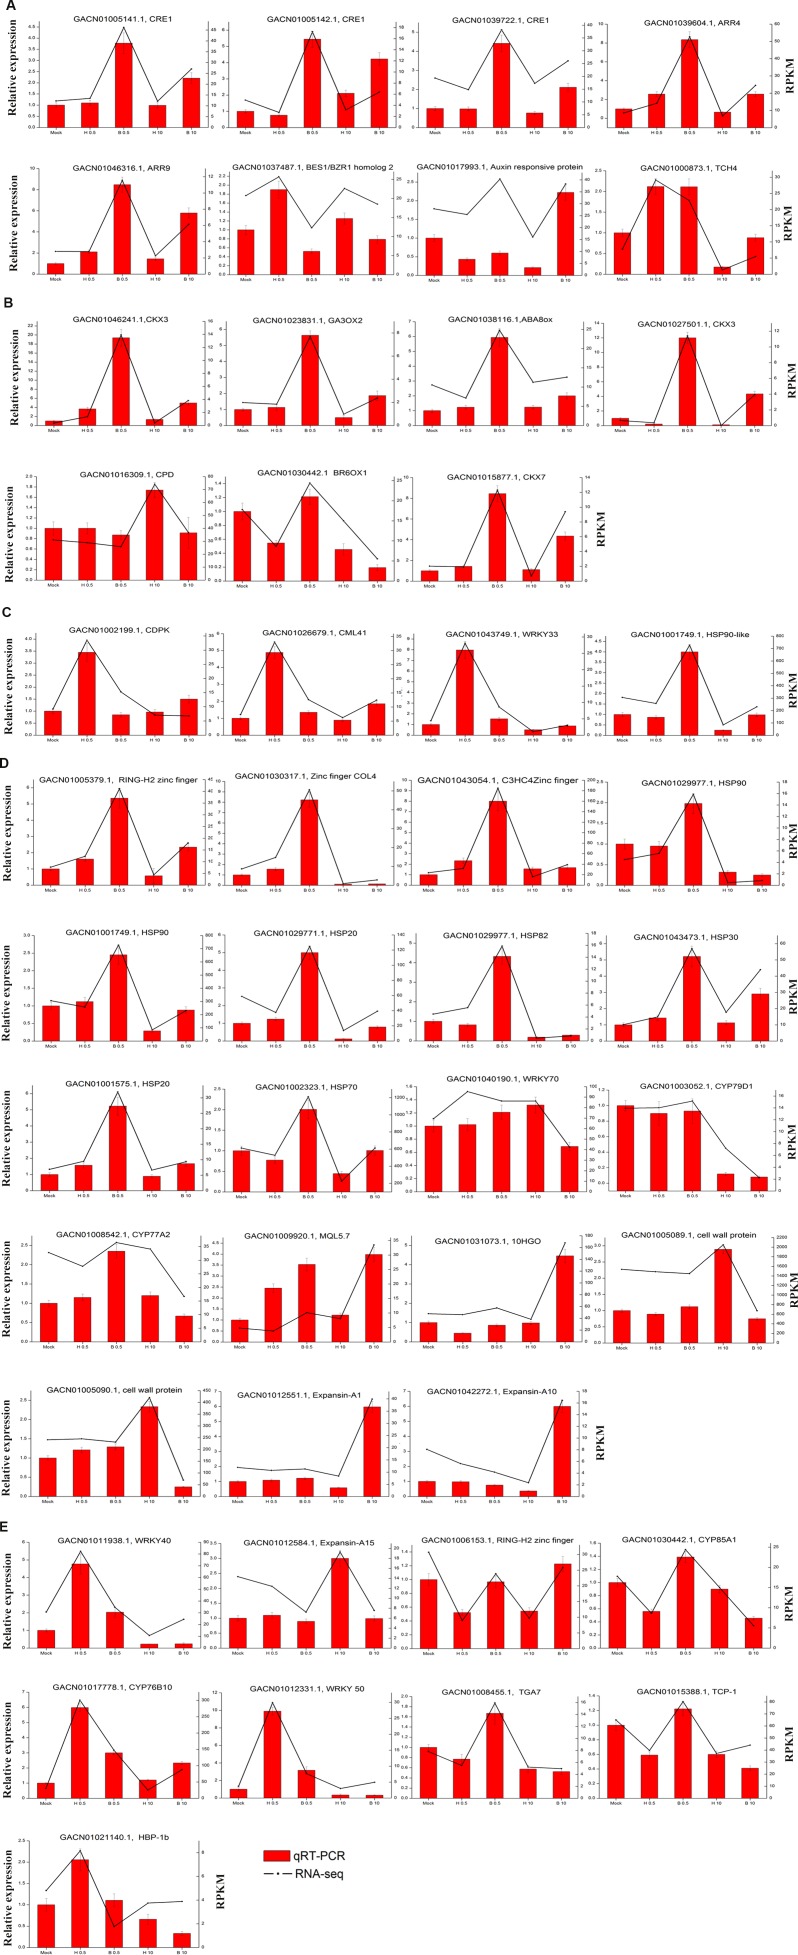
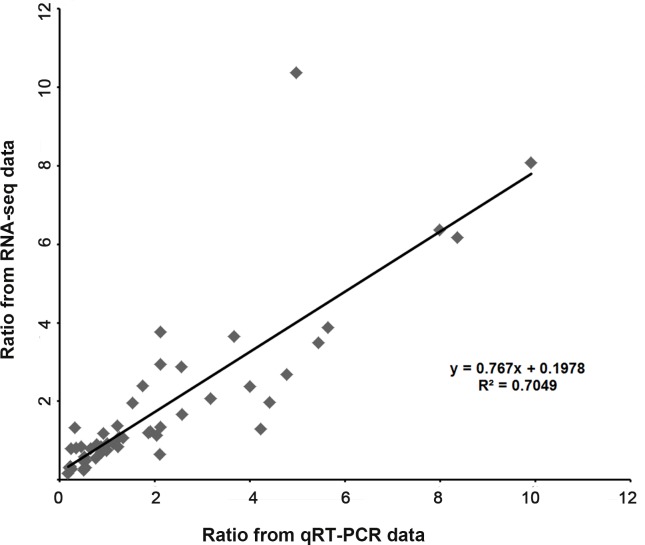
Gerbera hybrida is a cut-flower crop of global importance, and an understanding of the mechanisms underlying petal development is vital for the continued commercial development of this plant species. Brassinosteroids (BRs), a class of phytohormones, are known to play a major role in cell expansion, but their effect on petal growth in G. hybrida is largely unexplored. In this study, we found that the brassinolide (BL), the most active BR, promotes petal growth by lengthening cells in the middle and basal regions of petals, and that this effect on petal growth was greater than that of gibberellin (GA). The RNA-seq (high-throughput cDNA sequencing) technique was employed to investigate the regulatory mechanisms by which BRs control petal growth. A global transcriptome analysis of the response to BRs in petals was conducted and target genes regulated by BR were identified. These differentially expressed genes (DEGs) include various transcription factors (TFs) that were activated during the early stage (0.5 h) of BL treatment, as well as cell wall proteins whose expression was regulated at a late stage (10 h). BR-responsive DEGs are involved in multiple plant hormone signal pathways, hormone biosynthesis and biotic and abiotic stress responses, showing that the regulation of petal growth by BRs is a complex network of processes. Thus, our study provides new insights at the transcriptional level into the molecular mechanisms of BR regulation of petal growth in G. hybrida.
Keywords: Brassinolide; Gerbera hybrida; Petal growth; RNA-seq; Regulation.
Conflict of interest statement
The authors declare there are no competing interests.
Figures
Similar articles
-
Transcriptomic insights into antagonistic effects of gibberellin and abscisic acid on petal growth in Gerbera hybrida.Front Plant Sci. 2015 Mar 17;6:168. doi: 10.3389/fpls.2015.00168. eCollection 2015. Front Plant Sci. 2015. PMID: 25852718 Free PMC article.
-
14-3-3 Proteins Are Involved in BR-Induced Ray Petal Elongation in Gerbera hybrida.Front Plant Sci. 2021 Aug 4;12:718091. doi: 10.3389/fpls.2021.718091. eCollection 2021. Front Plant Sci. 2021. PMID: 34421972 Free PMC article.
-
Comparative RNA-Seq analysis reveals a critical role for brassinosteroids in rose (Rosa hybrida) petal defense against Botrytis cinerea infection.BMC Genet. 2018 Aug 20;19(1):62. doi: 10.1186/s12863-018-0668-x. BMC Genet. 2018. PMID: 30126371 Free PMC article.
-
Brassinosteroids, the Sixth Class of Phytohormones: A Molecular View from the Discovery to Hormonal Interactions in Plant Development and Stress Adaptation.Int J Mol Sci. 2019 Jan 15;20(2):331. doi: 10.3390/ijms20020331. Int J Mol Sci. 2019. PMID: 30650539 Free PMC article. Review.
-
Biosynthesis and metabolism of brassinosteroids.Annu Rev Plant Biol. 2003;54:137-64. doi: 10.1146/annurev.arplant.54.031902.134921. Annu Rev Plant Biol. 2003. PMID: 14502988 Review.
Cited by
-
Phenotypic Variation in Flower Color and Morphology in the Gerbera (Gerbera hybrida) F1 Hybrid Population and Their Association with EST-SSR Markers.Int J Mol Sci. 2023 Dec 22;25(1):203. doi: 10.3390/ijms25010203. Int J Mol Sci. 2023. PMID: 38203375 Free PMC article.
-
A GASA Protein Family Gene, CmGEG, Inhibits Petal Growth in Chrysanthemum.Int J Mol Sci. 2024 Mar 16;25(6):3367. doi: 10.3390/ijms25063367. Int J Mol Sci. 2024. PMID: 38542341 Free PMC article.
-
Floral Development Stage-Specific Transcriptomic Analysis Reveals the Formation Mechanism of Different Shapes of Ray Florets in Chrysanthemum.Genes (Basel). 2023 Mar 21;14(3):766. doi: 10.3390/genes14030766. Genes (Basel). 2023. PMID: 36981036 Free PMC article.
-
Brassinosteroids regulate petal spur length in Aquilegia by controlling cell elongation.Ann Bot. 2021 Nov 9;128(7):931-942. doi: 10.1093/aob/mcab116. Ann Bot. 2021. PMID: 34508638 Free PMC article.
-
Genome-wide identification, characterization, and expression analysis of BZR transcription factor family in Gerbera hybrida.BMC Plant Biol. 2025 Feb 4;25(1):143. doi: 10.1186/s12870-025-06177-7. BMC Plant Biol. 2025. PMID: 39905281 Free PMC article.
References
LinkOut - more resources
Full Text Sources
Other Literature Sources
