Review
. 2017 Oct;134(4):537-566.
doi: 10.1007/s00401-017-1736-4. Epub 2017 Jun 5.

Autism spectrum disorder: neuropathology and animal models

Affiliations
Review

Autism spectrum disorder: neuropathology and animal models

Merina Varghese et al. Acta Neuropathol. 2017 Oct.

Abstract

Autism spectrum disorder (ASD) has a major impact on the development and social integration of affected individuals and is the most heritable of psychiatric disorders. An increase in the incidence of ASD cases has prompted a surge in research efforts on the underlying neuropathologic processes. We present an overview of current findings in neuropathology studies of ASD using two investigational approaches, postmortem human brains and ASD animal models, and discuss the overlap, limitations, and significance of each. Postmortem examination of ASD brains has revealed global changes including disorganized gray and white matter, increased number of neurons, decreased volume of neuronal soma, and increased neuropil, the last reflecting changes in densities of dendritic spines, cerebral vasculature and glia. Both cortical and non-cortical areas show region-specific abnormalities in neuronal morphology and cytoarchitectural organization, with consistent findings reported from the prefrontal cortex, fusiform gyrus, frontoinsular cortex, cingulate cortex, hippocampus, amygdala, cerebellum and brainstem. The paucity of postmortem human studies linking neuropathology to the underlying etiology has been partly addressed using animal models to explore the impact of genetic and non-genetic factors clinically relevant for the ASD phenotype. Genetically modified models include those based on well-studied monogenic ASD genes (NLGN3, NLGN4, NRXN1, CNTNAP2, SHANK3, MECP2, FMR1, TSC1/2), emerging risk genes (CHD8, SCN2A, SYNGAP1, ARID1B, GRIN2B, DSCAM, TBR1), and copy number variants (15q11-q13 deletion, 15q13.3 microdeletion, 15q11-13 duplication, 16p11.2 deletion and duplication, 22q11.2 deletion). Models of idiopathic ASD include inbred rodent strains that mimic ASD behaviors as well as models developed by environmental interventions such as prenatal exposure to sodium valproate, maternal autoantibodies, and maternal immune activation. In addition to replicating some of the neuropathologic features seen in postmortem studies, a common finding in several animal models of ASD is altered density of dendritic spines, with the direction of the change depending on the specific genetic modification, age and brain region. Overall, postmortem neuropathologic studies with larger sample sizes representative of the various ASD risk genes and diverse clinical phenotypes are warranted to clarify putative etiopathogenic pathways further and to promote the emergence of clinically relevant diagnostic and therapeutic tools. In addition, as genetic alterations may render certain individuals more vulnerable to developing the pathological changes at the synapse underlying the behavioral manifestations of ASD, neuropathologic investigation using genetically modified animal models will help to improve our understanding of the disease mechanisms and enhance the development of targeted treatments.

Keywords: Autism spectrum disorder; Cerebral cortex; Genetically modified animal models; Idiopathic autism models; Neuronal morphology; Synapse.


Conflict of interest statement

Conflict of interest: The authors declare that they have no conflict of interest.

Figures

Fig. 1
Fig. 1. Brain areas that show neuropathological changes implicated in ASD
Nissl-stained right hemispheres showing areas implicated in ASD, with panels (a) to (c) arranged in rostro-caudal order. (a) The anterior cingulate cortex (ACC), prefrontal cortex (PFC) and frontoinsular cortex (FI); (b) amygdala (Amyg) and the fusiform gyrus (FG); (c) brainstem (Bs; at the level of the pons), hippocampus (Hpc), and cerebellum (Cb). Human brain from the (d) left lateral, (e) mid-sagittal, and (f) ventral view, showing the areas represented in (a–c). Brain regions visible on the displayed surface (ACC, PFC, FG) are indicated using filled areas, whereas those that are hidden beneath outer structures (FI, Amyg, Hpc) or not included in the image (Bs, Cb) are indicated by outlines approximating the location. The vertical lines indicate the approximate location of each of the sections shown in (a–c). Scale bar = 1 cm for (a–c) and 2 cm for (d–f)
Fig. 2
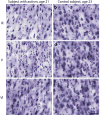
Fig. 2. Decreased perikaryal size in ASD
Neuropathologic changes in layers III, V, and VI of the fusiform gyrus in a subject with ASD compared to an age-matched control subject. Note the marked decrease perikaryal size in layers III (a) and V (c) and the less prominent decrease in perikaryal size in layer VI (e) in the subject with ASD, compared to the respective layers in the control subject (b), (d), and (f). Scale bar = 50 μm
Fig. 3
Fig. 3. Abnormal neuronal morphology in ASD
Typical and abnormal morphology of von Economo neurons (VENs). (a) Typical pyramidal cell in a control subject; (b, c) typical VEN (arrowhead) alongside a pyramidal cell; (d) abnormal morphology of VENs found in subjects with ASD: note the corkscrew dendrites (arrows), swollen soma and surrounding oligodendrocytes (arrowheads). Scale bar = 10 μm
Fig. 4
Fig. 4. Altered cell distribution in ASD
Cortical layers I–VI of subjects with ASD and control subjects in two areas implicated in ASD. Lamination is slightly less distinct in both the frontoinsular cortex (a) and anterior cingulate cortex (c) in subjects with ASD compared to controls (b) and (d), respectively. However, no immediately obvious differences are visible at this magnification between ASD and control materials, stressing the importance of rigorous quantitative studies to reveal regional and laminar alterations in the cellular integrity and architecture of the cerebral cortex in ASD. Scale bar = 200 μm
Fig. 5
Fig. 5. Altered ultrastructure of synapses in a mouse model of monogenic ASD
Perforated synapse density was higher in the hippocampus CA1 field of young Shank3-deficient heterozygotes (b) compared to Shank3-homozygotes (c) and WT controls (a). PSDs are visible as electron-dense areas on the postsynaptic side and are discontinuous in perforated synapses (postsynaptic side shown in pink), but continuous in non-perforated synapses (blue). The enlarged inset in (b) has arrows pointing from the postsynaptic side towards a discontinuous (double arrows) PSD and a continuous PSD (single arrow). Presynaptic terminals are indicated in orange. Scale bar = 500 nm. The difference was only apparent at 3 weeks and perforated synapse densities in both groups were comparable by the age of 5 months. (Modified from [359])
Fig. 6
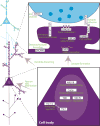
Fig. 6. Schematic representation of synaptic function of genes studied in models of ASD
Findings from different studies converge at the synapse, pointing to a deficit in the function of one or more synaptic proteins necessary for neural transmission and activity-dependent changes in spine dynamics. The cells in green and purple represent excitatory neurons and the orange cell is an inhibitory neuron. The proteins implicated in synaptic changes seen in ASD are represented in boxes, with their respective functions indicated in red text. SCN2A = sodium channel, voltage-gated, type 2 alpha subunit; NRXN = neurexin; NLGN = neuroligin; SHANK3 = SH3 and multiple ankyrin repeat domains protein 3, shown bound to glutamate receptors (blue Ys) and neuroligin via interacting proteins (brown dots); UBE3A = E6AP-E3 Ubiquitin Protein Ligase; FMRP = fragile X mental retardation protein, shown bound to an mRNA; TSC1/2 = tuberous sclerosis 1 or 2; MECP2 = Methyl-CpG-binding protein 2; CHD8 = Chromodomain helicase DNA-binding protein 8; SYNGAP1 = Synaptic GTPase activating protein 1; ARID1B = AT-rich interactive domain containing protein 1B; GRIN2B = Glutamate receptor ionotropic, NMDA 2B; DSCAM = Down syndrome cell adhesion molecule; TBR1 = T-brain-1.

References

    1. Abrahams BS, Geschwind DH. Nat Rev Genet. 2008;9:341–355. doi: 10.1038/nrg2346. - DOI - PMC - PubMed
    1. Aceti M, Creson TK, Vaissiere T, Rojas C, Huang WC, Wang YX, Petralia RS, Page DT, Miller CA, Rumbaugh G. Biol Psychiatry. 2015;77:805–815. doi: 10.1016/j.biopsych.2014.08.001. - DOI - PMC - PubMed
    1. Akashi K, Kakizaki T, Kamiya H, Fukaya M, Yamasaki M, Abe M, Natsume R, Watanabe M, Sakimura K. J Neurosci. 2009;29:10869–10882. doi: 10.1523/JNEUROSCI.5531-08.2009. - DOI - PMC - PubMed
    1. Allman J, Hakeem A, Watson K. Neuroscientist. 2002;8:335–346. - PubMed
    1. Allman JM, Tetreault NA, Hakeem AY, Manaye KF, Semendeferi K, Erwin JM, Goubert V, Hof PR. Brain Struct Funct. 2010;214:495–517. - PubMed