. 2017 Aug;174(16):2716-2738.
doi: 10.1111/bph.13899. Epub 2017 Jul 11.

Blockade of the 5-HT transporter contributes to the behavioural, neuronal and molecular effects of cocaine

Affiliations

Blockade of the 5-HT transporter contributes to the behavioural, neuronal and molecular effects of cocaine

Linda D Simmler et al. Br J Pharmacol. 2017 Aug.

Abstract

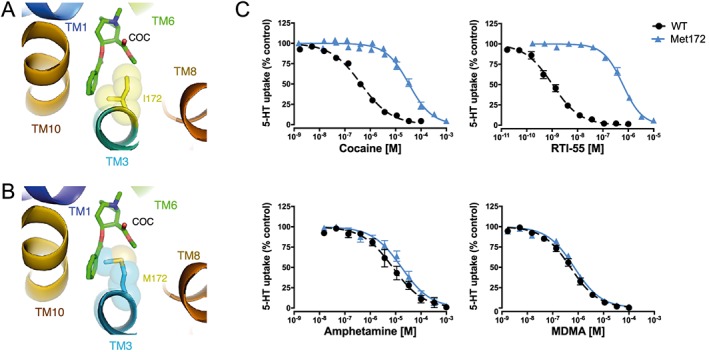
Background and purpose: The psychostimulant cocaine induces complex molecular, cellular and behavioural responses as a consequence of inhibiting presynaptic dopamine, noradrenaline and 5-HT transporters. To elucidate 5-HT transporter (SERT)-specific contributions to cocaine action, we evaluated cocaine effects in the SERT Met172 knock-in mouse, which expresses a SERT coding substitution that eliminates high-affinity cocaine recognition.

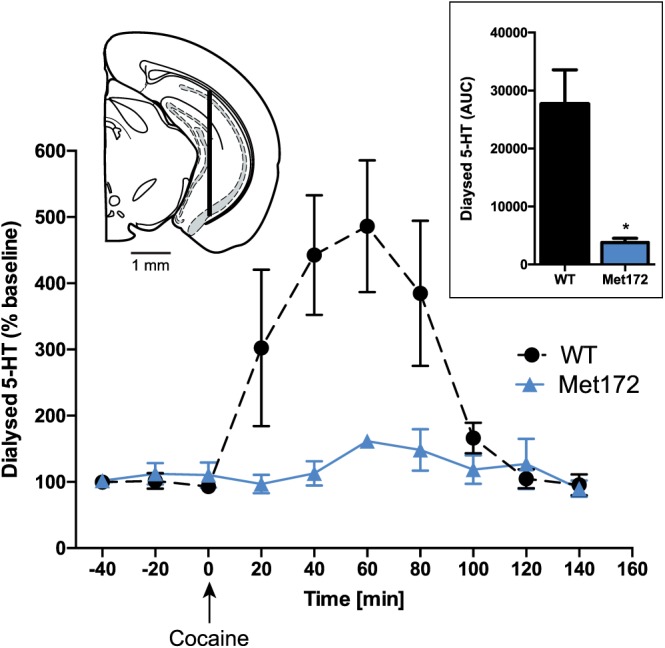
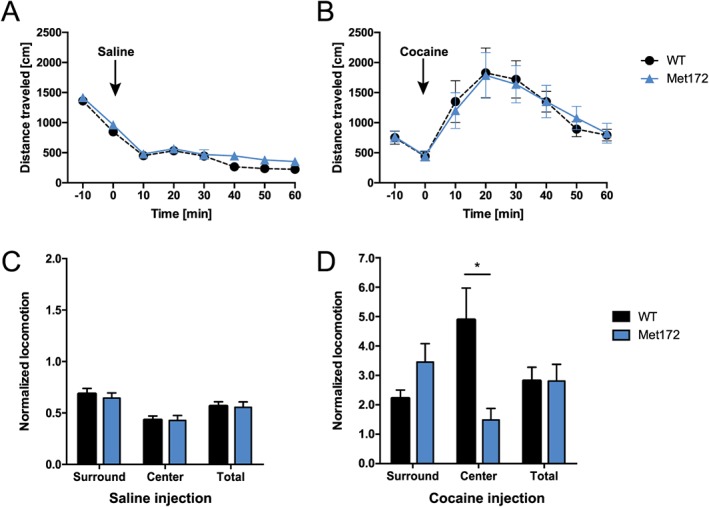
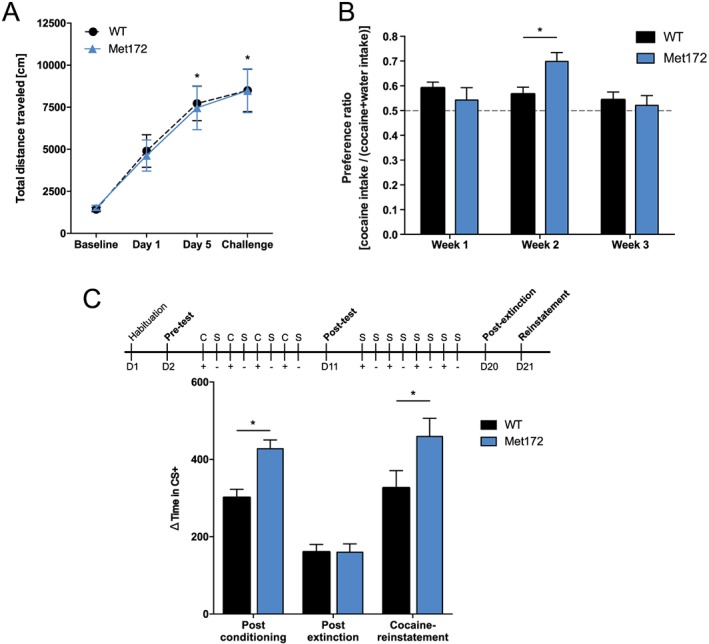
Experimental approach: We measured the effects of SERT Met172 on cocaine antagonism of 5-HT re-uptake using ex vivo synaptosome preparations and in vivo microdialysis. We assessed SERT dependence of cocaine actions behaviourally through acute and chronic locomotor activation, sensitization, conditioned place preference (CPP) and oral cocaine consumption. We used c-Fos, quantitative RT-PCR and RNA sequencing methods for insights into cellular and molecular networks supporting SERT-dependent cocaine actions.

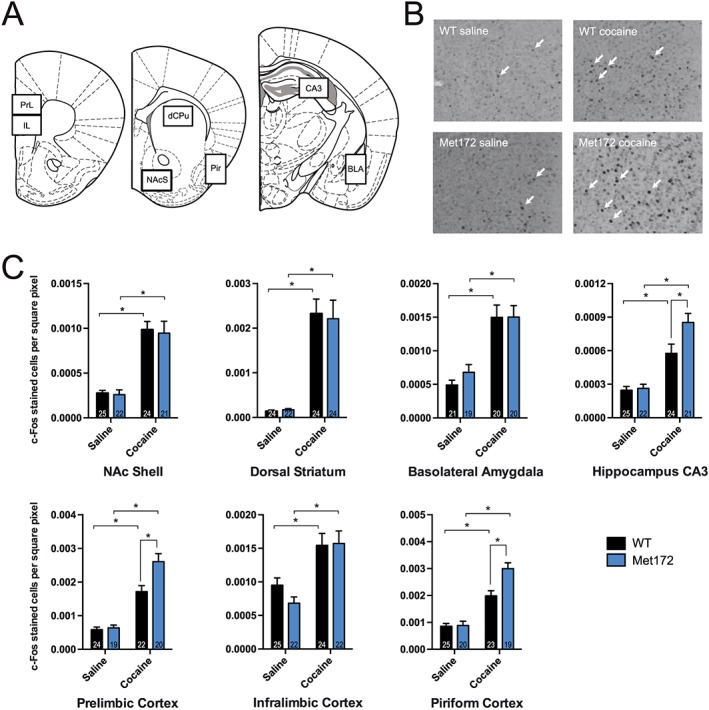
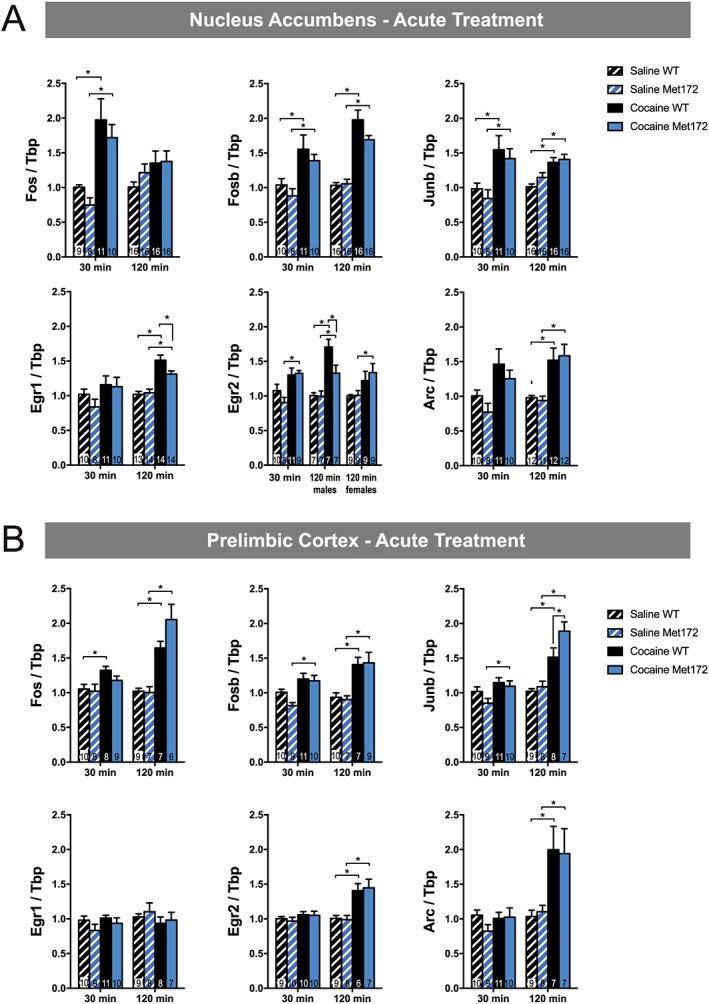
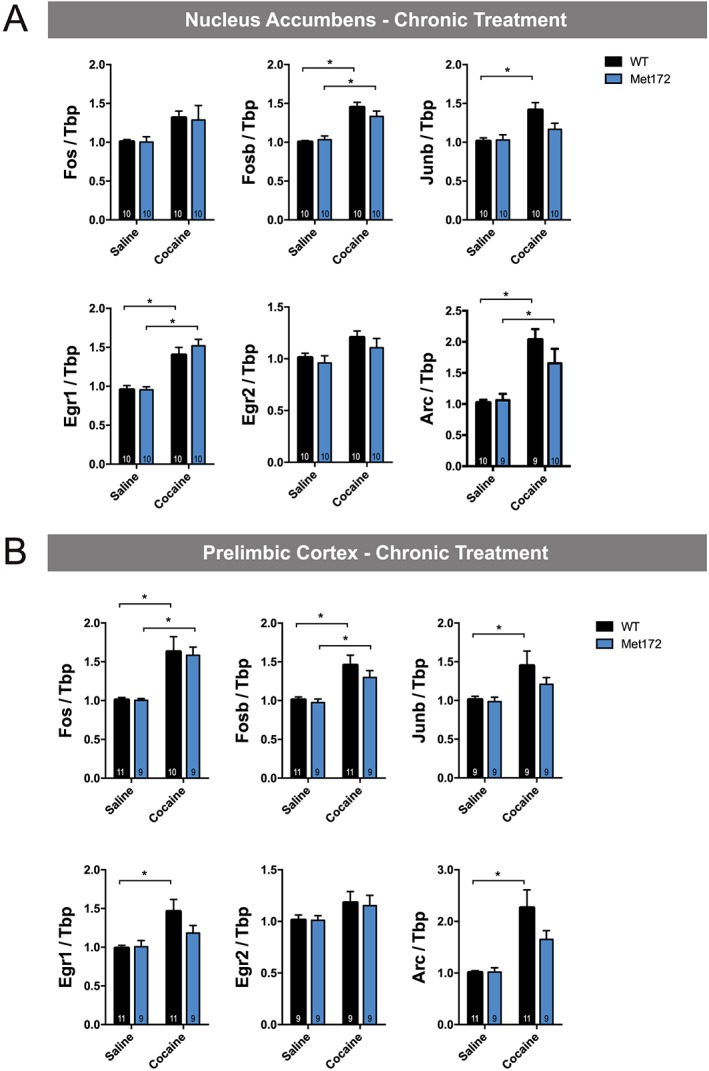
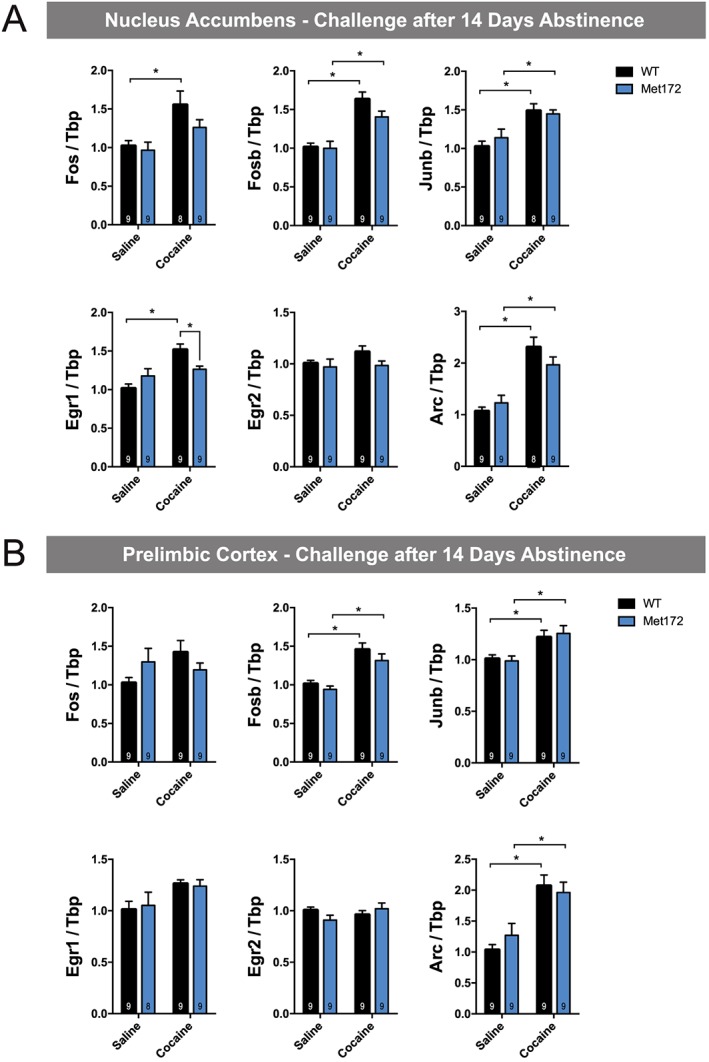
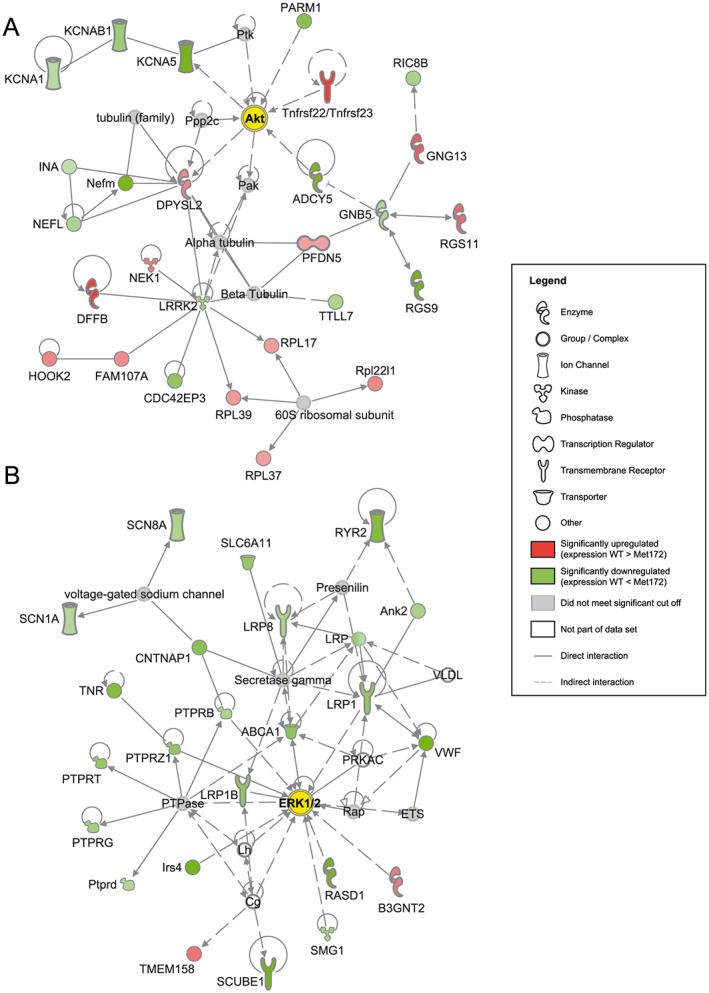
Key results: SERT Met172 mice demonstrated functional insensitivity for cocaine at SERT. Although they displayed wild-type levels of acute cocaine-induced hyperactivity or chronic sensitization, the pattern of acute motor activation was different, with a bias toward thigmotaxis. CPP was increased, and a time-dependent elevation in oral cocaine consumption was observed. SERT Met172 mice displayed relatively higher levels of neuronal activation in the hippocampus, piriform cortex and prelimbic cortex (PrL), accompanied by region-dependent changes in immediate early gene expression. Distinct SERT-dependent gene expression networks triggered by acute and chronic cocaine administration were identified, including PrL Akt and nucleus accumbens ERK1/2 signalling.

Conclusion and implications: Our studies reveal distinct SERT contributions to cocaine action, reinforcing the possibility of targeting specific aspects of cocaine addiction by modulation of 5-HT signalling.


Figures

Figure 1
Figure 1
Homology models of mouse SERT Ile172 (A) and Met172 (B) superimposed on the Drosophila DAT‐cocaine co‐crystal structure suggest steric overlap of the Met172 side chain with cocaine. The Ile/Met172 side chain is shown as semi‐transparent spheres and cocaine (COC) from the 4XP4 structure is shown in stick mode. Transmembrane domains (TMs) illustrated are part of the binding pocket. (C) The steric overlap of Met172 with cocaine depicts one potential basis for the loss of high‐affinity binding and a subsequent shift in uptake inhibition potency of cocaine for 5‐HT transport, as shown with ex vivo preparation of synaptosomes from WT and SERT Met172 mice. The potency shift is also evident for the cocaine‐analogue RTI‐55, whereas amphetamine and MDMA potencies are not affected by the mutation. Data are mean ± SEM of independent experiments (n = 5 for all, except n = 4 for MDMA WT and n = 3 for MDMA Met172) performed in triplicate. IC50 values ± SEM (n = 5 for all, except n = 4 for MDMA WT and n = 3 for MDMA Met172) are IC50; cocaine, WT = 0.45 ± 0.03 μM, IC50; cocaine, Met172 = 36 ± 7 μM, IC50; RTI‐55, WT = 1.1 ± 0.2 nM, IC50; RTI‐55, Met172 = 0.62 ± 0.10 μM, IC50; amphetamine, WT = 9.4 ± 2.2 μM, IC50; amphetamine, Met172 = 19 ± 4.8 μM, IC50; MDMA, WT = 0.53 ± 0.11 μM and IC50; MDMA, Met172 = 0.71 ± 0.11 μM. IC50 values for cocaine and RTI‐55 were significantly different between WT and SERT Met172 (P < 0.05; cocaine and RTI‐55 analysed separately with Student's t‐test comparing respective WT IC50 vs. SERT Met172 IC50), but not for amphetamine (P > 0.05). Statistical comparison for MDMA was not conducted since n was <5.
Figure 2
Figure 2
In vivo microdialysis in the ventral hippocampus of SERT Met172 mice reveals a loss of 5‐HT elevations following 20 mg·kg−1 cocaine i.p. Significant main time and genotype effects in two‐way RM‐ANOVA. Inset left: probe location in hippocampus −3.18 anterior from bregma. Inset right: AUC from in vivo microdialysis studies, calculated for 100 min post injection, *P < 0.05, signficantly different from WT; unpaired Student's t‐test. Data plotted are means ± SEM; n = 5 (WT), 7 (Met172).
Figure 3
Figure 3
Locomotor response to cocaine in WT and SERT Met172 mice. Acute locomotor activity after 20 mL·kg−1 saline i.p. (A) and 15 mg·kg−1 cocaine i.p. (B) was not different between WT and SERT Met172 mice (two‐way RM‐ANOVA). I.p. injections were administered at time point 0. (C, D) Locomotor activity presented as average distance travelled in 10 min blocks during 50 min post injection normalized to individual baseline activities recorded 10 min prior to the injection. Surround and centre zone in the open field test were differentiated. No genotype differences were observed after saline treatment (C). After cocaine treatment (D), SERT Met 172 mice showed less ambulation in the centre zone than WT mice. Significant interaction effect but main drug and zone effect were not significant. Normalized locomotion is average distance travelled during 30 min post injection divided by average distance during 10 min prior to injection. Data plotted are means ± SEM, n = 27 (WT), 20 (Met172), *P < 0.05, signficantly different as indicated; two‐way ANOVA with Sidak's post hoc test.
Figure 4
Figure 4
(A) Locomotor sensitization to cocaine (15 mg·kg−1, i.p.) did not differ between WT and SERT Met172 mice. Significant main time effect in two‐way RM‐ANOVA. *P < 0.05, signficantly differences between day 5 and day 1 and between challenge and day 1; Sidak post hoc test, n = 26 (WT), 28 (Met172). (B) Two‐bottle choice test to assess consumption of cocaine (0.1 mg·mL−1) administered in the drinking water. WT mice did not change their preference for cocaine‐supplemented water relative to supplemented drinking water over time. Met172 mice showed a greater cocaine preference compared to WT in the second week (significant interaction and main time effect. Data are means ± SEM, n = 19 (WT), 8 (Met172). *P < 0.05, signficantly different from WT; two‐way ANOVA with Sidak post hoc test,. (C; top) Schematic outline of the paradigm. C, cocaine treatment (15 mg·kg−1, i.p.); S, saline treatment; +, in cocaine‐paired cue (CS+); −, in saline‐paired cue (CS−). Place preference testing occurred on days 1 (D1), 2 (D2), 11 (D11), 20 (D20) and 21 (D21). (C; bottom) Conditioned place preference Δtime in CS+ represents individual time difference spent in the cocaine‐paired chamber on test day versus pre‐conditioning day. Values are seconds from total 1200 s session time. SERT Met172 mice spent more time in CS+ than WT post conditioning and after cocaine (15 mg·kg−1) reinstatement. Significant main time and genotype effect in two‐way ANOVA, All data represent mean ± SEM; n = 76 for post conditioning and post extinction, n = 32 (WT), 28 (Met172) for reinstatement. * P < 0.05, signficantly different from WT; Sidak post hoc test.
Figure 5
Figure 5
Identification of brain regions where SERT‐inhibition had a significant contribution to c‐Fos expression. Brains from WT and SERT Met172 mice were collected 120 min after a single dose of cocaine (20 mg·kg−1, i.p.) or saline. (A) Areas in which stained nuclei were quantified (BLA, basolateral amygdala; CA3, hippocampal CA3; dCPu, dorsal caudate putamen; IL, infralimbic cortex; NAcS, nucleus accumbens shell; pir, piriform cortex; PrL, prelimbic cortex). (B) Representative pictures of c‐Fos positive stained nuclei in the prelimbic cortex. (C) Quantified c‐Fos expression as marker for neuronal activity in selected brain areas for saline and cocaine‐treated mice. Using two‐way ANOVA, we found significant main treatment effects in all brain areas displayed here, and additionally a significant main genotype effect in the CA3, piriform cortex and PrL. Data plotted are means ± SEM; n = 19–25; exact group sizes are indicated in the graphs. *P < 0.05, signficantly different as indicated; Sidak post hoc test.
Figure 6
Figure 6
(A) Selected IEG mRNA expression in the nucleus accumbens (NAc) from WT and SERT Met172, 30 and 120 min after a single dose of cocaine (20 mg·kg−1, i.p.) or saline. Gene expression was calculated relative to levels of the housekeeping gene Tbp and normalized to the WT saline control of the respective time point. All genes were analysed separately using two‐way ANOVA with Sidak post hoc test at the 30 and 120 min time points. We found significant main effects of drug in all groups except for Egr1 at 30 min and Fos at 120 min and a significant interaction between the effects of drug and genotype for Egr1 and Egr2 at 120 min. Males and females were analysed separately for Egr2 at 120 min since a significant main sex effect was evident. All other data are males and females combined as no sex differences were observed. n = 7–16; exact group sizes are indicated in the graphs. (B) IEG mRNA expression in the PrL from WT and SERT Met172 30 and 120 min after a single dose of cocaine (20 mg·kg−1, i.p.) or saline. We found significant main treatment effects for Fos, Fosb and Junb at 30 and 120 min and for Arc and Egr2 at 120 min. A significant main effect of genotype was evident for Junb at 120 min. All data are males and females combined as no sex differences were observed. Data plotted represent mean ± SEM; n = 7–9; exact group sizes are indicated in the graphs. *P < 0.05, signficantly different as indicated, two‐way ANOVA with Sidak post hoc test. cocaine versus respective saline or WT versus SERT Met172.
Figure 7
Figure 7
(A) IEGs mRNA expression in the NAc from WT and SERT Met172 chronically treated with cocaine (15 mg·kg−1, i.p.) or saline (20 mL·kg−1) and killed 120 min after the last injection. Main treatment effect was significant for all genes, two‐way ANOVA, * indicates P < 0.05, Sidak post hoc saline versus cocaine, n = 9–10; exact group sizes are indicated in the graphs. (B) IEGs expression in the prelimbic cortex from chronically treated mice. Main treatment effect was significant for all genes except for Egr2, two‐way ANOVA, Data represent mean ± SEM; n = 9–11; exact group sizes are indicated in the graphs. *P < 0.05, signficantly different as indicated; Sidak post hoc test.
Figure 8
Figure 8
(A) IEGs mRNA expression in the nucleus accumbens from WT and SERT Met172 chronically treated with cocaine (15 mg·kg−1, i.p.) or saline (20 mL·kg−1) followed by 14 days of abstinence and a challenge dose (cocaine 15 mg·kg−1 or saline). Mice were killed 120 min after the challenge dose. Main interaction for Egr1 and main treatment effect for all genes except for Egr2; two‐way ANOVA Data are mean ± SEM.; n = 8–9; exact group sizes are indicated in the graphs. * P < 0.05, signficantly different as indicated; Sidak post hoc test. (B) IEGs expression in the prelimbic cortex from mice challenged with a cocaine or saline dose after 14 days abstinence as described in A. Main treatment effect for Fosb, Junb, Egr1 and Arc, two‐way ANOVA. Data are mean ± SEM; n = 8–9; exact group sizes are indicated in the graphs. *P < 0.05, signficantly different as indicated; Sidak post hoc test.
Figure 9
Figure 9
Representative gene networks that were significantly regulated (P < 0.05 with the Fisher's exact test) in response to cocaine in WT compared to SERT Met172 mice. Gene expression was assessed using RNA‐Seq and figures were generated by Ingenuity Pathway Analysis Path Designer (Qiagen). (A) Network centred around the network hub genes Akt (Akt1) in the PrL after acute cocaine treatment (20 mg·kg−1). (B) Network centred around the network hub genes ERK1/2 (Mapk1 and Mapk3) in the NAc after chronic cocaine treatment (5 days, 15 mg·kg−1 daily). Seed molecules from the list of differentially regulated genes in WT compared to SERT Met172 mice are shown in the form of protein networks in red (upregulated in WT) or green (down‐regulated in WT), along with other molecules (grey and white) that connect smaller networks to make larger networks. Darker green or red indicates higher statistical significance for differential gene expression. Interaction or regulation between proteins or complexes is shown with arrows (activation) or blunt‐ended lines (inhibition). See Supporting Information Figures S7 and S11 for subcellular network versions of panels A and B.

Similar articles

Cited by

References

    1. Alexander SPH, Kelly E, Marrion N, Peters JA, Benson HE, Faccenda E et al. (2015a). The Concise Guide to PHARMACOLOGY 2015/16: Transporters. Br J Pharmacol 172: 6110–6202. - PMC - PubMed
    1. Alexander SPH, Davenport AP, Kelly E, Marrion N, Peters JA, Benson HE et al. (2015b). The Concise Guide to PHARMACOLOGY 2015/16: G protein‐coupled receptors. Br J Pharmacol 172: 5744–5869. - PMC - PubMed
    1. Alexander SPH, Fabbro D, Kelly E, Marrion N, Peters JA, Benson HE et al. (2015c). The Concise Guide to PHARMACOLOGY 2015/16: Enzymes. Br J Pharmacol 172: 6024–6109. - PMC - PubMed
    1. Alexander SPH, Kelly E, Marrion N, Peters JA, Benson HE, Faccenda E et al. (2015d). The Concise Guide to PHARMACOLOGY 2015/16: Overview. Br J Pharmacol 172: 5734–5143. - PMC - PubMed
    1. Anastasio NC, Stutz SJ, Fox RG, Sears RM, Emeson RB, DiLeone RJ et al. (2014). Functional status of the serotonin 5‐HT2C receptor (5‐HT2CR) drives interlocked phenotypes that precipitate relapse‐like behaviors in cocaine dependence. Neuropsychopharmacology 39: 370–382. - PMC - PubMed

MeSH terms

Substances