. 2017 Jun 6:8:15623.
doi: 10.1038/ncomms15623.

Blood-brain-barrier spheroids as an in vitro screening platform for brain-penetrating agents

Affiliations

Blood-brain-barrier spheroids as an in vitro screening platform for brain-penetrating agents

Choi-Fong Cho et al. Nat Commun. .

Abstract

Culture-based blood-brain barrier (BBB) models are crucial tools to enable rapid screening of brain-penetrating drugs. However, reproducibility of in vitro barrier properties and permeability remain as major challenges. Here, we report that self-assembling multicellular BBB spheroids display reproducible BBB features and functions. The spheroid core is comprised mainly of astrocytes, while brain endothelial cells and pericytes encase the surface, acting as a barrier that regulates transport of molecules. The spheroid surface exhibits high expression of tight junction proteins, VEGF-dependent permeability, efflux pump activity and receptor-mediated transcytosis of angiopep-2. In contrast, the transwell co-culture system displays comparatively low levels of BBB regulatory proteins, and is unable to discriminate between the transport of angiopep-2 and a control peptide. Finally, we have utilized the BBB spheroids to screen and identify BBB-penetrant cell-penetrating peptides (CPPs). This robust in vitro BBB model could serve as a valuable next-generation platform for expediting the development of CNS therapeutics.


Conflict of interest statement

The authors declare no competing financial interests.

Figures

Figure 1
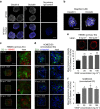
Figure 1. Cellular organization of the multicellular BBB spheroids.
Representative confocal images showing the organization of human astrocytes (white), HBVP (blue) and (a) primary HBMEC (red) or (b) immortalized human cerebral microvascular ECs (hCMEC/D3; green) when co-cultured to form a spheroid. Astrocytes were pre-labelled with VivoTrack 680 Fluorescent Imaging Agent, HBVP with CellTracker Violet, HBMEC with CellTracker Orange, and hCMEC/D3 with CellTracker Green for 1 h before co-culturing on 1% agarose for 48 h. Spheroids were imaged using confocal microscopy, and images displayed represent the organization of each cell type at 96 μm depth from the surface of the spheroid. Scale bar, 100 μm; nspheroid=5. (c) TEM images showing the organization of hCMEC/D3 ECs, HBVP and astrocytes within a spheroid. ECs are identified from their elongated cellular form and irregularly shaped nuclei (red stars), while HBVP (cyan stars) are distinguished based on their elongated rough endoplasmic reticulum (RER) and well-developed Golgi body (see magnified inset 1 and 2; scale bar, 500 nm). Astrocytes (magenta stars) are characterized by the presence of filamentous bundles (orange arrows) within the cell (see inset 3; scale bar, 500 nm). Scale bars are indicated within each image. (d) Representative TEM images showing the presence of tight junctions (green arrows) between ECs (red stars) that lined the surface of the spheroid. Scale bar, 2 μm.
Figure 2
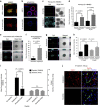
Figure 2. Surface permeability of BBB spheroid to high molecular weight dextran and intact tight junctions are modulated by VEGF.
(a) Fluorescence images showing the expression of tight junction markers, claudin 5 and occludin (white). Nuclei of spheroids were stained with Hoechst dye (blue). Scale bar, 100 μm (× 20 objective). (b) Magnified fluorescence images showing claudin 5 and occluding expression. Scale bar, 100 μm (× 60 objective). (c) Fluorescence images showing decreased expression of tight junction marker (ZO-1: green) with increasing VEGF-A concentration (at 5, 20 and 50 ng ml−1) in primary HBMEC (pre-labelled with CellTracker Red dye) and (d) immortalized hCMEC/D3 ECs. Cell nuclei were labelled with Hoechst dye (blue). Scale bar: 50 μm in lower-magnification images; 10 μm in magnified images. (e) Dextran permeability assay showing that VEGF-A (at 25, 50 and 100 ng ml−1) increased spheroid permeability to TRITC-Dextran (155 kDa; red; 10 mg ml−1) using spheroids established using primary HBMEC ECs. The image panels above the graph depict a representation of how permeability was assessed. The white dotted line marks the area within the core of the spheroid, where the mean fluorescence intensity was quantified. Scale bar, 50 μm; n=8. (f) Dextran permeability study (as in e) using spheroids established using immortalized hCMEC/D3 ECs. nspheroid=3–5. Both graphs show mean TRITC fluorescence intensity quantified at 88 μm depth from the surface of the spheroid with s.d. error bars (**P<0.01; *P<0.05). Statistical analyses were performed using the one-way ANOVA and Dunnett’s multiple comparison test.
Figure 3
Figure 3. Function of efflux pump, P-gp on multicellular BBB spheroids.
(a) Immunofluorescence images showing the expression of efflux pump, P-gp (green) on the surface of the spheroid after 48 h of co-culture. HBMECs (red) were pre-labelled with CellTracker Orange before spheroid formation. Scale bar, 50 μm. (b) Fluorescence images acquired using confocal microscopy showing that increasing concentration of a P-gp inhibitor, LY335979 increases influx of rhodamine 123 (Rh123; 0.5 μg ml−1), a substrate of P-gp into the spheroids. Scale bar, 100 μm. (c) Bar graph depicting the influx of Rh123 into the spheroid with increasing LY335979 concentration. The graph shows the mean rhodamine fluorescence intensity quantified from images in b, with s.d. error bars (**P<0.01; nspheroid=11). Statistical analyses were performed using the one-way ANOVA and Tukey’s multiple comparison test.
Figure 4
Figure 4. Analysis of angiopep-2 transport in BBB spheroid.
(a) Fluorescence images showing LRP-1 receptor expression (green) in spheroids established with primary HBMECs (pre-labelled in CellTracker Orange (shown in red)). Scale bar, 50 μm. (b) Fluorescence images showing the LRP-1 receptor expression (red) in immortalized hCMEC/D3 ECs. Nuclei of spheroids were stained with Hoechst dye (blue). Scale bar: 100 μm. (c) Confocal fluorescence images showing the transport of Cy5-labelled angiopep-2 (cyan; compared to a corresponding scrambled peptide) in spheroids established with primary HBMECs. Spheroids were incubated with either angiopep-2 or scrambled-Cy5 peptide (10 μM) at 37 °C for 3 h. Scale bar, 100 μm. (d) Bar graph quantifying the transport of angiopep-2 (or scrambled peptide) at a concentration of 5 and 10 μM in spheroids established with primary HBMECs. Statistical analyses were performed using the one-way ANOVA and Bonferroni’s multiple comparison test. (e) Fluorescence images showing the transport of Cy5-labelled angiopep-2 (cyan; conducted as in c) in spheroids established with immortalized hCMEC/d3 cells. Scale bar, 100 μm. (f) Bar graph quantifying the transport of angiopep-2 (10 μM; from e). Statistical analyses were performed using the Student’s t-test. (g) Fluorescence images acquired using confocal microscopy showing the transport of Cy5-labelled angiopep-2 (cyan; 10 μM) in spheroids established with primary HBMECs at either 4 °C (to inhibit endo/transcytosis) or 37 °C for 3 h. Scale bar, 200 μm. (h) Bar graph quantifying the transport of angiopep-2 at either 4 or 37 °C (from g). Statistical analyses were performed using the one-way ANOVA and Tukey’s multiple comparison test. All graphs above depict mean Cy5 intensity quantified at 88 μm depth from the surface of the spheroid with s.d. error bars (nspheroid=10, nexperiment=3). (i) Co-incubation of spheroids with TAMRA-labelled angiopep-2 or angio-scramble (at 10 μM) and with FITC-dextran (70 kDa; at 10 μg ml−1) for 3 h. The graph displays the mean fluorescence intensity of the peptides (TAMRA) on the left y axis, and dextran (FITC) on the right y axis at 88 μm depth from the surface of each spheroid with s.d. error bars (nspheroid=3–6, nexperiment=3). Incubation of spheroids with each peptide did not increase spheroid permeability to FITC-dextran. Statistical analyses were performed using the two-way ANOVA and Dunnett’s multiple comparison test. (j) Fluorescence images of brain cryosections showing the accumulation of angiopep-2 (red) in the brain tissue compared to the scrambled peptide. Angiopep-2 (or the scrambled peptide; 100 μg) were injected via the tail vein. Mice were killed after 24 h, and the brains were excised. The vasculature was stained with DyLight 488 lectin (green), while cell nuclei were labelled with Hoechst dye (blue). Scale bar, 50 μm.
Figure 5
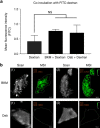
Figure 5. Transport of BKM120 (a BBB-penetrant drug) and dabrafenib (a non-penetrant drug) into BBB spheroids.
(a) Co-incubation of spheroids with BKM120 or dabrafenib (at 10 μM concentration) and with FITC-dextran (70 kDa; at 10 μg ml−1 concentration) for 24 h did not affect spheroid’s surface integrity. The graph displays the mean fluorescence intensity of dextran (FITC) at 88 μm depth from the surface of each spheroid with s.d. error bars (nspheroid=3–6). Statistical analyses were performed using the one-way ANOVA and Tukey’s multiple comparison test. (b) MALDI-MSI ion images of sections of BBB spheroids incubated with BKM120 or dabrafenib (nspheroid=150, ntissue=2). Top panels show the distribution of BKM120 (in green, m/z 411.1751±0.001). Lower panels indicate that dabrafenib (m/z 520.1083±0.001) was not detected in the BBB spheroids. Dashed lines on the scanned images delineate the positions of the BBB spheres tissue sections. Scale bars are indicated within each image.
Figure 6
Figure 6. Analysis of angiopep-2 transport using the well-established in vitro BBB Transwell system.
Permeability assay using the BBB co-culture Transwell model showing that the (a) scrambled control and (b) angiopep-2 displayed significantly lower permeation in the co-culture model compared to inserts containing no cells (which represent passive diffusion). (c) The Transwell co-culture model failed to differentiate between the permeability of angiopep-2 and the scrambled peptide. For all permeability assays, TAMRA-labelled angiopep-2 (or scramble) peptide (10 μM concentration) was added onto the apical side of the Transwells of the co-culture model after 84 h of incubation. The basal side of the Transwell was imaged using fluorescence microscopy, and the fluorescence intensity was quantified over 40 h. The plots show the accumulation of fluorescence intensity over time with s.d. error bars (ntranswell=2, nexperiment=2). Statistical analysis was performed using the one-way ANOVA and Tukey’s multiple comparison test. (d) Confocal images showing higher expression of ZO-1 (tight junction), P-gp (efflux pump) and β-catenin (adherens junction; shown in white) on the surface of BBB spheroids compared with hCMEC/D3 ECs in the triple co-culture Transwell model after 48 h. Cell nuclei were labelled with Hoechst dye (shown in blue). Scale bar, 100 μm.
Figure 7
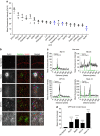
Figure 7. Screen of CPPs for BBB penetration using the multicellular BBB spheroids.
(a) Waterfall plot showing the mean fluorescence intensity at 88 μm depth from the surface of each spheroid after incubation with each CPP at 5 μM concentration for 3 h. The CPPs were synthesized with Cy5.5 conjugated to the N-terminus. The graph displays s.d. error bars (nspheroid=3–7, nexperiment=3). The HIV-1 Tat, penetratin and SynB1, (all well-established BBB-penetrating CPPs) are indicated in blue. (b) Fluorescence images of brain cryosections (20 μm slices) showing the localization of top 4 CPPs (shown in white) identified from a in the mouse frontal lobe. CPPs (100 μl of 500 μM peptide solution) were injected via the tail vein. 30 min later, mice were injected with 100 μl of 50 mg ml−1 of TRITC-dextran (155 kDa; shown in green). After 15 min, mice were euthanized, and their brains excised, flash frozen and cryosectioned. Tissue sections from the frontal lobe were labelled with Hoechst dye (nuclei: red), and imaged by confocal microscopy using a × 60 oil immersion objective. Small capillaries (magenta arrows), the lumen of a larger vessel (magenta star) and brain parenchyma (cyan stars) are indicated. Tile scans (2 × 2) and z-slices were merged to generate a 2D maximum intensity projection. Scale bar, 100 μm. (c) Line profile through the brain endothelium (depicted by orange line shown in images from (b)). The mean fluorescence intensity of dextran (green) indicates area of high perfusion (that is, in the brain endothelium). (d) Bar graph showing the accumulation of top 4 CPPs in the brain parenchyma. Regions outside the areas with high dextran signal (such as those indicated with cyan stars) were selected and the mean fluorescence intensity was quantified (n=10). The graph shows s.d. error bars, and statistical analyses were performed using the one-way ANOVA and Dunnett’s multiple comparison test (****P<0.0001).

References

    1. Abbott N. J., Rönnbäck L. & Hansson E. Astrocyte-endothelial interactions at the blood-brain barrier. Nat. Rev. Neurosci. 7, 41–53 (2006). - PubMed
    1. Wolburg H. & Lippoldt A. Tight junctions of the blood-brain barrier: development, composition and regulation. Vascul. Pharmacol. 38, 323–337 (2002). - PubMed
    1. Schinkel A. H. P-Glycoprotein, a gatekeeper in the blood-brain barrier. Adv. Drug Deliv. Rev. 36, 179–194 (1999). - PubMed
    1. Begley D. J. & Brightman M. W. Structural and functional aspects of the blood-brain barrier. Prog. Drug Res. 61, 39–78 (2003). - PubMed
    1. Zlokovic B. V. The blood-brain barrier in health and chronic neurodegenerative disorders. Neuron 57, 178–201 (2008). - PubMed

Publication types