. 2017 Jun 6:8:15180.
doi: 10.1038/ncomms15180.

A molecular portrait of microsatellite instability across multiple cancers

Affiliations

A molecular portrait of microsatellite instability across multiple cancers

Isidro Cortes-Ciriano et al. Nat Commun. .

Abstract

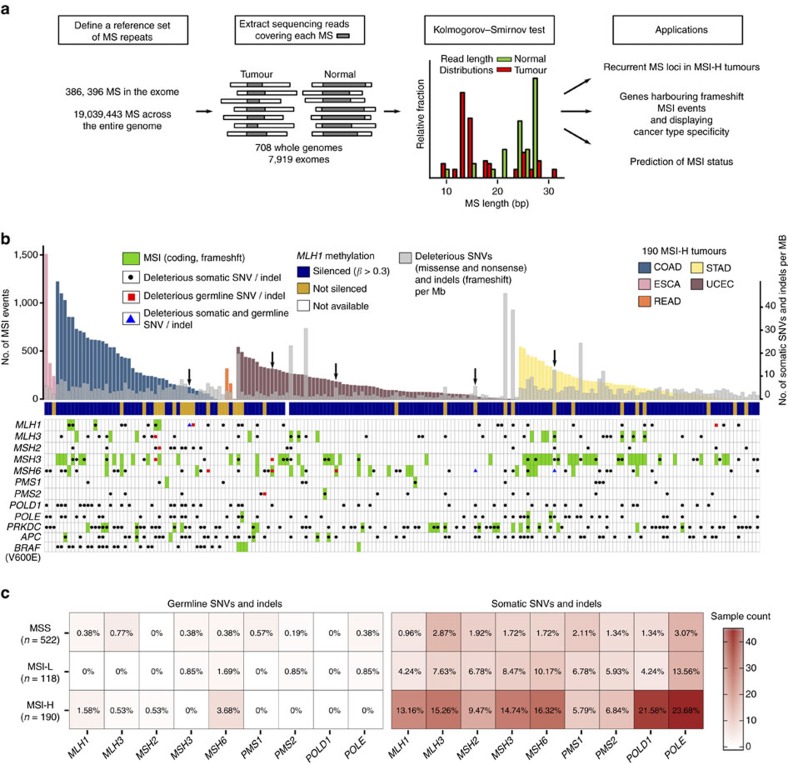
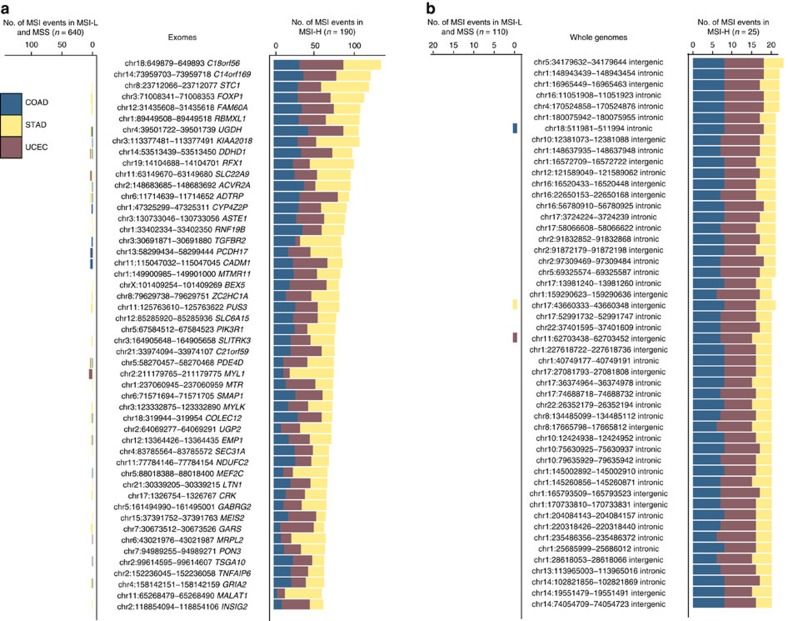
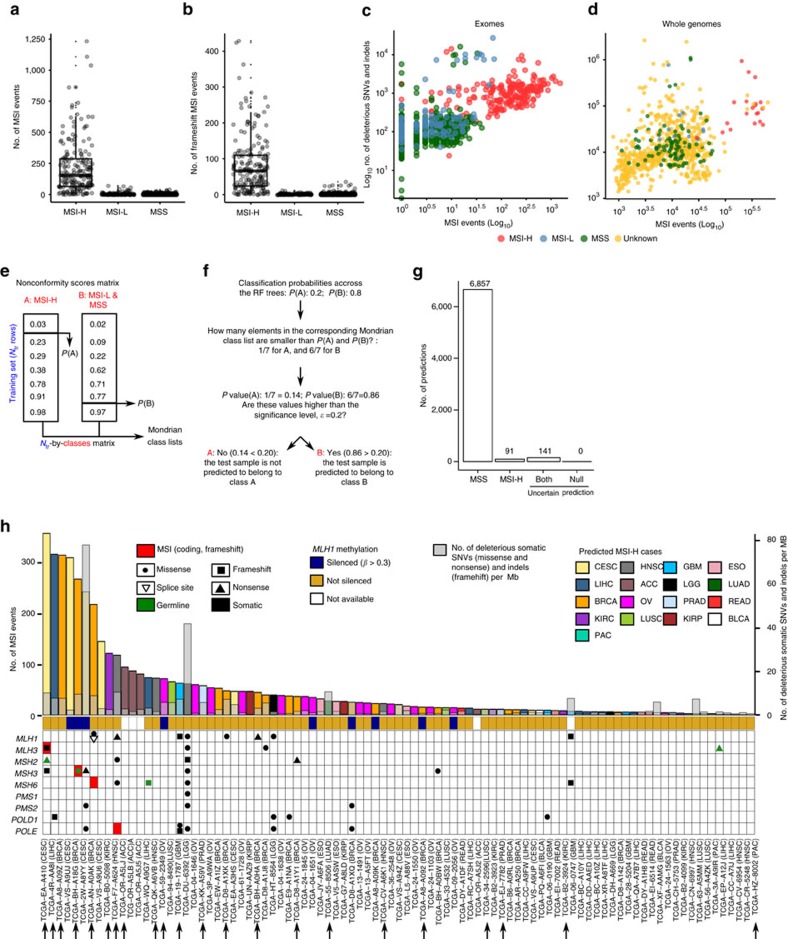
Microsatellite instability (MSI) refers to the hypermutability of short repetitive sequences in the genome caused by impaired DNA mismatch repair. Although MSI has been studied for decades, large amounts of sequencing data now available allows us to examine the molecular fingerprints of MSI in greater detail. Here, we analyse ∼8,000 exomes and ∼1,000 whole genomes of cancer patients across 23 cancer types. Our analysis reveals that the frequency of MSI events is highly variable within and across tumour types. We also identify genes in DNA repair and oncogenic pathways recurrently subject to MSI and uncover non-coding loci that frequently display MSI. Finally, we propose a highly accurate exome-based predictive model for the MSI phenotype. These results advance our understanding of the genomic drivers and consequences of MSI, and our comprehensive catalogue of tumour-type-specific MSI loci will enable panel-based MSI testing to identify patients who are likely to benefit from immunotherapy.


Conflict of interest statement

The authors declare no competing financial interests.

Figures

Figure 1
Figure 1. Schematic overview of the MSI calling pipeline.
(a) A reference set of exonic and genome-wide MS repeats was assembled from the human reference genome hg19. The sequencing reads spanning each MS repeat and at least 2 base pairs at each flanking side were extracted from the tumour and normal BAM files. This process was repeated for all MS repeats in the reference sets across all pairs of matched normal-tumour samples. The Kolmogorov–Smirnov test was used to evaluate whether the read length distributions from the normal and tumour samples differed significantly (FDR<0.05). The exonic and genome-wide MSI calls served to identify MS loci recurrently altered by MSI in MSI-H tumours, discover frequent frameshift mutations and to predict MSI status. (b) Landscape of somatic MSI in MSI-H tumours. MSI events (frameshift and in-frame), deleterious SNV (missense, nonsense and splice site) and indel (frameshift) rates in 190 MSI-H exomes. Samples harbouring hypermethylation of the MLH1 promoter are denoted by blue squares. Deleterious germline and somatic mutations (that is, missense, nonsense, splice site and frameshift) are depicted in black and red, respectively, whereas frameshfit MSI events are shown in green. Black arrows mark patients with germline and somatic mutations in MMR genes. (c) Germline and somatic mutations in MMR genes, POLE and POLD1 in MSS, MSI-L and MSI-H tumours. The heatmap and the cell labels report the number and percentage of samples in each category harbouring mutations, respectively.
Figure 2
Figure 2. MS loci recurrently altered by MSI.
(a) Coding MSI loci recurrently targeted by frameshift MSI in CRC (COAD and READ), STAD and UCEC MSI-H tumours. The heatmap shows the fraction of CRC, STAD and UCEC MSI-H tumours containing frameshift MSI events in MS loci located within the coding sequence of the genes indicated on the x axis. The total count of frameshift MSI events at these loci is depicted in the above barplot. The full list of MS loci recurrently altered by frameshift MSI is given in Supplementary Data 4. Similarly shown for genes with frequent 3′ UTR (b) and 5′ UTR (c) MSI events in three MSI-prone tumour types.
Figure 3
Figure 3. Pan-cancer landscape of genome-wide MSI.
(a) The first panel shows the number of MSI events across 708 whole genomes, stratified by the length of the repeat unit. The second and third panels report the MSI status and the total count of SNVs, respectively. The fourth panel shows the distribution of MSI events across the genome. (b) Landscape of MSI in mitochondrial DNA across 308 COAD, STAD and UCEC low-pass whole genomes. MSI events, including frameshift and in-frame mutations, are shown in black.
Figure 4
Figure 4. MS repeats recurrently altered by MSI in MSI-H tumours.
(a) The barplots report the number of COAD, STAD and UCEC tumours harbouring MSI events at the loci indicated in the central panel. This analysis examined 190 MSI-H, 118 MSI-L and 522 MSS exomes. (b) The recurrence analysis was extended to 25 MSI-H, 19 MSI-L and 105 MSS whole genomes. Genomic coordinates in a,b indicate the location of the MSI repeats in the hg19 assembly of the human genome.
Figure 5
Figure 5. Distribution of the number of MSI and prediction of MSI status.
Distribution of the number of MSI (a) and frameshift MSI events (b) in MSI-H and MSS (also including MSI-L) tumours. Correlation between the number of SNV and MSI events in exomes (c) and whole genomes (d). Prediction of MSI status from exome-sequencing data using conformal prediction and random forest models (e). Initially, we used 10-fold cross-validation to calculate predictions for all training examples. The fraction of trees in the forest voting for each class was recorded, and subsequently sorted in increasing order to define one Mondrian class list per category. (f) The model which was trained on all training data was applied to 7,089 exomes. For each of these samples, the algorithm recorded the fraction of trees voting for each class. The P value for each class was calculated as the number of elements in the corresponding Mondrian class list higher than the vote for that class (for example, 6 out of 7 in the toy example depicted in Fig. 5f) divided by the number of elements in that list. If the P value for a given class is above the significance, ɛ, the sample is predicted to belong to that category. The confidence level (1−ɛ) indicates the minimum fraction of predictions that are correct. (g) Number of samples predicted as MSI-H, MSS and uncertain (both: cases in which the classifier does not have enough power to confidently assign a single category; none: cases in which when the samples that are outside the applicability domain of the model). Here, the confidence level was set to 0.75. (h) Landscape of MSI for the 91 exomes predicted as MSI-H at a confidence level of 0.75. Samples predicted to be MSI-H at a confidence level of 0.80 are marked with black arrows.

References

    1. Aaltonen L. A. et al.. Clues to the pathogenesis of familial colorectal cancer. Science 260, 812–816 (1993). - PubMed
    1. Hendriks Y. M. C. et al.. Diagnostic approach and management of Lynch syndrome (hereditary nonpolyposis colorectal carcinoma): a guide for clinicians. CA. Cancer J. Clin. 56, 213–225 (2006). - PubMed
    1. Herman J. G. et al.. Incidence and functional consequences of hMLH1 promoter hypermethylation in colorectal carcinoma. Proc. Natl Acad. Sci. USA 95, 6870–6875 (1998). - PMC - PubMed
    1. Ligtenberg M. J. L. et al.. Heritable somatic methylation and inactivation of MSH2 in families with Lynch syndrome due to deletion of the 3′ exons of TACSTD1. Nat. Genet. 41, 112–117 (2009). - PubMed
    1. Volinia S. et al.. A microRNA expression signature of human solid tumors defines cancer gene targets. Proc. Natl Acad. Sci. USA 103, 2257–2261 (2006). - PMC - PubMed

Publication types

LinkOut - more resources