. 2017 Jun 6:8:15393.
doi: 10.1038/ncomms15393.

Global metabolic interaction network of the human gut microbiota for context-specific community-scale analysis

Affiliations

Global metabolic interaction network of the human gut microbiota for context-specific community-scale analysis

Jaeyun Sung et al. Nat Commun. .

Abstract

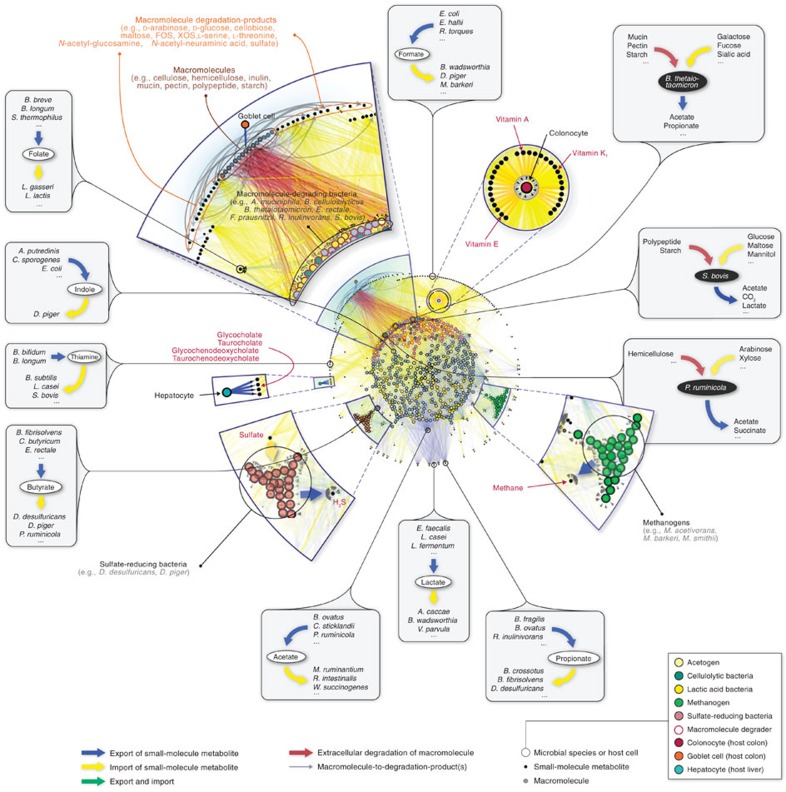
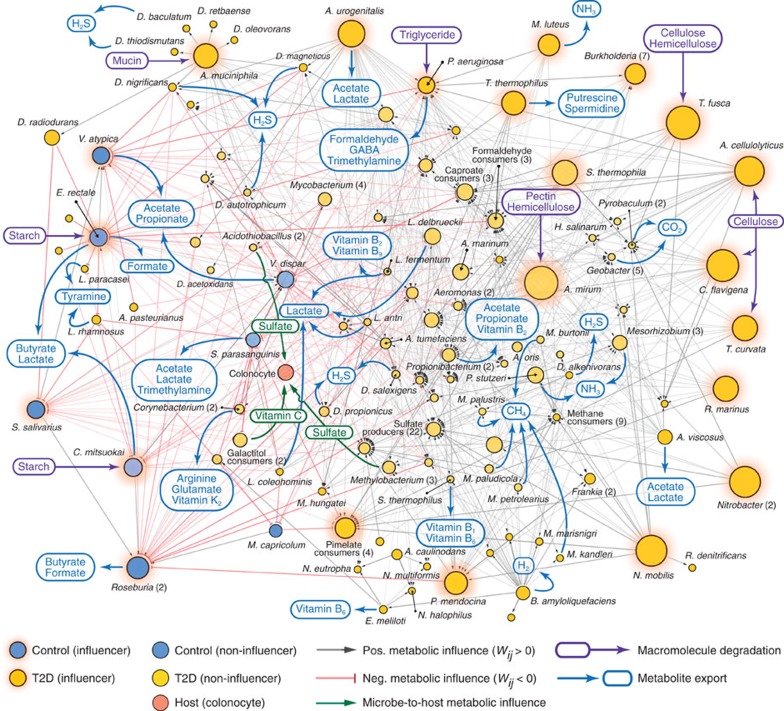
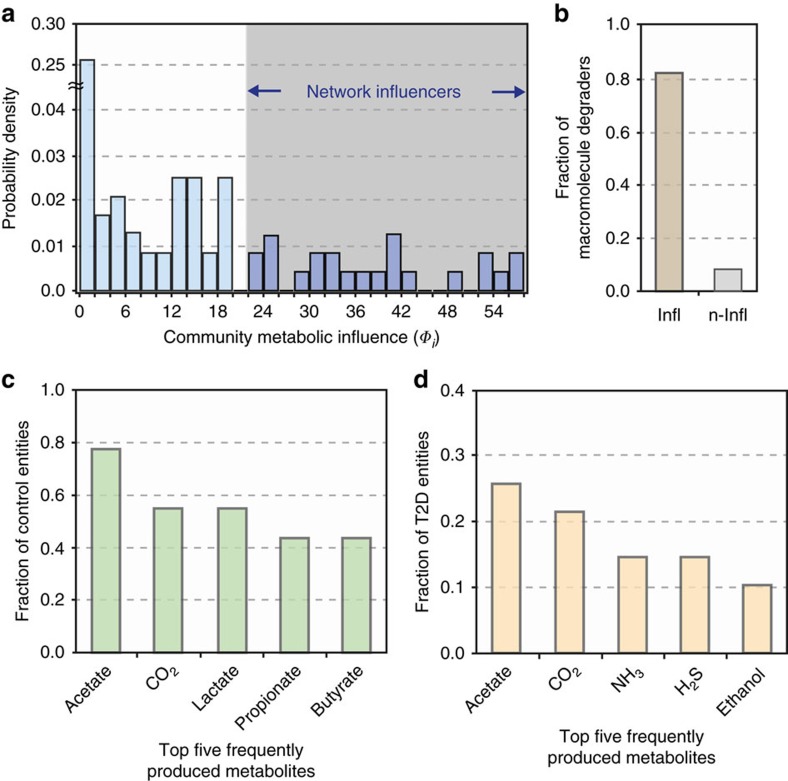
A system-level framework of complex microbe-microbe and host-microbe chemical cross-talk would help elucidate the role of our gut microbiota in health and disease. Here we report a literature-curated interspecies network of the human gut microbiota, called NJS16. This is an extensive data resource composed of ∼570 microbial species and 3 human cell types metabolically interacting through >4,400 small-molecule transport and macromolecule degradation events. Based on the contents of our network, we develop a mathematical approach to elucidate representative microbial and metabolic features of the gut microbial community in a given population, such as a disease cohort. Applying this strategy to microbiome data from type 2 diabetes patients reveals a context-specific infrastructure of the gut microbial ecosystem, core microbial entities with large metabolic influence, and frequently produced metabolic compounds that might indicate relevant community metabolic processes. Our network presents a foundation towards integrative investigations of community-scale microbial activities within the human gut.


Conflict of interest statement

The authors declare no competing financial interests.

Figures

Figure 1
Figure 1. Global landscape of the human gut microbiota organized through metabolite transport.
Overview of NJS16. The import of nutrients (yellow arrows) and export of metabolic byproducts (blue arrows) comprise the organizational basis of the gut microbial community. Microbes of common metabolic function are clustered together as functionally similar groups (large coloured nodes). Within the microbial community, competition exists for the consumption of the same metabolites (small black nodes); cooperative relationships also occur, in the form of (i) interspecies cross-feeding, as exemplified in the figure insets, and (ii) macromolecule degradation, wherein a microbe degrades macromolecules in its extracellular space (red arrows), thereby releasing degradation products (grey arrows stemming from macromolecule nodes) as public goods. As a functional extension of the bacterial and archaeal community residing in the colon, human host cells either can directly affect, or can be affected by, microbial metabolism. Host cell types in the network are: (i) colonocytes, which absorb nutrients produced by certain microbes, (ii) goblet cells, which secrete complex mucus glycoproteins for mucin-degrading microbes, and (iii) hepatocytes, which, although not part of colonic tissue, secrete conjugated bile acids that are consumed by microbes.
Figure 2
Figure 2. Comparison of transportable metabolites from NJS16 and those inferred from existing databases.
(a) For each microbial species (each data point), the horizontal and vertical axes represent the number of its transportable metabolites from NJS16 and that inferred from the Kyoto Encyclopedia of Genes and Genomes (KEGG), respectively. The latter was obtained by counting the species' KEGG compounds that are common to any of the entire transportable metabolites in NJS16. This KEGG-based estimation would result in many false positives; however, the KEGG information might be relatively free of the literature bias that NJS16 harbours and thus can possibly serve as a more unbiased counterpart to NJS16. Most data points are located over the grey diagonal, indicating that most species have more transportable metabolites according to KEGG than to NJS16. The presence of species with few metabolites in NJS16 can be, at least in part, attributed to literature bias with false negatives in the species' metabolites. (b) The vertical axis represents the distribution of the probability P(k) that a given microbial species has k metabolites (horizontal axis) in its defined growth media whose information is from the Known Media Database (KOMODO). We considered common species between NJS16 and KOMODO (only when found to have defined media information) and counted their media components that are common to any of the transportable metabolites in NJS16. For a given species, the number of such media components may possibly approximate the number of its importable metabolites. Compared with Fig. 3a, which is derived from NJS16, b exhibits peaks at large metabolite numbers on the horizontal axis, possibly indicating false negatives in NJS16's importable metabolites. Yet, given KOMODO's low coverage of microbial species in NJS16 (9.2%) and given that microbes may not necessarily import all compounds in their defined growth media, our results warrant a cautious interpretation.
Figure 3
Figure 3. Network structural properties of NJS16.
In a,b, the vertical axis represents the distribution of the probability P(k) that a given microbial species imports (a) or exports (b) k metabolites on the horizontal axis. In c,d, the vertical axis represents the distribution of the probability P(k) that a given metabolite is imported (c) or exported (d) by k species on the horizontal axis. (a,b) Exponential distributions P(k)∝erk with r≈0.2 for a and r≈0.4 for b. (c,d) More right-skewed distributions than a,b. (d) A power-law distribution P(k)∝kγ with γ≈1.6.
Figure 4
Figure 4. MIN among the most representative microbial entities of T2D in a given demographic cohort.
We identified community-wide metabolic influence relationships between microbial entities differentially abundant in T2D (gold nodes) and in non-diabetic control (blue nodes) in a male, mid-age and normal-weight cohort. Specifically, the network is characterized by positive (grey arrow) and negative (red arrow) metabolic influences between pairs of microbial entities. Furthermore, entities that are highly influential—by exerting a metabolic influence towards a substantial number of microbial entities—are depicted as network influencers (nodes with orange background. See also Fig. 5a). The number of species that compose each microbial group is shown in parentheses next to the respective group's name. Microbe-to-host (colonocyte) cross-feeding relationships that were predicted to be of representative importance are shown in green arrows, with some examples of the corresponding metabolites. Macromolecule degradation by individual microbial species, or by multiple species in a microbial group, is exemplified through purple arrows. Full lists of microbial entities and compounds in the networks are too dense for direct visualization and therefore only a part of them are presented. Full details of this network are available in Supplementary Data 3.
Figure 5
Figure 5. Characteristics of the MIN.
The community metabolic influence (Φi) of each microbial entity i was found for all nodes of the influence network (Fig. 4) and its probability distribution is shown in a. This plot was used to identify microbial entities with relatively large metabolic influences; specifically, a transition point was chosen after a drop-off in the probability density of community influences (Methods). Microbial species or groups with relatively large metabolic influence (shaded region) were designated as network influencers. (b) Network influencers (denoted by ‘Infl') have a higher proportion of macromolecule degraders than non-influencers (denoted by ‘n-Infl'), showing that macromolecule degradation is one of their key hallmarks. (c) Top five most frequently produced metabolites by microbial entities differentially abundant in non-diabetic control: acetate (77.8%), CO2 (55.6%), lactate (55.6%), propionate (44.4%) and butyrate (44.4%). (d) Top five most frequently produced metabolites by microbial entities differentially abundant in T2D: acetate (25.6%), CO2 (21.4%), NH3 (14.5%), H2S (14.5%) and ethanol (10.3%). Differences in these two sets of metabolites could suggest insights into metabolic processes associated with a T2D gut microbial ecosystem.

Similar articles

  • Large-scale metabolic interaction network of the mouse and human gut microbiota.
    Lim R, Cabatbat JJT, Martin TLP, Kim H, Kim S, Sung J, Ghim CM, Kim PJ. Lim R, et al. Sci Data. 2020 Jun 26;7(1):204. doi: 10.1038/s41597-020-0516-5. Sci Data. 2020. PMID: 32591517 Free PMC article.
  • Overview of the rules of the microbial engagement in the gut microbiome: a step towards microbiome therapeutics.
    Yadav M, Chauhan NS. Yadav M, et al. J Appl Microbiol. 2021 May;130(5):1425-1441. doi: 10.1111/jam.14883. Epub 2020 Oct 20. J Appl Microbiol. 2021. PMID: 33022786 Review.
  • Systematic prediction of health-relevant human-microbial co-metabolism through a computational framework.
    Heinken A, Thiele I. Heinken A, et al. Gut Microbes. 2015;6(2):120-30. doi: 10.1080/19490976.2015.1023494. Gut Microbes. 2015. PMID: 25901891 Free PMC article.
  • Metabolic networks of the human gut microbiota.
    Selber-Hnatiw S, Sultana T, Tse W, Abdollahi N, Abdullah S, Al Rahbani J, Alazar D, Alrumhein NJ, Aprikian S, Arshad R, Azuelos JD, Bernadotte D, Beswick N, Chazbey H, Church K, Ciubotaru E, D'Amato L, Del Corpo T, Deng J, Di Giulio BL, Diveeva D, Elahie E, Frank JGM, Furze E, Garner R, Gibbs V, Goldberg-Hall R, Goldman CJ, Goltsios FF, Gorjipour K, Grant T, Greco B, Guliyev N, Habrich A, Hyland H, Ibrahim N, Iozzo T, Jawaheer-Fenaoui A, Jaworski JJ, Jhajj MK, Jones J, Joyette R, Kaudeer S, Kelley S, Kiani S, Koayes M, Kpata AJAL, Maingot S, Martin S, Mathers K, McCullogh S, McNamara K, Mendonca J, Mohammad K, Momtaz SA, Navaratnarajah T, Nguyen-Duong K, Omran M, Ortiz A, Patel A, Paul-Cole K, Plaisir PA, Porras Marroquin JA, Prevost A, Quach A, Rafal AJ, Ramsarun R, Rhnima S, Rili L, Safir N, Samson E, Sandiford RR, Secondi S, Shahid S, Shahroozi M, Sidibé F, Smith M, Sreng Flores AM, Suarez Ybarra A, Sénéchal R, Taifour T, Tang L, Trapid A, Tremblay Potvin M, Wainberg J, Wang DN, Weissenberg M, White A, Wilkinson G, Williams B, Wilson JR, Zoppi J, Zouboulakis K, Gamberi C. Selber-Hnatiw S, et al. Microbiology (Reading). 2020 Feb;166(2):96-119. doi: 10.1099/mic.0.000853. Microbiology (Reading). 2020. PMID: 31799915 Review.
  • Understanding the host-microbe interactions using metabolic modeling.
    Jansma J, El Aidy S. Jansma J, et al. Microbiome. 2021 Jan 20;9(1):16. doi: 10.1186/s40168-020-00955-1. Microbiome. 2021. PMID: 33472685 Free PMC article. Review.

Cited by

References

    1. Nowak M. A. Evolutionary Dynamics: exploring the Equations of Life Harvard Univ. Press (2006).
    1. Sanchez A. & Gore J. Feedback between population and evolutionary dynamics determines the fate of social microbial populations. PLoS Biol. 11, e1001547 (2013). - PMC - PubMed
    1. Mackie R. I., White B. A. & Isaacson R. E. Gastrointestinal Microbiology Chapman & Hall (1997).
    1. Blaut M. Ecology and physiology of the intestinal tract. Curr. Top. Microbiol. Immunol. 358, 247–272 (2013). - PubMed
    1. Qin J. et al.. A human gut microbial gene catalogue established by metagenomic sequencing. Nature 464, 59–65 (2010). - PMC - PubMed

Publication types