. 2017 Jun 6:8:15748.
doi: 10.1038/ncomms15748.

Understanding the origin of Paris Agreement emission uncertainties

Affiliations

Understanding the origin of Paris Agreement emission uncertainties

Joeri Rogelj et al. Nat Commun. .

Abstract

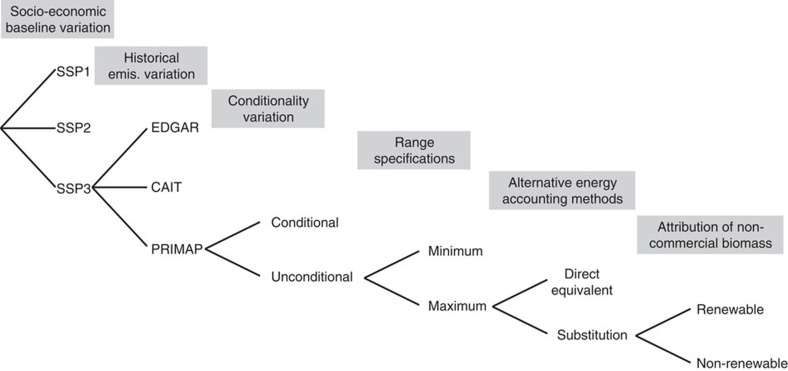
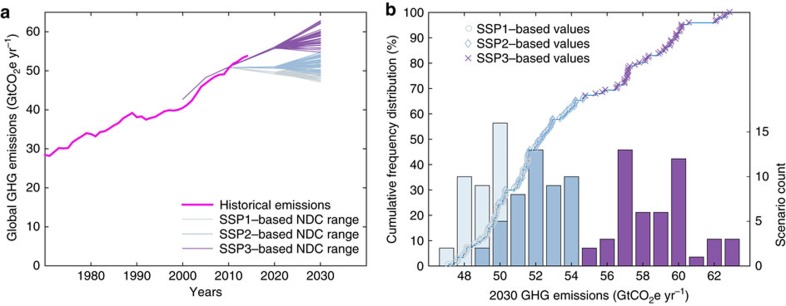
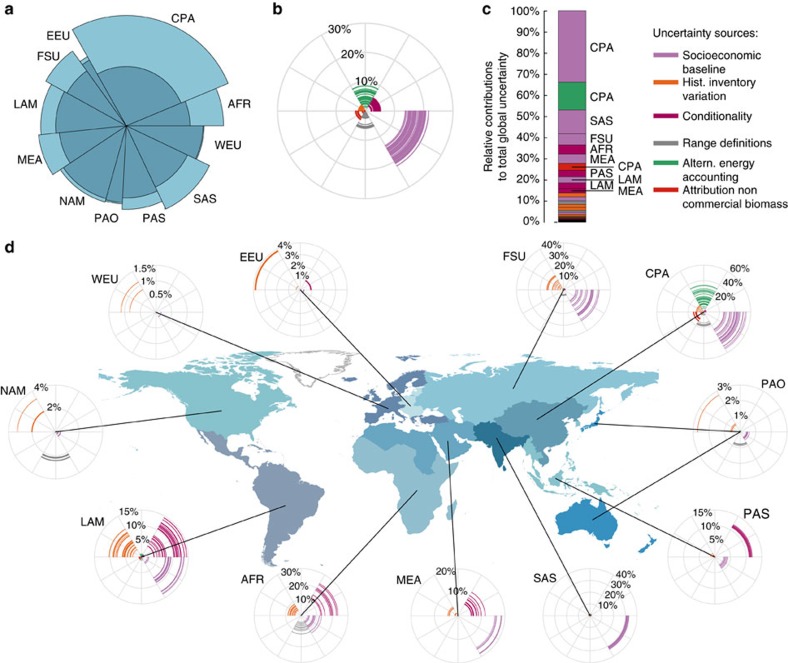
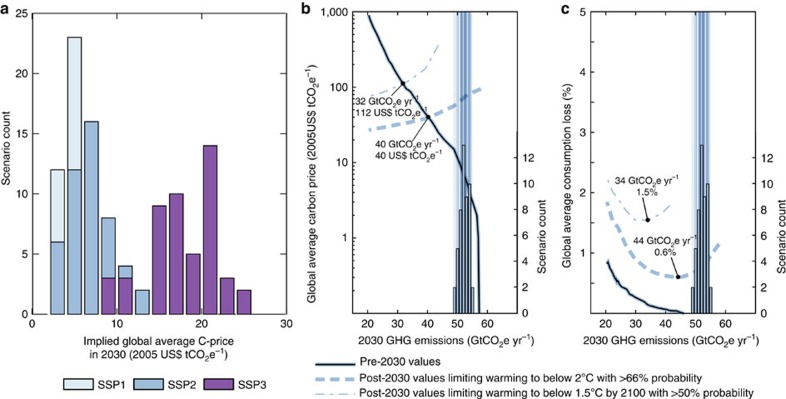
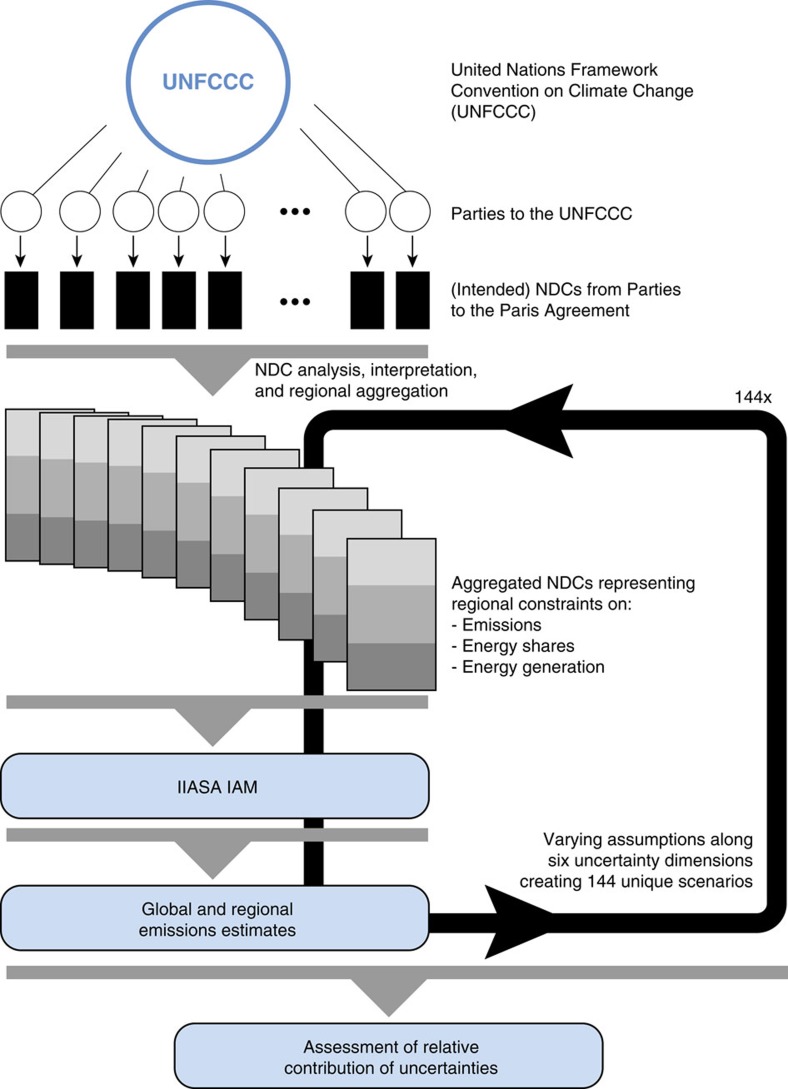
The UN Paris Agreement puts in place a legally binding mechanism to increase mitigation action over time. Countries put forward pledges called nationally determined contributions (NDC) whose impact is assessed in global stocktaking exercises. Subsequently, actions can then be strengthened in light of the Paris climate objective: limiting global mean temperature increase to well below 2 °C and pursuing efforts to limit it further to 1.5 °C. However, pledged actions are currently described ambiguously and this complicates the global stocktaking exercise. Here, we systematically explore possible interpretations of NDC assumptions, and show that this results in estimated emissions for 2030 ranging from 47 to 63 GtCO2e yr-1. We show that this uncertainty has critical implications for the feasibility and cost to limit warming well below 2 °C and further to 1.5 °C. Countries are currently working towards clarifying the modalities of future NDCs. We identify salient avenues to reduce the overall uncertainty by about 10 percentage points through simple, technical clarifications regarding energy accounting rules. Remaining uncertainties depend to a large extent on politically valid choices about how NDCs are expressed, and therefore raise the importance of a thorough and robust process that keeps track of where emissions are heading over time.


Conflict of interest statement

The authors declare no competing financial interests.

Figures

Figure 1
Figure 1. Overview of scenario structure to explore six uncertainty dimensions.
A total of 3*3*2*2*2*2=144 scenarios has been developed.
Figure 2
Figure 2. Range of 2030 emissions resulting from various interpretations of the current NDCs.
(a) Global historical GHG emissions from ref. and projected emissions under the current NDCs. Each line from 2010 to 2030 represents one of 144 modelled scenarios; (b) Cumulative distribution (line with individual scenario symbols on top, left axis) and histograms (bars, right axis) of GHG emission estimates for 2030 under the NDCs. Projections are grouped based on the SSP on which their baseline assumptions are based.
Figure 3
Figure 3. Regional contributions of uncertainty sources to overall NDC emission projection uncertainty.
(a) Regional emissions contributions to global emissions and uncertainty under the full implementation of current NDCs. Shadings show the minimum–maximum range of emissions estimates per region; (b) Estimates of the magnitude of uncertainty induced in 2030 per source relative to the median estimate; (c) Average contribution to full uncertainty range in 2030 per uncertainty source with the 10 most important contributions identified by region; (d) As b but per geographical region. AFR, Sub-Saharan Africa; CPA, Centrally Planned Asia and China; EEU, Central and Eastern Europe; FSU, Former Soviet Union; LAM, Latin America and the Caribbean; MEA, Middle East and North Africa; NAM, North America; PAS, Pacific OECD; SAS, South Asia; PAS, Other Pacific Asia; WEU, Western Europe. Country borders use the simplified TM World borders, provided by Bjorn Sandvik (thematicmapping.org).
Figure 4
Figure 4. Tradeoffs between 2030 NDCs and long-term temperature goals of the Paris Agreement.
(a) Global average carbon prices implied by the NDCs grouped by underlying socioeconomic development (SSP1, SSP2 and SSP3); (b,c) Tradeoffs between pre-2030 costs (solid line; global average carbon prices in b, global average consumption losses in c; see Methods for technical descriptions) and post-2030 costs in line with limiting warming to below 2 °C (dashed lines) and limiting warming to below 1.5 °C by 2100 (dash-dotted line) for a world with a middle-of-the-road socioeconomic development (SSP2, ref. for background). The histogram and vertical lines show the distribution of SSP2 NDC estimates from this study (scenario count for the histograms is shown on the right axis).
Figure 5
Figure 5. Schematic representation of the analysis of NDC uncertainties.
Emissions estimates for a total of 144 scenarios are computed and ultimately compared in a pair-wise fashion. (Intended) NDCs of Parties to the Paris Agreement are available at: http://www4.unfccc.int/submissions/INDC/. Documentation of the IIASA IAM is available at: http://data.ene.iiasa.ac.at/message-globiom/.

References

    1. UNFCCC. FCCC/CP/2015/L.9/Rev.1: Adoption of the Paris Agreement UNFCCC (2015).
    1. Mace M. J. Mitigation commitments under the Paris Agreement and the way forward. Climate Law 6, 21–39 (2016).
    1. Rogelj J. et al.. Paris Agreement climate proposals need a boost to keep warming well below 2 °C. Nature 534, 631–639. - PubMed
    1. UNFCCC. FCCC/CP/2016/2: Aggregate Effect of the Intended Nationally Determined Contributions: An Update-Synthesis Report by the Secretariat UNFCCC (2016).
    1. UNFCCC. FCCC/CP/2015/7: Synthesis Report on the Aggregate Effect of the Intended Nationally Determined Contributions UNFCCC (2015).

Publication types