

Neuroimaging studies of GABA in schizophrenia: a systematic review with meta-analysis
- PMID: 28585933
- PMCID: PMC5537645
- DOI: 10.1038/tp.2017.124
Neuroimaging studies of GABA in schizophrenia: a systematic review with meta-analysis
Abstract
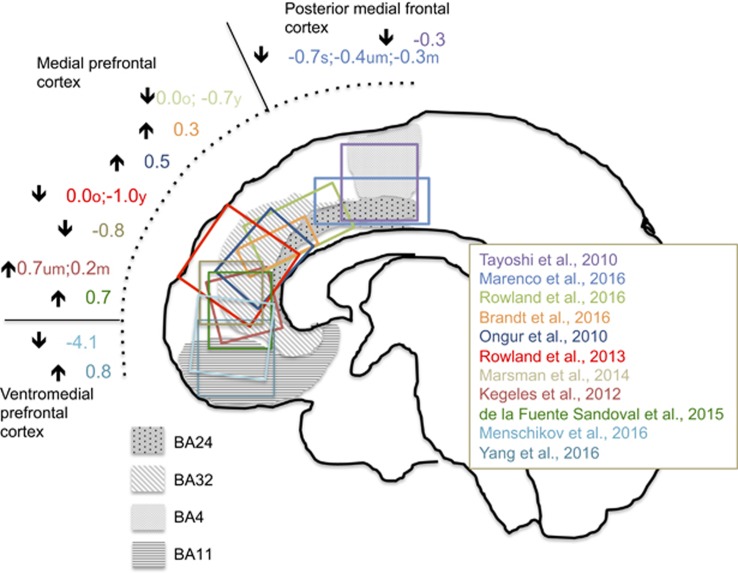
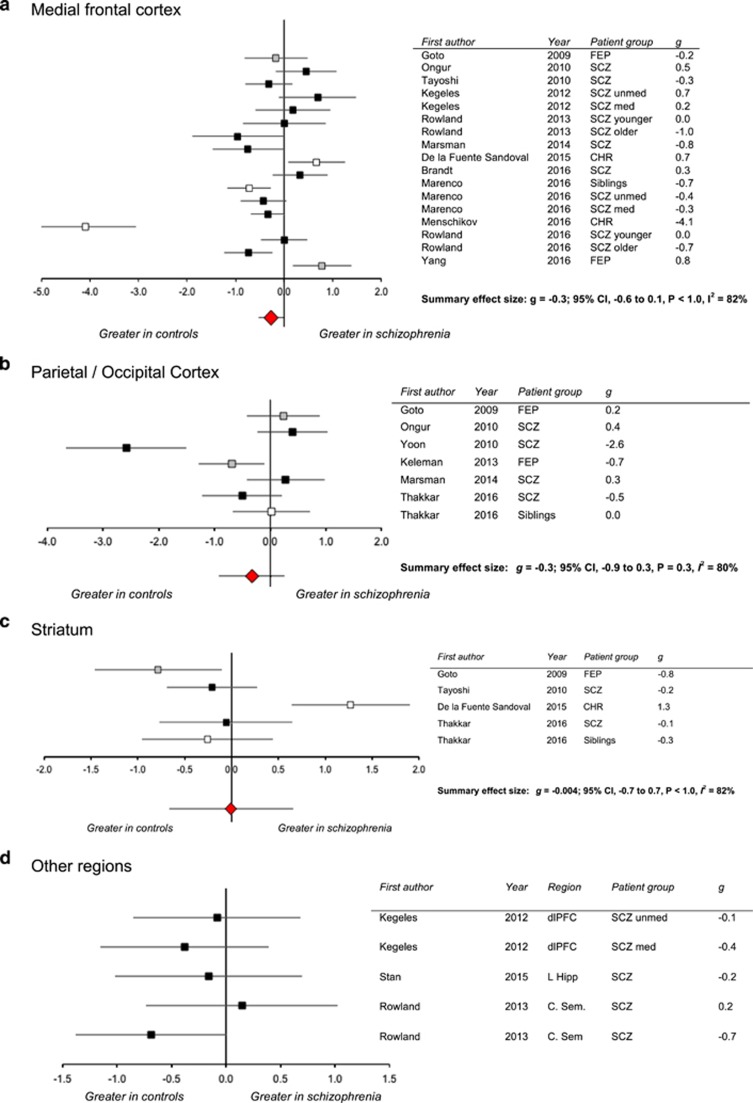
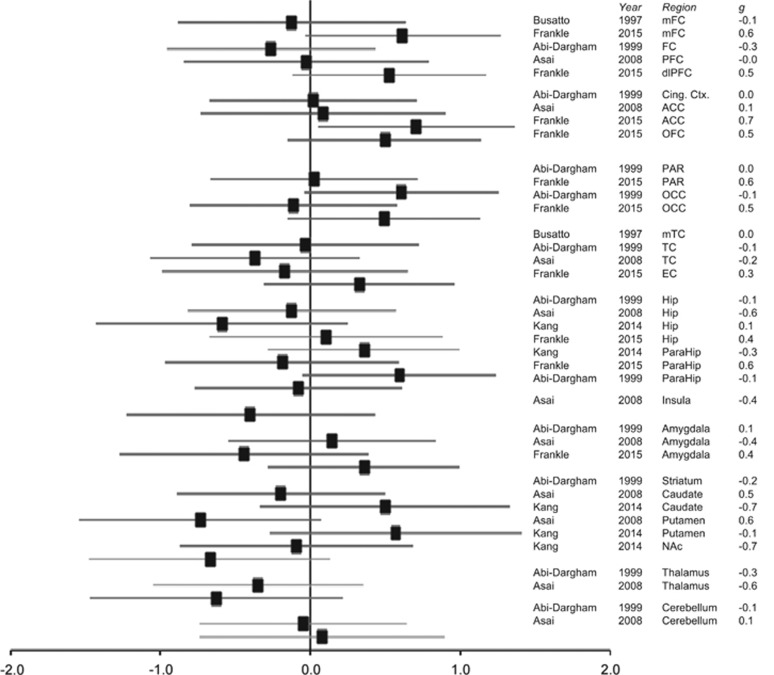
Data from animal models and from postmortem studies suggest that schizophrenia is associated with brain GABAergic dysfunction. The extent to which this is reflected in data from in vivo studies of GABA function in schizophrenia is unclear. The Medline database was searched to identify articles published until 21 October 2016. The search terms included GABA, proton magnetic resonance spectroscopy (1H-MRS), positron emission tomography (PET), single photon emission computed tomography (SPECT), schizophrenia and psychosis. Sixteen GABA 1H-MRS studies (538 controls, 526 patients) and seven PET/SPECT studies of GABAA/benzodiazepine receptor (GABAA/BZR) availability (118 controls, 113 patients) were identified. Meta-analyses of 1H-MRS GABA in the medial prefrontal cortex (mPFC), parietal/occipital cortex (POC) and striatum did not show significant group differences (mFC: g=-0.3, 409 patients, 495 controls, 95% confidence interval (CI): -0.6 to 0.1; POC: g=-0.3, 139 patients, 111 controls, 95% CI: -0.9 to 0.3; striatum: g=-0.004, 123 patients, 95 controls, 95% CI: -0.7 to 0.7). Heterogeneity across studies was high (I2>50%), and this was not explained by subsequent moderator or meta-regression analyses. There were insufficient PET/SPECT receptor availability studies for meta-analyses, but a systematic review did not suggest replicable group differences in regional GABAA/BZR availability. The current literature does not reveal consistent alterations in in vivo GABA neuroimaging measures in schizophrenia, as might be hypothesized from animal models and postmortem data. The analysis highlights the need for further GABA neuroimaging studies with improved methodology and addressing potential sources of heterogeneity.
Conflict of interest statement
The authors declare no conflict of interest.
Figures
References
-
- Volk DW, Austin MC, Pierri JN, Sampson AR, Lewis DA. Decreased glutamic acid decarboxylase67 messenger RNA expression in a subset of prefrontal cortical gamma-aminobutyric acid neurons in subjects with schizophrenia. Arch Gen Psychiatry 2000; 57: 237–245. - PubMed
-
- Akbarian S, Kim JJ, Potkin SG, Hagman JO, Tafazzoli A, Bunney WEJr et al. Gene expression for glutamic acid decarboxylase is reduced without loss of neurons in prefrontal cortex of schizophrenics. Arch Gen Psychiatry 1995; 52: 258–266. - PubMed
-
- Battaglioli G, Liu H, Martin DL. Kinetic differences between the isoforms of glutamate decarboxylase: implications for the regulation of GABA synthesis. J Neurochem 2003; 86: 879–887. - PubMed
Publication types
MeSH terms
Substances
Grants and funding
LinkOut - more resources
Full Text Sources
Other Literature Sources
Medical
