

Shifts in rhizosphere fungal community during secondary succession following abandonment from agriculture
- PMID: 28585935
- PMCID: PMC5607372
- DOI: 10.1038/ismej.2017.90
Shifts in rhizosphere fungal community during secondary succession following abandonment from agriculture
Abstract
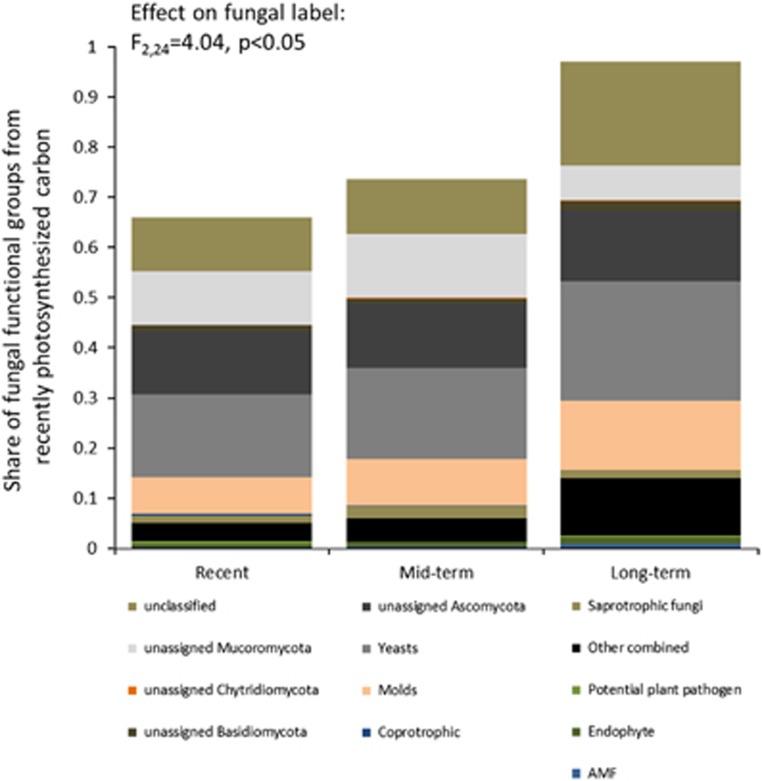
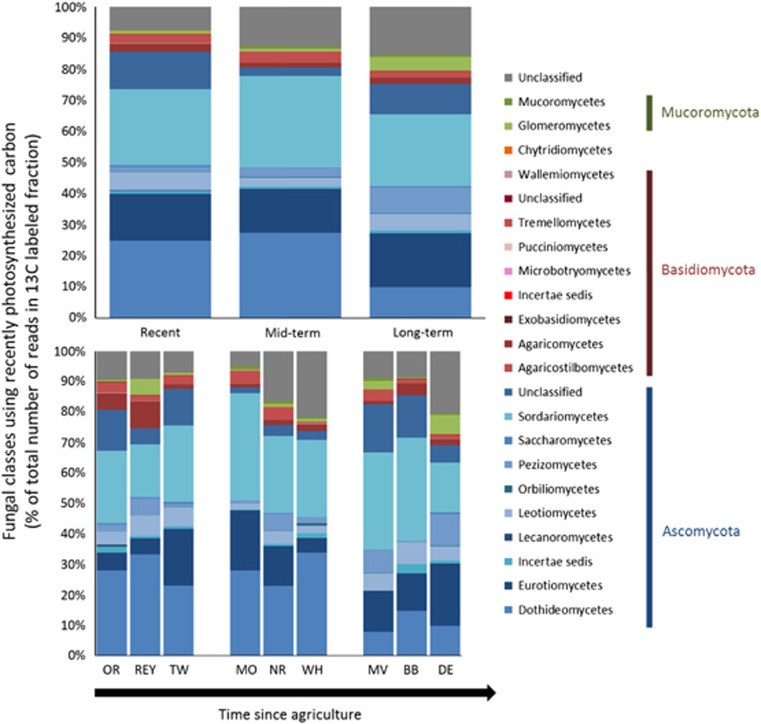
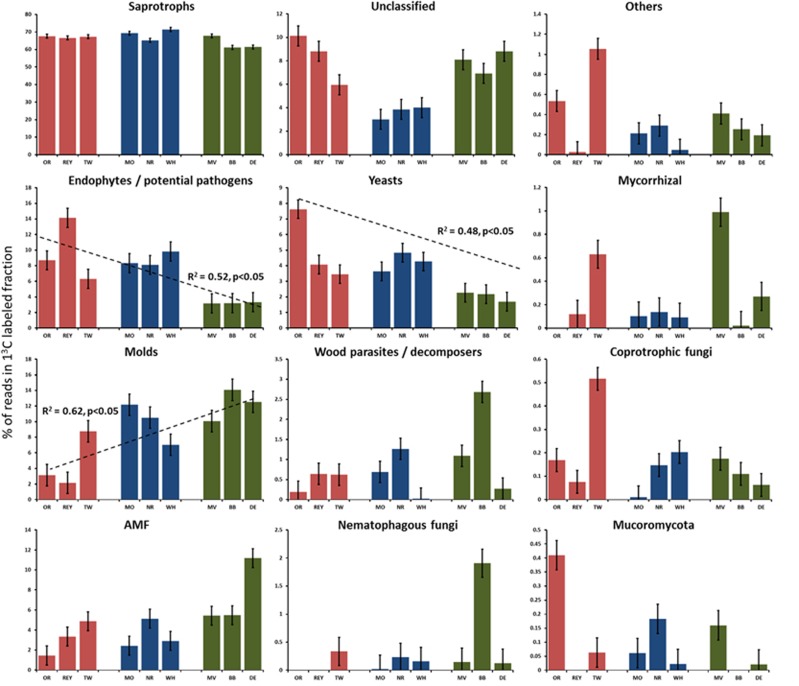
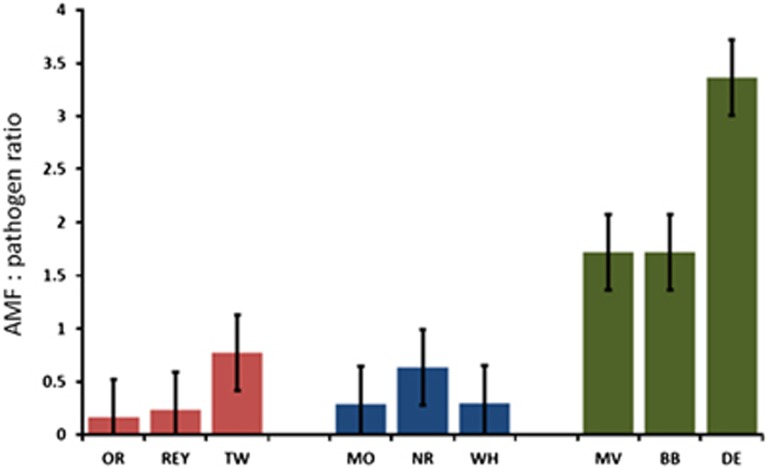
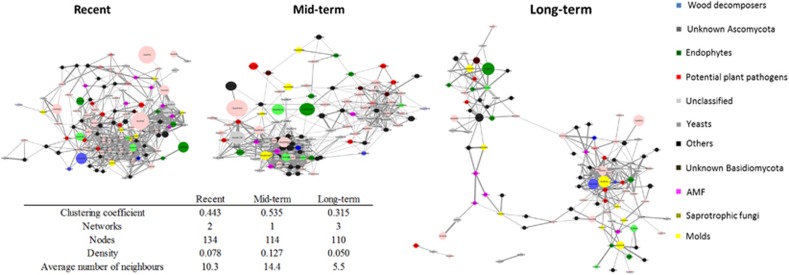
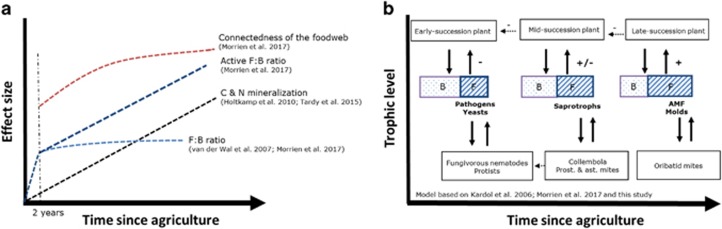
Activities of rhizosphere microbes are key to the functioning of terrestrial ecosystems. It is commonly believed that bacteria are the major consumers of root exudates and that the role of fungi in the rhizosphere is mostly limited to plant-associated taxa, such as mycorrhizal fungi, pathogens and endophytes, whereas less is known about the role of saprotrophs. In order to test the hypothesis that the role of saprotrophic fungi in rhizosphere processes increases with increased time after abandonment from agriculture, we determined the composition of fungi that are active in the rhizosphere along a chronosequence of ex-arable fields in the Netherlands. Intact soil cores were collected from nine fields that represent three stages of land abandonment and pulse labeled with 13CO2. The fungal contribution to metabolization of plant-derived carbon was evaluated using phospholipid analysis combined with stable isotope probing (SIP), whereas fungal diversity was analyzed using DNA-SIP combined with 454-sequencing. We show that in recently abandoned fields most of the root-derived 13C was taken up by bacteria but that in long-term abandoned fields most of the root-derived 13C was found in fungal biomass. Furthermore, the composition of the active functional fungal community changed from one composed of fast-growing and pathogenic fungal species to one consisting of beneficial and slower-growing fungal species, which may have essential consequences for the carbon flow through the soil food web and consequently nutrient cycling and plant succession.
Conflict of interest statement
The authors declare no conflict of interest.
Figures
Similar articles
-
Stimulated saprotrophic fungi in arable soil extend their activity to the rhizosphere and root microbiomes of crop seedlings.Environ Microbiol. 2021 Oct;23(10):6056-6073. doi: 10.1111/1462-2920.15563. Epub 2021 Jun 15. Environ Microbiol. 2021. PMID: 33973345 Free PMC article.
-
Soil microbial communities in dry and moist tropical forests exhibit distinct shifts in community composition but not diversity with succession.Microbiol Spectr. 2025 Mar 4;13(3):e0193124. doi: 10.1128/spectrum.01931-24. Epub 2025 Feb 4. Microbiol Spectr. 2025. PMID: 39902968 Free PMC article.
-
Identifying the Active Microbiome Associated with Roots and Rhizosphere Soil of Oilseed Rape.Appl Environ Microbiol. 2017 Oct 31;83(22):e01938-17. doi: 10.1128/AEM.01938-17. Print 2017 Nov 15. Appl Environ Microbiol. 2017. PMID: 28887416 Free PMC article.
-
Diversity, detection and exploitation: linking soil fungi and plant disease.Curr Opin Microbiol. 2022 Dec;70:102199. doi: 10.1016/j.mib.2022.102199. Epub 2022 Sep 12. Curr Opin Microbiol. 2022. PMID: 36108394 Review.
-
Disentangling arbuscular mycorrhizal fungi and bacteria at the soil-root interface.Mycorrhiza. 2023 Jun;33(3):119-137. doi: 10.1007/s00572-023-01107-7. Epub 2023 Mar 24. Mycorrhiza. 2023. PMID: 36961605 Review.
Cited by
-
Size-dependent loss of aboveground animals differentially affects grassland ecosystem coupling and functions.Nat Commun. 2018 Sep 11;9(1):3684. doi: 10.1038/s41467-018-06105-4. Nat Commun. 2018. PMID: 30206214 Free PMC article.
-
Potential for synergy in soil inoculation for nature restoration by mixing inocula from different successional stages.Plant Soil. 2018;433(1):147-156. doi: 10.1007/s11104-018-3825-0. Epub 2018 Oct 3. Plant Soil. 2018. PMID: 30930494 Free PMC article.
-
Eco-evolutionary processes affecting plant-herbivore interactions during early community succession.Oecologia. 2018 Jun;187(2):547-559. doi: 10.1007/s00442-018-4088-4. Epub 2018 Feb 26. Oecologia. 2018. PMID: 29479632
-
Biochar Amendment Stimulates Utilization of Plant-Derived Carbon by Soil Bacteria in an Intercropping System.Front Microbiol. 2019 Jun 18;10:1361. doi: 10.3389/fmicb.2019.01361. eCollection 2019. Front Microbiol. 2019. PMID: 31316475 Free PMC article.
-
From the High Arctic to the Equator: Do Soil Metagenomes Differ According to Our Expectations?Microb Ecol. 2019 Jan;77(1):168-185. doi: 10.1007/s00248-018-1215-z. Epub 2018 Jun 7. Microb Ecol. 2019. PMID: 29882154
References
-
- Aguilar-Triguerosa CA, Hempel S, Powell JR, Anderson IC, Antonovics J, Bergmann J et al. (2015). Branching out: towards a trait-based understanding of fungal ecology. Fungal Biol Rev 29: 34–41.
-
- Arnold AE. (2007). Understanding the diversity of foliar endophytic fungi: progress, challenges, and frontiers. Fungal Biol Rev 21: 51–60.
-
- Bardgett RD, van der Putten WH. (2014). Belowground biodiversity and ecosystem functioning. Nature 515: 505–511. - PubMed
MeSH terms
Substances
LinkOut - more resources
Full Text Sources
Other Literature Sources
Medical
Miscellaneous
