. 2017 Oct;11(10):2244-2257.
doi: 10.1038/ismej.2017.85. Epub 2017 Jun 6.

Linking rhizosphere microbiome composition of wild and domesticated Phaseolus vulgaris to genotypic and root phenotypic traits

Affiliations

Linking rhizosphere microbiome composition of wild and domesticated Phaseolus vulgaris to genotypic and root phenotypic traits

Juan E Pérez-Jaramillo et al. ISME J. 2017 Oct.

Abstract

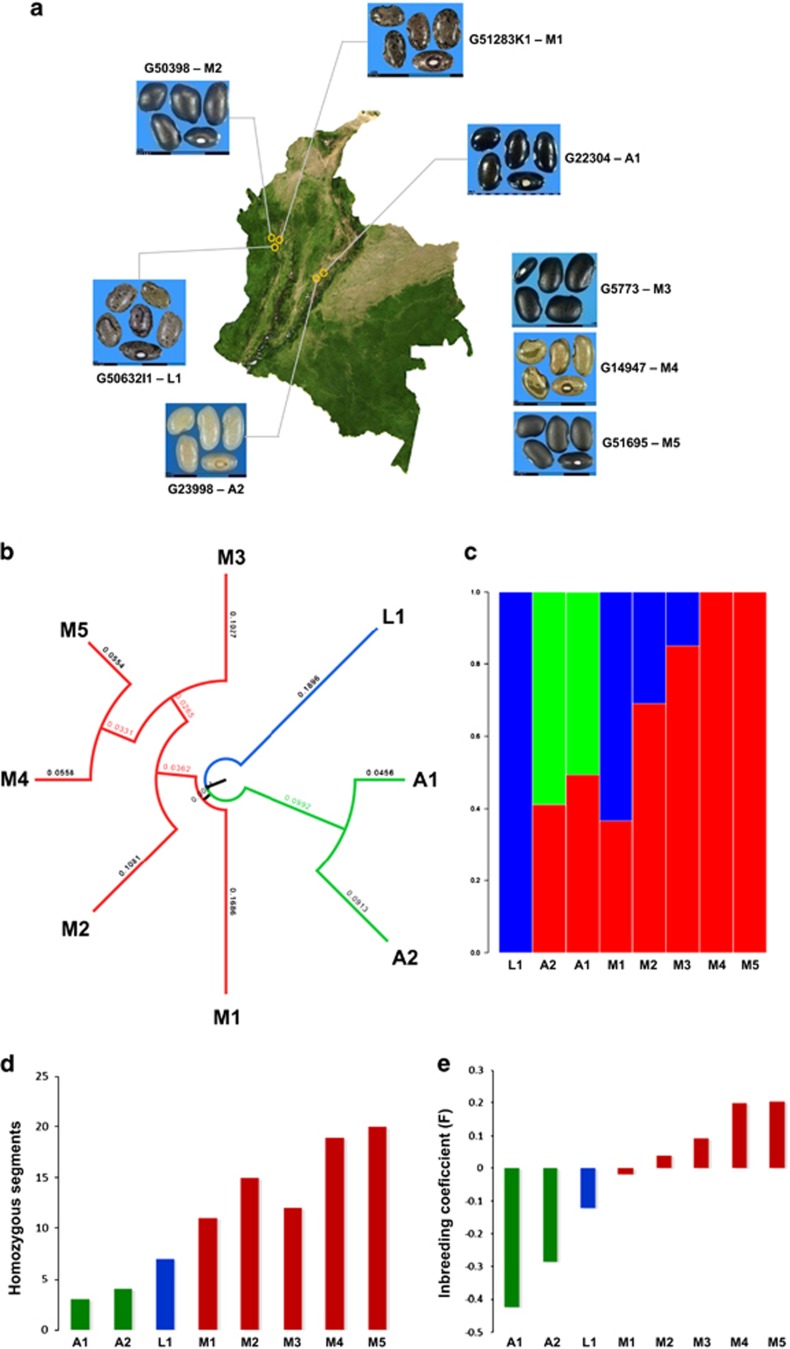
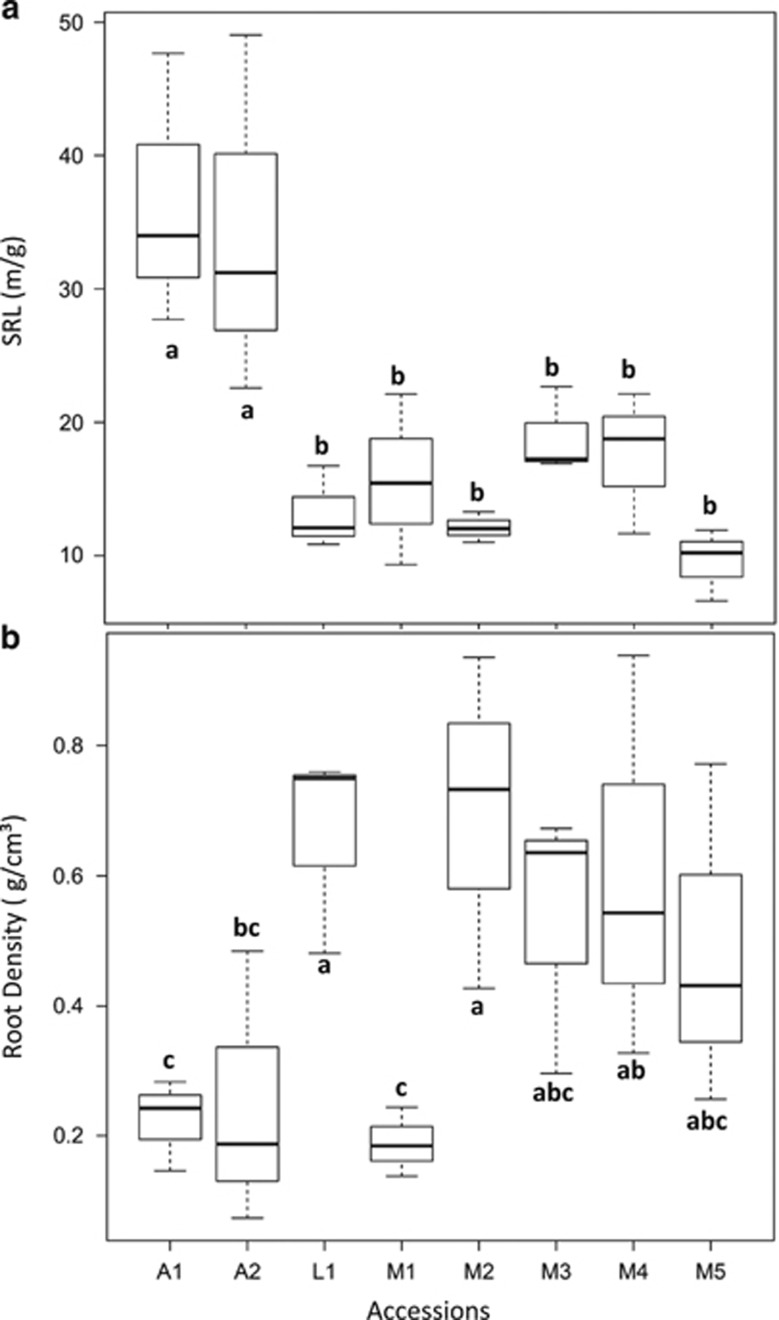
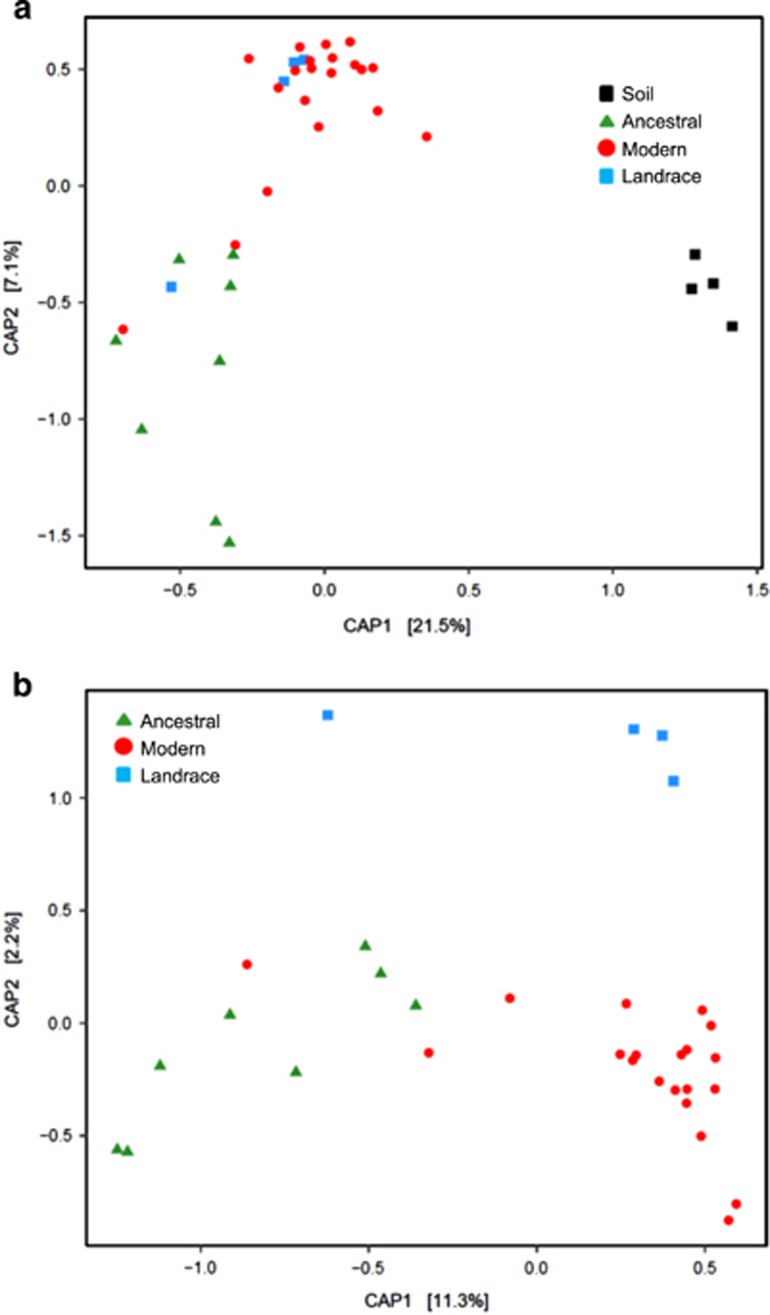
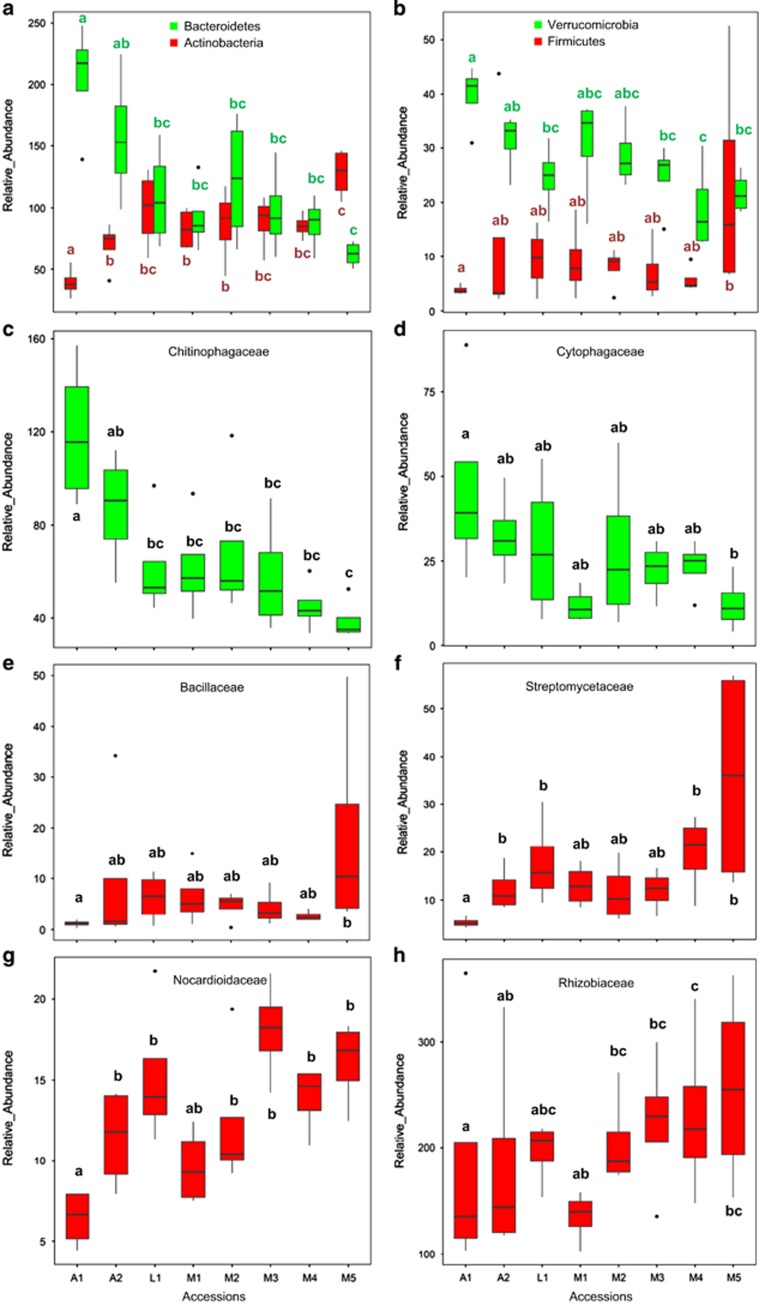
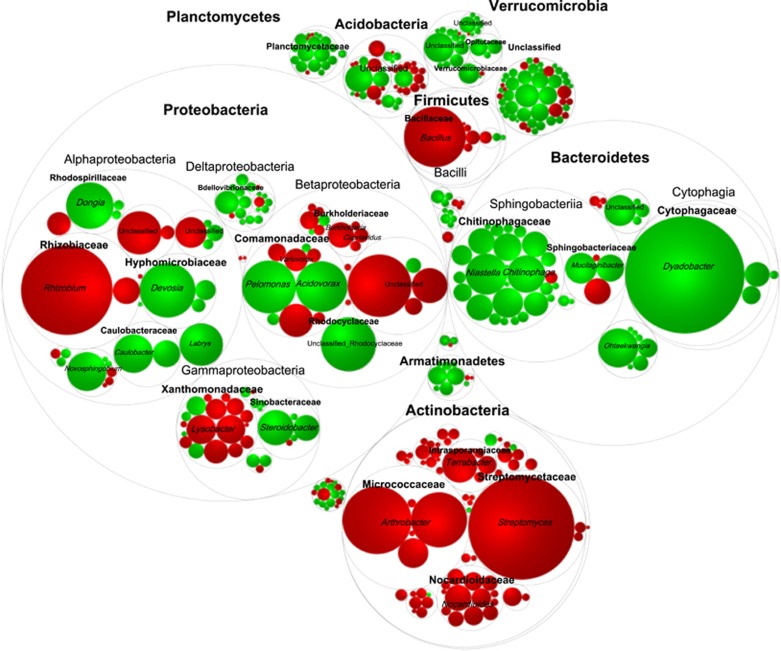
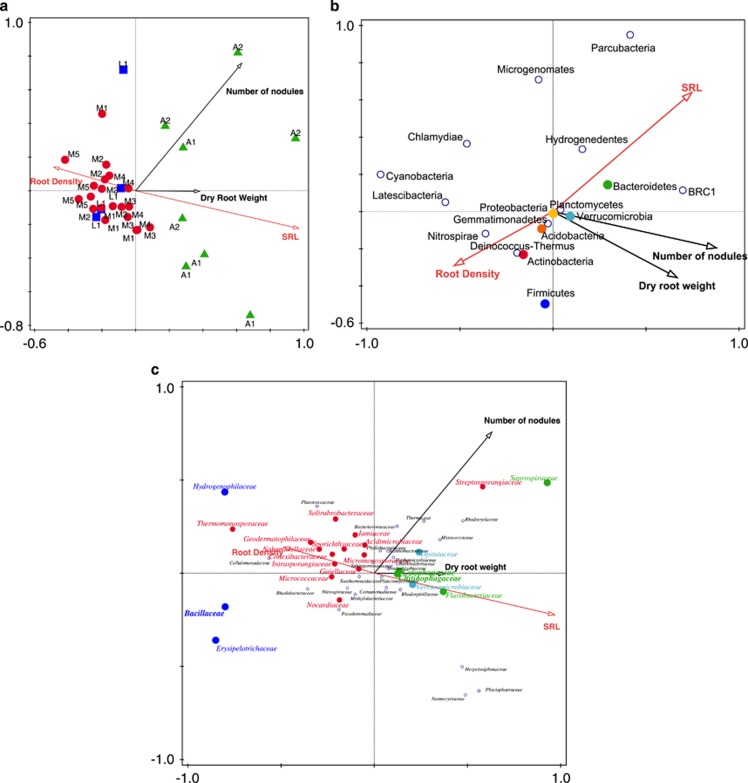
Plant domestication was a pivotal accomplishment in human history, but also led to a reduction in genetic diversity of crop species compared to their wild ancestors. How this reduced genetic diversity affected plant-microbe interactions belowground is largely unknown. Here, we investigated the genetic relatedness, root phenotypic traits and rhizobacterial community composition of modern and wild accessions of common bean (Phaseolus vulgaris) grown in agricultural soil from the highlands of Colombia, one of the centers of common bean diversification. Diversity Array Technology-based genotyping and phenotyping of local common bean accessions showed significant genetic and root architectural differences between wild and modern accessions, with a higher specific root length for the wild accessions. Canonical Correspondence Analysis indicated that the divergence in rhizobacterial community composition between wild and modern bean accessions is associated with differences in specific root length. Along the bean genotypic trajectory, going from wild to modern, we observed a gradual decrease in relative abundance of Bacteroidetes, mainly Chitinophagaceae and Cytophagaceae, and an increase in relative abundance of Actinobacteria and Proteobacteria, in particular Nocardioidaceae and Rhizobiaceae, respectively. Collectively, these results establish a link between common bean domestication, specific root morphological traits and rhizobacterial community assembly.


Conflict of interest statement

The authors declare no conflict of interest.

Figures

Figure 1
Figure 1
Origin and genetic structure of the common bean accessions. (a) Map of Colombia depicting the geographic origin, accession number and classification of the bean accessions based on DArT genotyping performed in this study; (b) Neighbor joining and phylogenetic relatedness; (c) STRUCTURE analysis (k=3); (d) Number of homozygous segments; (e) Inbreeding coefficients (F-values). Green color is assigned to ancestral accessions A1 and A2, blue to the landrace accession L1 and red to modern accessions M1–M5. DArT, Diversity Array Technology.
Figure 2
Figure 2
Root morphology parameters of common bean accessions. (a) Specific Root Length is the product of root length divided by the root dry weight, and (b) Root density is the product of root dry weight divided by root volume. Root length and root volume were determined by WinRHIZO. Statistically significant differences between group means for SRL and for Root Density were determined by one-way ANOVA (P<0.05). Three replicates per accession were used. Different letters indicate statistically significant differences (Fisher LSD test).
Figure 3
Figure 3
Rhizosphere bacterial community structure of common bean. Constrained Analysis of Principal Coordinates (CAP) of 16S rRNA diversity in the rhizosphere of the eight common bean accessions used in this study, with (a) and without (b) 16S rRNA diversity in the bulk soil, respectively. CSS transformed reads were used to calculate Bray–Curtis distances and a constrained analysis was performed by microhabitat (a) (30.2% of the overall variance; P<0.005) and bean group (b) (13.47% of the overall variance; P<0.005). Statistical significance of the constrained analysis was assessed by Permanova (P<0.005). CSS, cumulative-sum scaling.
Figure 4
Figure 4
Relative abundance of bacterial phyla and families in the rhizosphere of the different bean accessions. The relative abundance (‰) of the phyla and families of four replicates per accession was used. At phylum level, results are shown for (a) Bacteroidetes and Actinobacteria, and (b) Firmicutes and Verrucomicrobia. At family level, results are shown for representatives of the Bacteroidetes (Chitinophagaceae (c) and Cytophagaceae (d)). For the Firmicutes and Actinobacteria, results are shown for Bacillaceae (e), Streptomycetaceae (f) and Nocardioidaceae (g). For the phylum Proteobacteria, the relative abundance of the Rhizobiaceae (h) is shown. Different letters indicate significant differences between accessions (moderated t-test, FDR<0.1).
Figure 5
Figure 5
Differential abundance of bacterial OTUs between the wild bean accession A1 and modern bean accession M5. The comparison was made using a zero-inflated Gaussian distribution mixture model followed by moderated t-test and a Bayesian approach. Data from four replicates per accession was used. Only OTUs significantly enriched in one of the two accessions are shown (FDR<0.05). The largest circles represents Phylum level. The inner circles represent Class and Family level. The color of the circles represents the OTUs enriched in the rhizosphere of wild accession A1 (green) or of modern accession M5 (red), with the assigned Genus in italics. The size of the circle is the mean read relative abundance of the differentially abundant OTU.
Figure 6
Figure 6
Constrained Canonical Correspondence Analysis of 16S sequence data and root morphological traits. (a) Root morphological traits as explanatory variables for the divergence between the overall rhizobacterial community composition of the eight different bean accessions. The rhizobacterial community composition is based on CSS normalized counts. Green triangles represent the replicates of the wild bean accessions A1 and A2, blue squares represent the landrace accession L1, and red circles represent the modern bean accessions M1–M5. The colored arrows represent the root morphological traits: Number of nodules and Dry root weight (black), Specific Root Length (SRL) and Root Density (red). (b) Same as in (a) depicting the root morphological traits as explanatory variables for the divergence between the different bacterial phyla. Only phyla with a relative abundance higher than 1% are colored: Acidobacteria (orange), Actinobacteria (red), Bacteroidetes (green), Firmicutes (blue), Proteobacteria (yellow) and Verrucomicrobia (light blue). (c) Same as in (b), depicting the root morphological traits as explanatory variables for the divergence between the bacterial families. Here, only the bacterial families belonging to Actinobacteria (red), Bacteroidetes (green), Verrucomicrobia (light blue) and Firmicutes (blue) were highlighted. CSS, cumulative-sum scaling.

References

    1. Akibode S, Maredia M. (2011) Global and regional trends in production, trade and consumption of food legume crops. Report submitted to the CGIAR Standing Panel on Impact Assessment http://www.cgiar.org/our-research/crop-factsheets/beans/).
    1. Badri DV, Chaparro JM, Zhang R, Shen Q, Vivanco JM. (2013). Application of natural blends of phytochemicals derived from the root exudates of Arabidopsis to the soil reveal that phenolic related compounds predominantly modulate the soil microbiome. J Biol Chem 288: 4502–4512. - PMC - PubMed
    1. Berg G, Smalla K. (2009). Plant species and soil type cooperatively shape the structure and function of microbial communities in the rhizosphere. FEMS Microbiol Ecol 68: 1–13. - PubMed
    1. Bitocchi E, Nanni L, Bellucci E, Rossi M, Giardini A, Zeuli PS et al. (2012). Mesoamerican origin of the common bean (Phaseolus vulgaris L.) is revealed by sequence data. Proc Natl Acad Sci USA 109: E788–E796. - PMC - PubMed
    1. Blair MW, Soler A, Cortés AJ. (2012). Diversification and population structure in common beans (Phaseolus vulgaris L.). PLoS One 7: e49488. - PMC - PubMed