

Fli-1 overexpression in erythroleukemic cells promotes erythroid de-differentiation while Spi-1/PU.1 exerts the opposite effect
- PMID: 28586009
- PMCID: PMC5505126
- DOI: 10.3892/ijo.2017.4027
Fli-1 overexpression in erythroleukemic cells promotes erythroid de-differentiation while Spi-1/PU.1 exerts the opposite effect
Abstract
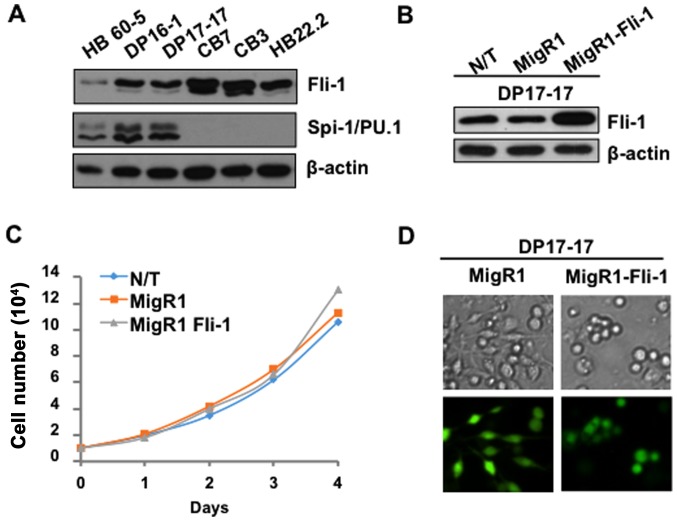
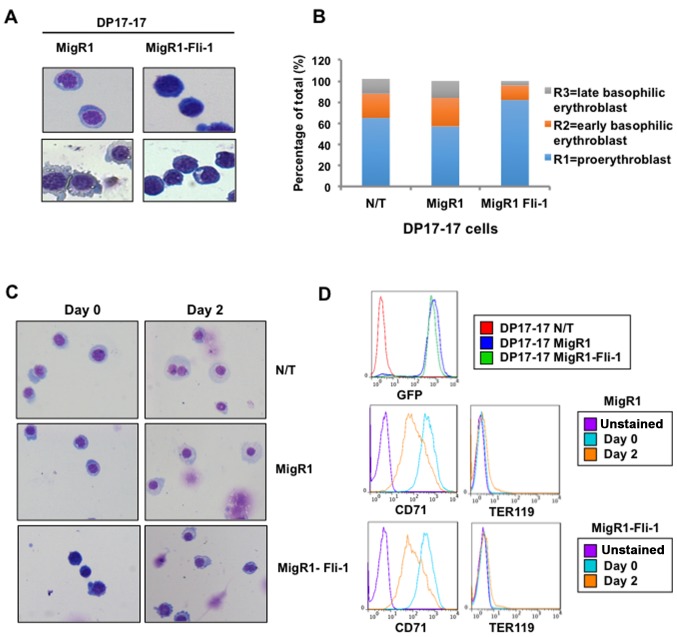
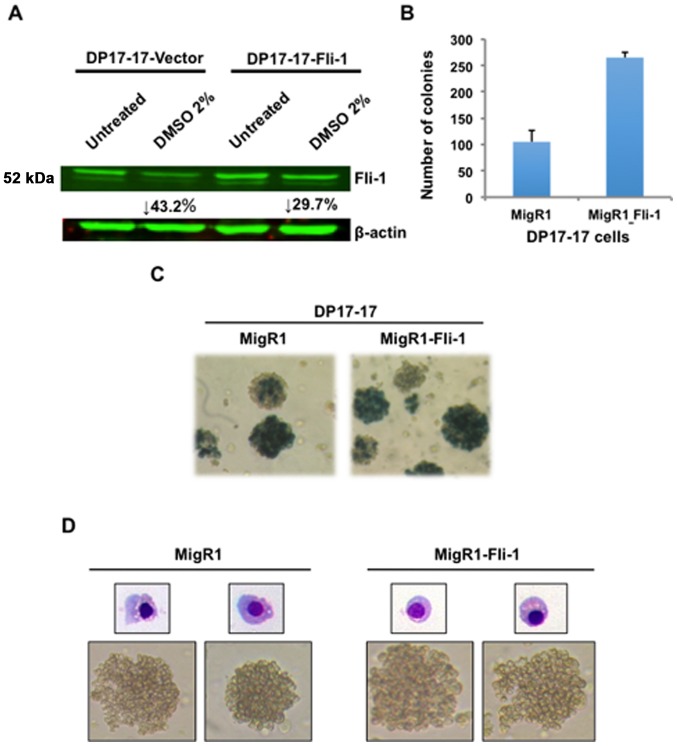
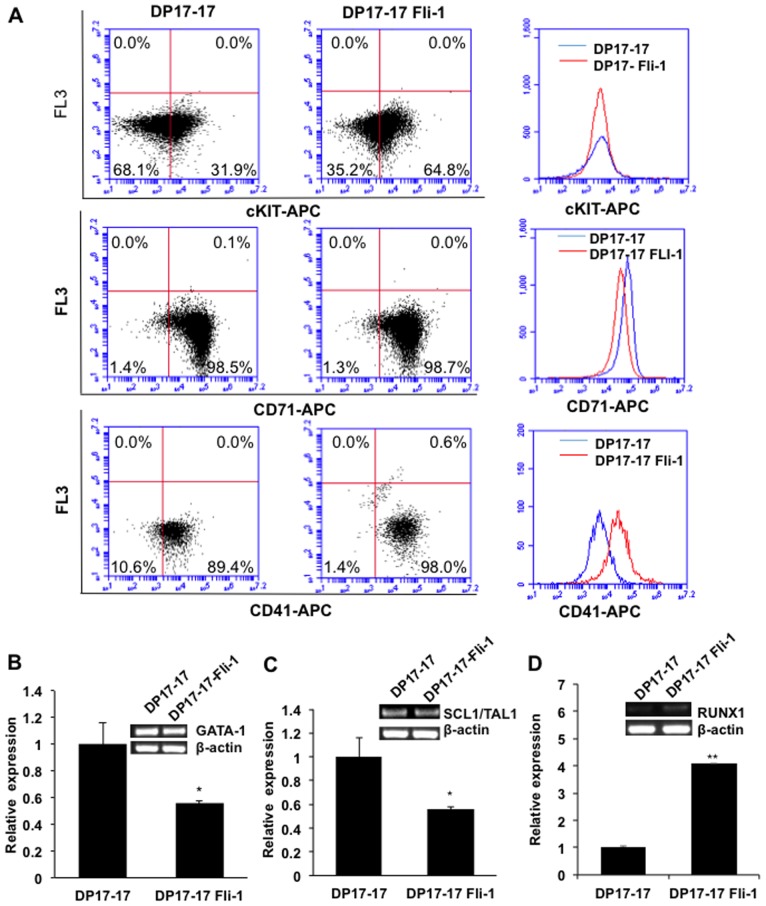
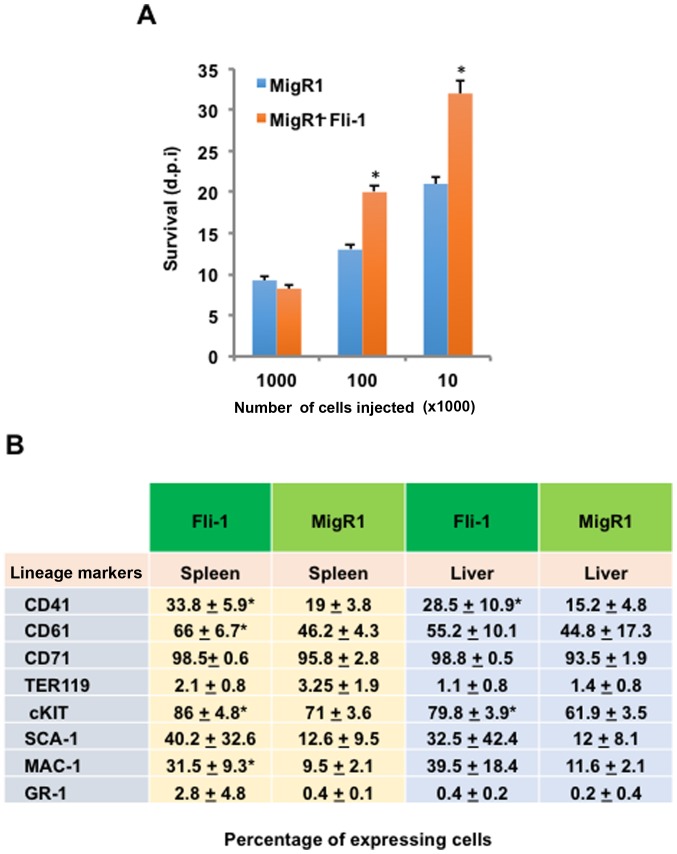
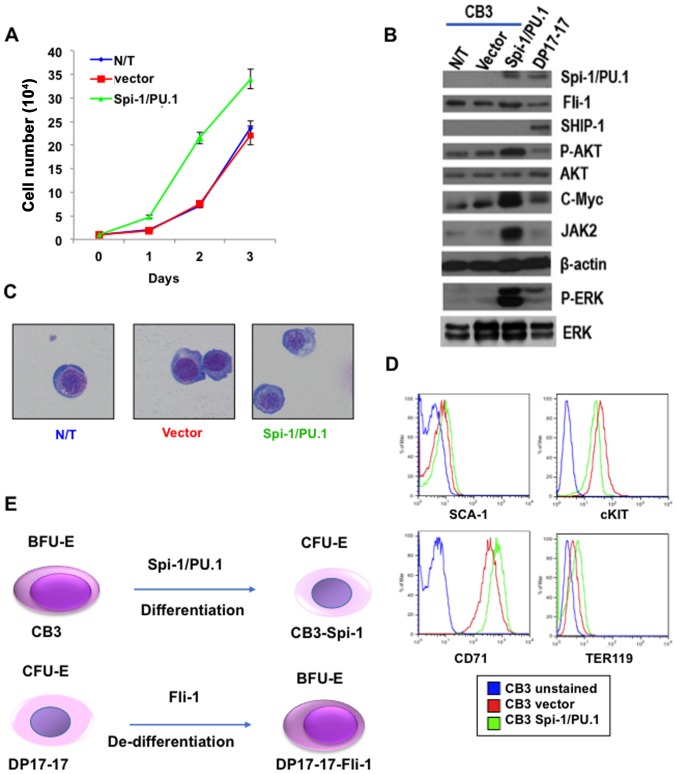
The ETS transcription factors play a critical role during hematopoiesis. In F-MuLV-induced erythroleukemia, Fli‑1 insertional activation producing high expression of this transcription factor required to promote proliferation. How deregulated Fli‑1 expression alters the balance between erythroid differentiation and proliferation is unknown. To address this issue, we exogenously overexpressed Fli‑1 in an erythroleukemic cell harboring activation of spi‑1/PU.1, another ETS gene involved in erythroleukemogenesis. While the proliferation in culture remains unaffected, Fli‑1 overexpression imparts morphological and immunohistochemical characteristics of immature erythroid progenitors. Fli‑1 overexpression in erythroleukemic cells increased the numbers of erythroid colonies on methylcellulose and reduced tumorigenicity as evidenced by increase latency of erythroleukemogenesis in mice inoculated with these cells. Although all transplanted mice developed enlargement of the spleen and liver due to leukemic infiltration, Fli‑1 overexpression altered the hematopoietic phenotype, significantly increasing the expression of regulatory hematopoietic genes cKIT, SCA-1, CD41 and CD71. In contrast, expression of Spi‑1/PU.1 in a Fli‑1 producing erythroleukemia cell line in which fli‑1 is activated, resulted in increased proliferation through activation of growth promoting proteins MAPK, AKT, cMYC and JAK2. Importantly, these progenitors express high levels of markers such as CD71 and TER119 associated with more mature erythroid cells. Thus, Fli‑1 overexpression induces a de-differentiation program by reverting CFU-E to BFU-E erythroid progenitor activity, while Spi‑1/PU.1 promoting maturation from BFU-E to CFU-E.
Figures
Similar articles
-
Spi-1/PU.1 is a positive regulator of the Fli-1 gene involved in inhibition of erythroid differentiation in friend erythroleukemic cell lines.Mol Cell Biol. 1999 Jan;19(1):121-35. doi: 10.1128/MCB.19.1.121. Mol Cell Biol. 1999. PMID: 9858537 Free PMC article.
-
FLI-1 inhibits differentiation and induces proliferation of primary erythroblasts.Oncogene. 1999 Feb 25;18(8):1597-608. doi: 10.1038/sj.onc.1202534. Oncogene. 1999. PMID: 10102630
-
Spi-1/PU.1 but not Fli-1 inhibits erythroid-specific alternative splicing of 4.1R pre-mRNA in murine erythroleukemia cells.Oncogene. 2004 Jan 29;23(4):920-7. doi: 10.1038/sj.onc.1207206. Oncogene. 2004. PMID: 14647452
-
The role of Ets family transcription factor PU.1 in hematopoietic cell differentiation, proliferation and apoptosis.Cell Death Differ. 1999 Jul;6(7):599-608. doi: 10.1038/sj.cdd.4400534. Cell Death Differ. 1999. PMID: 10453070 Review.
-
The role of Fli-1 in normal cell function and malignant transformation.Oncogene. 2000 Dec 18;19(55):6482-9. doi: 10.1038/sj.onc.1204042. Oncogene. 2000. PMID: 11175364 Review.
Cited by
-
PU.1 interacts with KLF7 to suppress differentiation and promote proliferation in chicken preadipocytes.Acta Biochim Biophys Sin (Shanghai). 2023 Jan 25;55(1):143-153. doi: 10.3724/abbs.2022202. Acta Biochim Biophys Sin (Shanghai). 2023. PMID: 36647727 Free PMC article.
-
Identification of diterpenoid compounds that interfere with Fli-1 DNA binding to suppress leukemogenesis.Cell Death Dis. 2019 Feb 11;10(2):117. doi: 10.1038/s41419-019-1363-1. Cell Death Dis. 2019. PMID: 30741932 Free PMC article.
-
L1, a 3,3'-diindolylmethane-derivative, induced ER stress-mediated apoptosis and suppressed growth through the FLI1/AKT pathway in erythroleukemia HEL cells.Front Pharmacol. 2025 Aug 1;16:1564199. doi: 10.3389/fphar.2025.1564199. eCollection 2025. Front Pharmacol. 2025. PMID: 40822462 Free PMC article.
-
Angiosarcoma: a systematic review of biomarkers in diagnosis, prognosis, and therapeutic strategies.Front Oncol. 2025 Jul 1;15:1623327. doi: 10.3389/fonc.2025.1623327. eCollection 2025. Front Oncol. 2025. PMID: 40666093 Free PMC article.
-
UM171 cooperates with PIM1 inhibitors to restrict HSC expansion markers and suppress leukemia progression.Cell Death Discov. 2022 Nov 5;8(1):448. doi: 10.1038/s41420-022-01244-6. Cell Death Discov. 2022. PMID: 36335089 Free PMC article.
References
MeSH terms
Substances
LinkOut - more resources
Full Text Sources
Other Literature Sources
Research Materials
Miscellaneous
