Randomized Controlled Trial
. 2017 Dec;66(6):1727-1738.
doi: 10.1002/hep.29306. Epub 2017 Oct 30.

Fecal microbiota transplant from a rational stool donor improves hepatic encephalopathy: A randomized clinical trial

Affiliations
Randomized Controlled Trial

Fecal microbiota transplant from a rational stool donor improves hepatic encephalopathy: A randomized clinical trial

Jasmohan S Bajaj et al. Hepatology. 2017 Dec.

Abstract

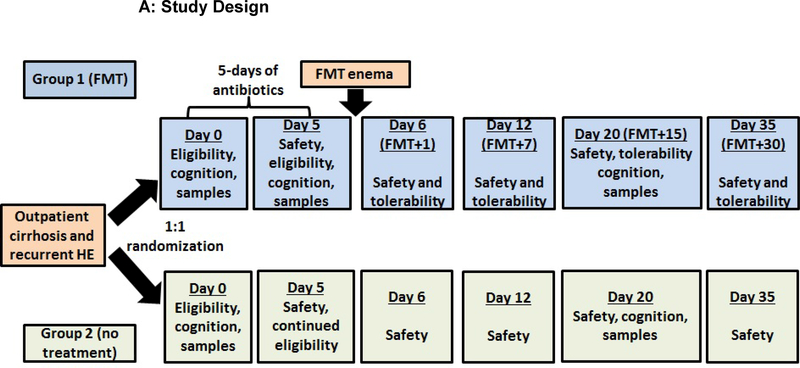
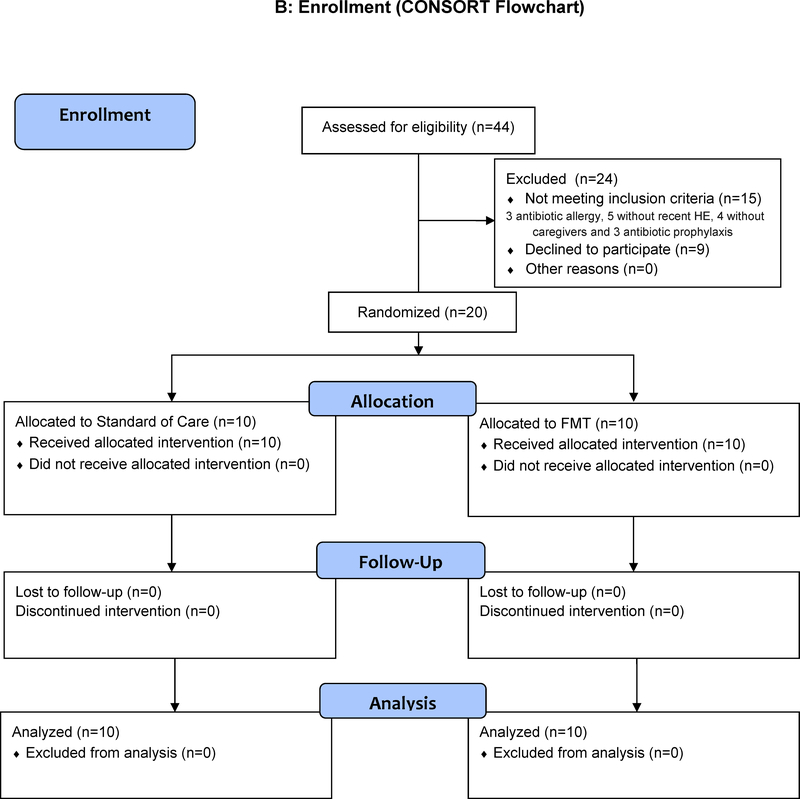
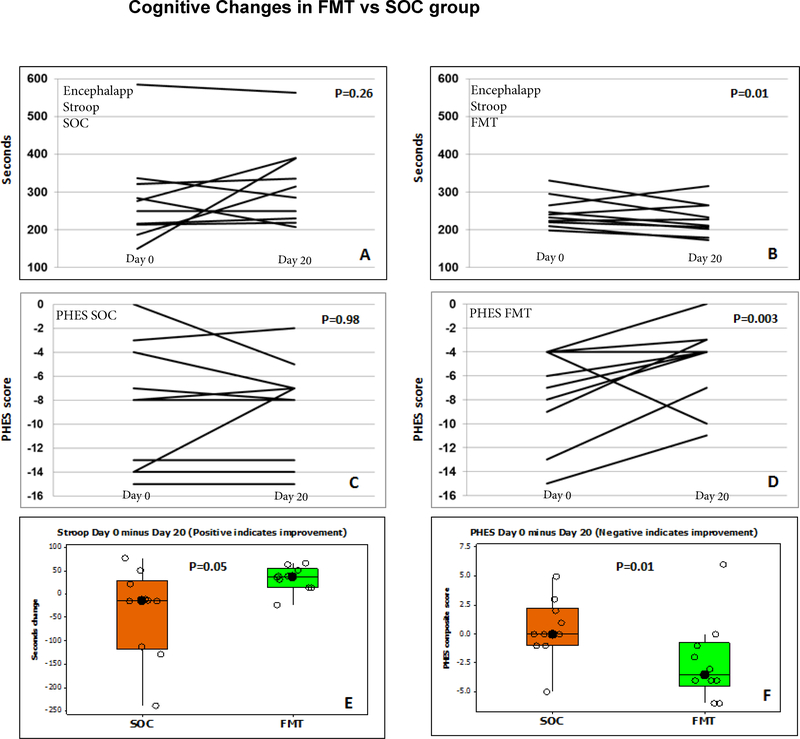
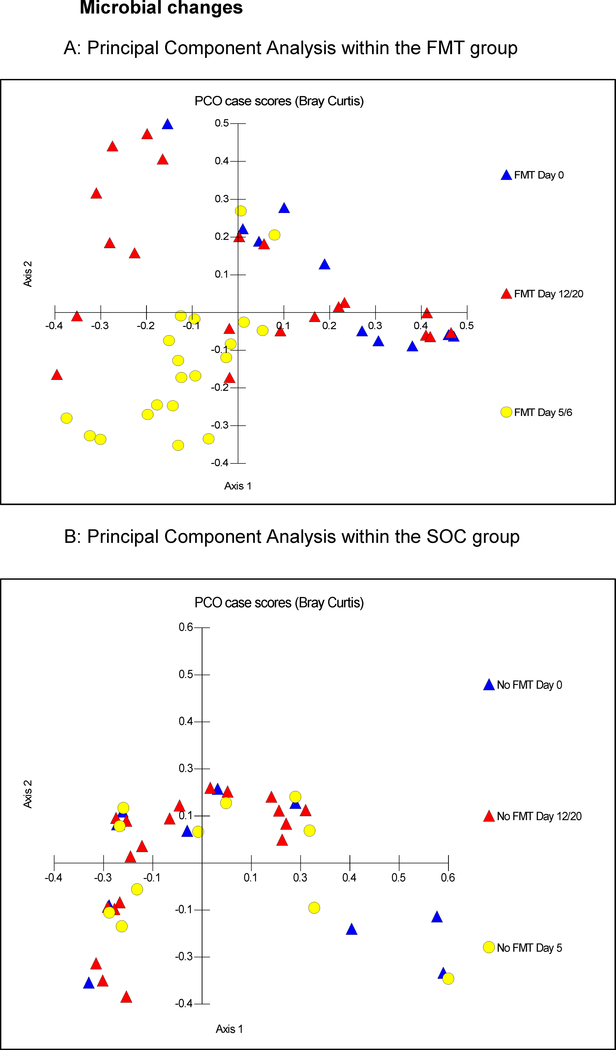
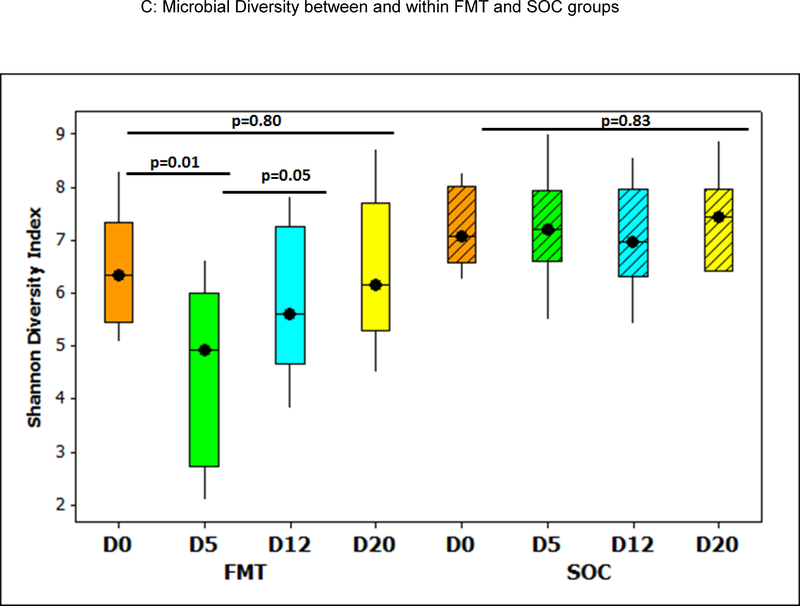
Recurrent hepatic encephalopathy (HE) is a leading cause of readmission despite standard of care (SOC) associated with microbial dysbiosis. Fecal microbiota transplantation (FMT) may improve dysbiosis; however, it has not been studied in HE. We aimed to define whether FMT using a rationally derived stool donor is safe in recurrent HE compared to SOC alone. An open-label, randomized clinical trial with a 5-month follow-up in outpatient men with cirrhosis with recurrent HE on SOC was conducted with 1:1 randomization. FMT-randomized patients received 5 days of broad-spectrum antibiotic pretreatment, then a single FMT enema from the same donor with the optimal microbiota deficient in HE. Follow-up occurred on days 5, 6, 12, 35, and 150 postrandomization. The primary outcome was safety of FMT compared to SOC using FMT-related serious adverse events (SAEs). Secondary outcomes were adverse events, cognition, microbiota, and metabolomic changes. Participants in both arms were similar on all baseline criteria and were followed until study end. FMT with antibiotic pretreatment was well tolerated. Eight (80%) SOC participants had a total of 11 SAEs compared to 2 (20%) FMT participants with SAEs (both FMT unrelated; P = 0.02). Five SOC and no FMT participants developed further HE (P = 0.03). Cognition improved in the FMT, but not the SOC, group. Model for End-Stage Liver Disease (MELD) score transiently worsened postantibiotics, but reverted to baseline post-FMT. Postantibiotics, beneficial taxa, and microbial diversity reduction occurred with Proteobacteria expansion. However, FMT increased diversity and beneficial taxa. SOC microbiota and MELD score remained similar throughout.

Conclusion: FMT from a rationally selected donor reduced hospitalizations, improved cognition, and dysbiosis in cirrhosis with recurrent HE. (Hepatology 2017;66:1727-1738).


Figures

Figure 1:
Figure 1:
Patient flow and study design; Figure 1A: Flow chart of study design; patients were followed for 150 days after enrollment. At day 5 after randomization (post-antibiotics in the FMT arm), blood, urine and stool was collected from all participants and adverse events (AE), new medications and diagnoses as well as adherence to the original diet was documented. All participants were seen at day 6 after randomization (day 1 post-FMT in the FMT arm) where a solicited/unsolicited AE assessment, safety laboratories (MELD score, liver function tests, CBC), urine and stool was collected. Similarly, at days 12 and 20 post-randomization, we performed safety laboratories, collected blood, urine and stool, and evaluated AEs. At day 20, both cognitive tests were re-administered. At day 35, we collected safety laboratories and evaluated AEs. At day 150, SAE assessment was conducted. Figure 1B: CONSORT Flow chart showing that there were no dropouts and all subjects were followed throughout the study
Figure 1:
Figure 1:
Patient flow and study design; Figure 1A: Flow chart of study design; patients were followed for 150 days after enrollment. At day 5 after randomization (post-antibiotics in the FMT arm), blood, urine and stool was collected from all participants and adverse events (AE), new medications and diagnoses as well as adherence to the original diet was documented. All participants were seen at day 6 after randomization (day 1 post-FMT in the FMT arm) where a solicited/unsolicited AE assessment, safety laboratories (MELD score, liver function tests, CBC), urine and stool was collected. Similarly, at days 12 and 20 post-randomization, we performed safety laboratories, collected blood, urine and stool, and evaluated AEs. At day 20, both cognitive tests were re-administered. At day 35, we collected safety laboratories and evaluated AEs. At day 150, SAE assessment was conducted. Figure 1B: CONSORT Flow chart showing that there were no dropouts and all subjects were followed throughout the study
Figure 2:
Figure 2:
Cognitive function changes; FMT: fecal microbiota transplant, SOC: standard of care, PHES: psychometric hepatic encephalopathy score Figure 2A: EncephalApp Stroop in SOC group shows no significant change in OffTime+OnTime in seconds compared to baseline. The first data point is day 0 and the second data point is day 20. This was not significant even when the outlier subject values were removed Figure 2B: EncephalApp Stroop in FMT group showed significant improvement (reduction) in OffTime+OnTime in seconds compared to baseline. The first data point is day 0 and the second data point is day 20 (day 15 post-FMT) Figure 2C: PHES score in the SOC group did not show any change in the SOC group. The first data point is day 0 and the second data point is day 20. Y axis is the sum of standard deviations of PHES scores compared to healthy controls Figure 2D: PHES score in the FMT group significantly improved (decreased) compared to baseline. The first data point is day 0 and the second data point is day 20 (day 15 post-FMT). Figure 2E: Delta in EncephalApp Stroop in baseline minus day 20 (negative values indicate improvement) shows that there was a significant improvement in FMT compared to SOC group. Data are shown as median and 95% CI intervals. Figure 2F: Delta in PHES in baseline minus day 20 showed a significant improvement (positive values indicate improvement) in FMT compared to SOC group. Data are shown as median and 95% CI intervals.
Figure 3:
Figure 3:
Microbial changes throughout the trial, FMT: fecal microbiota transplant, SOC: standard of care, PCA: Principal component analysis, Figure 3A: PCA of gut microbiota in patients in the FMT group, Blue triangles: baseline values, Yellow circles: day 5 and 6 and Red triangles: days 12 and 20. There was relative clustering of the stool microbiota at days 5 and 6 away from day 0, while at day 12/20, these reached close to the day 0 values. Figure 3B: PCA of gut microbiota in patients in the SOC group; blue triangles: baseline, yellow circles: day 5 and red triangles: days 12 and 20. There was no specific clustering observed at any time point Figure 3C: Shannon diversity index changes over time; there was a significant reduction in Shannon index (decreased diversity after antibiotics) at day 5, which resolved significantly post-FMT. No changes were seen in the SOC group. D0: day 0, baseline, D5: post-antibiotics in FMT group before FMT; no intervention in SOC group, D12: 7 days post-FMT and D20: 15 days post-FMT in FMT group. Boxes in shaded colors indicate SOC group. Data are shown as median and 95% CI intervals.
Figure 3:
Figure 3:
Microbial changes throughout the trial, FMT: fecal microbiota transplant, SOC: standard of care, PCA: Principal component analysis, Figure 3A: PCA of gut microbiota in patients in the FMT group, Blue triangles: baseline values, Yellow circles: day 5 and 6 and Red triangles: days 12 and 20. There was relative clustering of the stool microbiota at days 5 and 6 away from day 0, while at day 12/20, these reached close to the day 0 values. Figure 3B: PCA of gut microbiota in patients in the SOC group; blue triangles: baseline, yellow circles: day 5 and red triangles: days 12 and 20. There was no specific clustering observed at any time point Figure 3C: Shannon diversity index changes over time; there was a significant reduction in Shannon index (decreased diversity after antibiotics) at day 5, which resolved significantly post-FMT. No changes were seen in the SOC group. D0: day 0, baseline, D5: post-antibiotics in FMT group before FMT; no intervention in SOC group, D12: 7 days post-FMT and D20: 15 days post-FMT in FMT group. Boxes in shaded colors indicate SOC group. Data are shown as median and 95% CI intervals.

Comment in

References

    1. Vilstrup H, Amodio P, Bajaj J, Cordoba J, Ferenci P, Mullen KD, Weissenborn K, et al. Hepatic encephalopathy in chronic liver disease: 2014 Practice Guideline by the American Association for the Study of Liver Diseases and the European Association for the Study of the Liver. Hepatology 2014;60:715–735. - PubMed
    1. Bajaj JS, Reddy KR, Tandon P, Wong F, Kamath PS, Garcia-Tsao G, Maliakkal B, et al. The 3-month readmission rate remains unacceptably high in a large North American cohort of patients with cirrhosis. Hepatology 2016;64:200–208. - PMC - PubMed
    1. Stepanova M, Mishra A, Venkatesan C, Younossi ZM. In-hospital mortality and economic burden associated with hepatic encephalopathy in the United States from 2005 to 2009. Clin Gastroenterol Hepatol 2012;10:1034–1041 e1031. - PubMed
    1. Fernandez J, Tandon P, Mensa J, Garcia-Tsao G. Antibiotic prophylaxis in cirrhosis: Good and bad. Hepatology 2016;63:2019–2031. - PubMed
    1. Bajaj JS, O’Leary JG, Reddy KR, Wong F, Olson JC, Subramanian RM, Brown G, et al. Second infections independently increase mortality in hospitalized patients with cirrhosis: the North American consortium for the study of end-stage liver disease (NACSELD) experience. Hepatology 2012;56:2328–2335. - PMC - PubMed

Publication types