. 2017 Aug;47(8):1342-1353.
doi: 10.1002/eji.201646765. Epub 2017 Jul 4.

Card9-dependent IL-1β regulates IL-22 production from group 3 innate lymphoid cells and promotes colitis-associated cancer

Affiliations

Card9-dependent IL-1β regulates IL-22 production from group 3 innate lymphoid cells and promotes colitis-associated cancer

Hanna Bergmann et al. Eur J Immunol. 2017 Aug.

Abstract

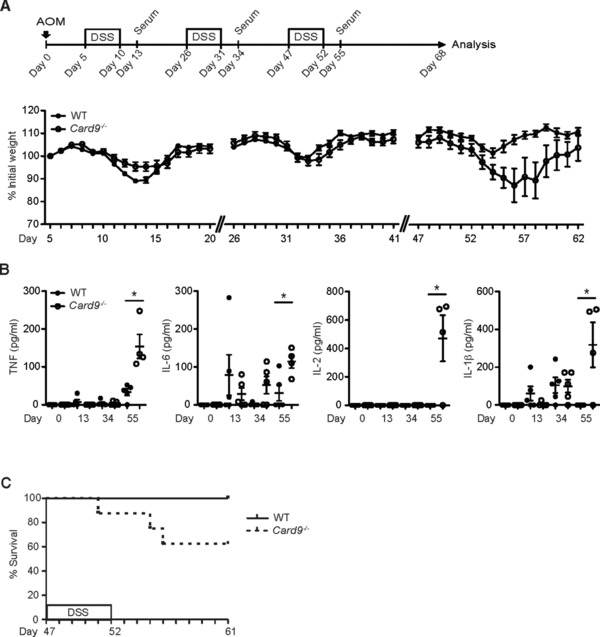
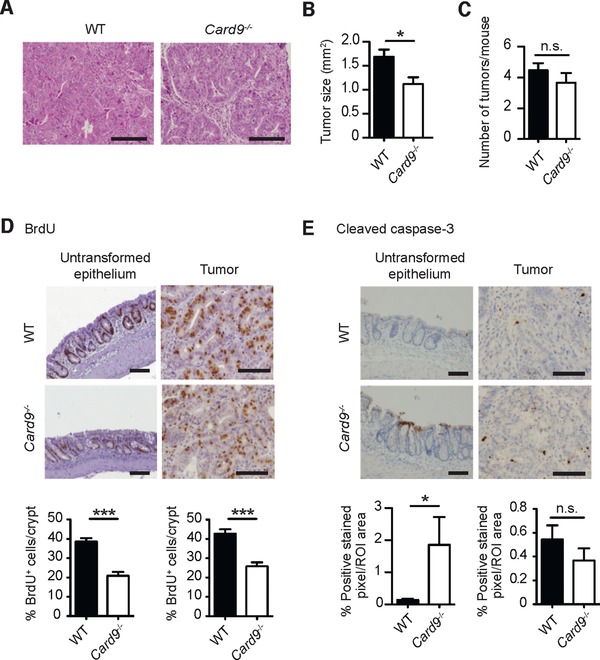
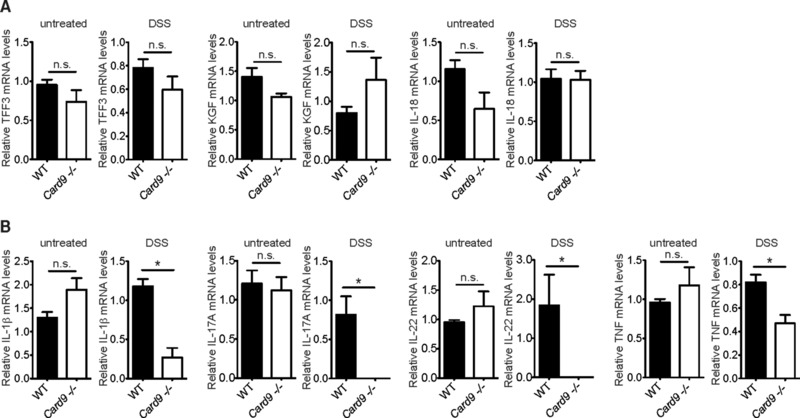
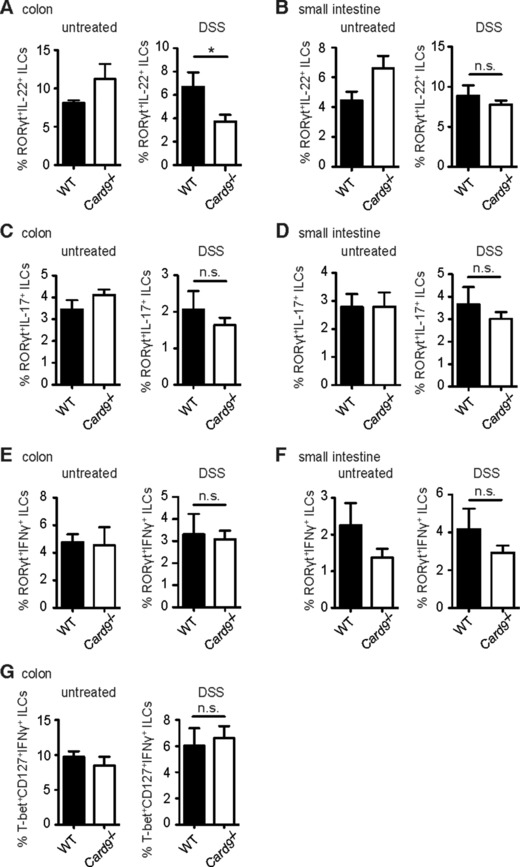
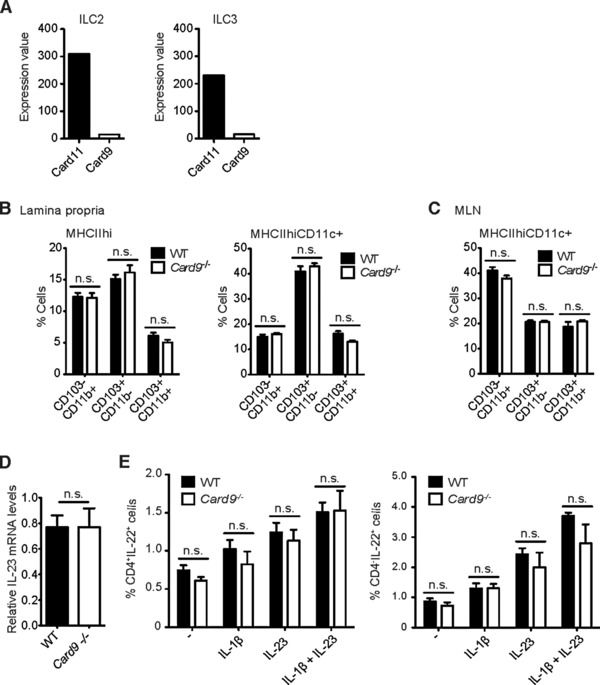
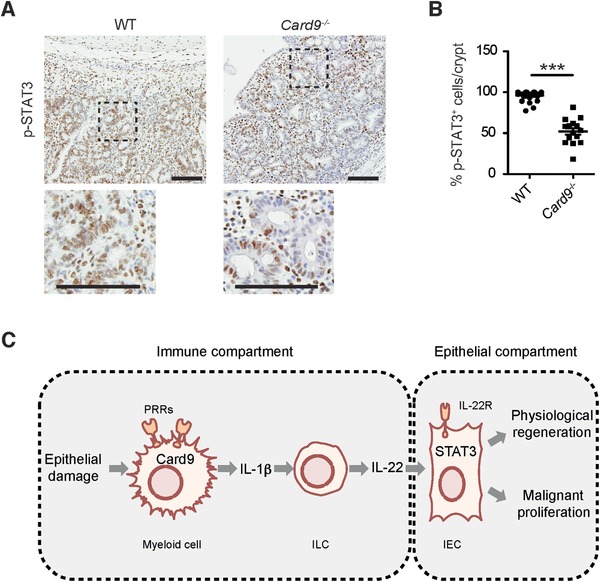
Inflammatory bowel diseases (IBD) are key risk factors for the development of colorectal cancer, but the mechanisms that link intestinal inflammation with carcinogenesis are insufficiently understood. Card9 is a myeloid cell-specific signaling protein that regulates inflammatory responses downstream of various pattern recognition receptors and which cooperates with the inflammasomes for IL-1β production. Because polymorphisms in Card9 were recurrently associated with human IBD, we investigated the function of Card9 in a colitis-associated cancer (CAC) model. Card9-/- mice develop smaller, less proliferative and less dysplastic tumors compared to their littermates and in the regenerating mucosa we detected dramatically impaired IL-1β generation and defective IL-1β controlled IL-22 production from group 3 innate lymphoid cells. Consistent with the key role of immune-derived IL-22 in activating STAT3 signaling during normal and pathological intestinal epithelial cell (IEC) proliferation, Card9-/- mice also exhibit impaired tumor cell intrinsic STAT3 activation. Our results imply a Card9-controlled, ILC3-mediated mechanism regulating healthy and malignant IEC proliferation and demonstrates a role of Card9-mediated innate immunity in inflammation-associated carcinogenesis.

Keywords: Card9; Colitis-associated-cancer; Innate lymphoid cells; Interleukin-1β; Interleukin-22.


Figures

Figure 1
Figure 1
Increased susceptibility to chronic colitis in Card9/ mice. Mice were injected with a single dose of AOM, followed by three 5‐day cycles of feeding with DSS, interrupted by periods of normal drinking water. Serum was collected at the indicated time points. (A) The body weight of WT (n = 10) and Card9−/− (n = 8) mice was monitored daily. Data points reflect the average weight per group in percent of initial weight ± S.E.M. (B) Systemic cytokine levels, including TNF, IL‐6, IL‐2 and IL‐1β, were determined in the serum of WT and Card9−/− mice at the indicated time points by cytometric bead array Each symbol represents an individual mouse. Data from one experiment are presented. Small horizontal lines indicate the mean, error bars indicate the S.E.M. * p < 0.05, Student's t‐test. (C) Kaplan–Meier survival curve of WT (n = 10) and Card9−/− (n = 8) mice during the third DSS cycle. Statistical survival analysis was performed using the log‐rank test (p < 0.05). (A, C) Data are from single experiments representative of three independent experiments.
Figure 2
Figure 2
Reduced colitis‐associated tumor growth in Card9/ mice. CAC was induced in WT and Card9−/− mice as described in Fig. 1 using the AOM/DSS model. (A) Representative H&E stains of colonic polyps from AOM/DSS‐treated WT and Card9−/− mice at day 68. (B) The size of the tumors in WT (n = 67) and Card9−/− (n = 33) mice were analyzed histologically at day 68. (C) Number of tumors per mouse in WT (n = 15) and Card9−/− (n = 10) mice were determined histologically. (D) Representative images of BrdU‐incorporation into IECs of the inflamed untransformed epithelium (left) or tumor tissue (right), detected by IHC in the colon of AOM/DSS‐treated WT and Card9−/− mice. BrdU‐incorporation is also quantified as the percentage of BrdU‐positive cells per crypt (bottom). (E) Active cleaved caspase‐3 IHC of the inflamed untransformed epithelium (left) or tumor tissue (right) in the colon of AOM/DSS‐treated WT and Card9−/− mice. The percentage of positive stained pixel/ region of interest (ROI) in the epithelium or tumor tissue is depicted (bottom). (A, D, E) Representative data of at least two independent experiments are shown. (B, C) Data of two independent experiments are pooled and presented as mean + S.E.M of (B, C). * p < 0.05 and *** p < 0.001, Student's t‐test; n.s., not significant; Scale bars represent 100 μm.
Figure 3
Figure 3
Impaired pro‐inflammatory cytokine expression in Card9‐deficient lamina propria leukocytes during colitis. Acute colitis was induced in WT and Card9−/− mice by feeding with DSS for 7 days, followed by 5 days of recovery. (A) Relative expression of Trefoil factor 3 (TFF3), Keratinocyte growth factor (KGF), and IL‐18 mRNA was measured by quantitative PCR and normalized to β‐actin transcript levels in colon tissues of untreated WT (n = 5) and Card9−/− (n = 5), or acute DSS‐treated WT (n = 4) and Card9−/− (n = 4) mice at day 12 of the experiment (DSS). (B) IL‐1β, IL‐17A, IL‐22, and TNF transcript levels in lamina propria leucocytes of untreated WT (n = 5) and Card9−/− (n = 5), or acute DSS‐treated WT (n = 4) and Card9−/− (n = 5) mice at day 12 of the experiment (DSS) were analyzed by qPCR as described above. The data of one representative experiment are shown as the mean + S.E.M of the indicated numbers of samples. * p < 0.05, Student's t‐test; n.s., not significant.
Figure 4
Figure 4
Reduced IL‐22 production by ILC3s in response to acute DSS treatment in the colon of Card9/ mice. Intracellular cytokine levels in ILC subsets were determined by flow cytometry during the recovery phase of acute DSS‐induced colitis. (A‐G) Lamina propria leukocytes were isolated from the colon (A, C, E, G) and small intestine (B, D, F) of untreated WT (n = 4) and Card9−/− (n = 2) mice (untreated), or acute DSS‐treated WT (n = 5) and Card9−/− (n = 7) mice during the recovery phase at day 12 (DSS). Intracellular cytokine levels within ILCs were determined by flow cytometry. (A, B) Percentages of RORγt+IL‐22+ ILCs in the colon (A) and small intestine (B). (C, D) Relative numbers of RORγt+IL‐17+ ILCs in the colon (C) and small intestine (D). (E, F) Percentages of RORγt+IFN‐γ+ ILCs in the colon (E) and small intestine (F). (G) Percentages of T‐bet+CD127+IFN‐γ+ ILCs in the colon. Data of one single experiment are shown as the mean + s.e.m of the indicated number of samples. *p < 0.05, Student's t‐test; n.s., not significant.
Figure 5
Figure 5
Normal ILC function and DC development in the intestine of Card9‐deficient mice. Leukocytes were isolated from the intestinal lamina propria and mesenteric lymph nodes of untreated WT and Card9−/− mice. DC subsets as well as ILC function were analyzed by flow cytometry. (A) Relative expression values of Card9 and Card11 in intestinal FACS‐purified type 2 and type 3 ILC subsets from untreated WT mice were determined by microarray analysis (n = 5). (B, C) Percentages of MHCIIhi (left) and MHCIIhiCD11c+ (right) DCs subdivided into CD103CD11b+, CD103+CD11b, and CD103+CD11b+ DCs in the colonic lamina propria (B) and mesenteric lymph nodes (MLN) (C) of untreated WT (n = 5) and Card9−/− (n = 5) mice were determined by flow cytometry. (D) Relative IL‐23 mRNA expression normalized to β‐actin transcript levels in colonic lamina propria leucocytes from acute DSS‐treated WT (n = 4) and Card9−/− (n = 4) mice at day 12. (E) Percentages of IL‐22‐producing CD4+ (left) or CD4 (right) ILCs that were isolated from the mesenteric lymph nodes (MLN) of untreated WT (n = 3) and Card9−/− (n = 3) mice. MLN cells were either left untreated or restimulated in vitro with IL‐1β, IL‐23 or a combination of IL‐1β and IL‐23 and analyzed by flow cytometry. (B–E) Data from one single experiment are shown as the mean + s.e.m of the indicated number of samples. n.s., not significant, Student's t‐test.
Figure 6
Figure 6
Reduced STAT3 activation in IECs within colonic tumors of Card9/ mice and proposed mechanistic model for Card9 function in CAC. (A) Representative images of phospho‐STAT3 IHC on colon sections from AOM/DSS‐treated WT and Card9−/− mice at day 68. Scale bars represent 100 μm. (B) Percentage of phospho‐STAT3 positive crypt cells/crypt within tumors from WT (n = 10) and Card9−/− (n = 5) mice. Each dot represents one crypt within a tumor as evaluated by histology. (C) Simplified model for Card9 function in intestinal epithelial regeneration and malignancy. For details see main text. (B) Data are shown as the mean + S.E.M of the indicated number of samples and have been pooled from two experiments. *** p < 0.001, Student's t‐test.

References

    1. Beaugerie, L. and Itzkowitz, S. H. , Cancers complicating inflammatory bowel disease. N. Engl. J. Med. 2015. 372: 1441–1452. - PubMed
    1. Zhernakova, A. , Festen, E. M. , Franke, L. , Trynka, G. , van Diemen, C. C. , Monsuur, A. J. , Bevova, M. et al., Genetic analysis of innate immunity in Crohn's disease and ulcerative colitis identifies two susceptibility loci harboring CARD9 and IL18RAP. Am. J. Hum. Genet. 2008. 82: 1202–1210. - PMC - PubMed
    1. Franke, A. , McGovern, D. P. , Barrett, J. C. , Wang, K. , Radford‐Smith, G. L. , Ahmad, T. , Lees, C. W. et al., Genome‐wide meta‐analysis increases to 71 the number of confirmed Crohn's disease susceptibility loci. Nat. Genet. 2010. 42: 1118–1125. - PMC - PubMed
    1. McGovern, D. P. , Gardet, A. , Torkvist, L. , Goyette, P. , Essers, J. , Taylor, K. D. , Neale, B. M. et al., Genome‐wide association identifies multiple ulcerative colitis susceptibility loci. Nat. Genet. 2010. 42: 332–337. - PMC - PubMed
    1. Rivas, M. A. , Beaudoin, M. , Gardet, A. , Stevens, C. , Sharma, Y. , Zhang, C. K. , Boucher, G. et al., Deep resequencing of GWAS loci identifies independent rare variants associated with inflammatory bowel disease. Nat. Genet. 2011. 43: 1066–1073. - PMC - PubMed

MeSH terms