. 2017 Jun 6;13(6):e1005556.
doi: 10.1371/journal.pcbi.1005556. eCollection 2017 Jun.

Fast and general tests of genetic interaction for genome-wide association studies

Affiliations

Fast and general tests of genetic interaction for genome-wide association studies

Mattias Frånberg et al. PLoS Comput Biol. .

Abstract

A complex disease has, by definition, multiple genetic causes. In theory, these causes could be identified individually, but their identification will likely benefit from informed use of anticipated interactions between causes. In addition, characterizing and understanding interactions must be considered key to revealing the etiology of any complex disease. Large-scale collaborative efforts are now paving the way for comprehensive studies of interaction. As a consequence, there is a need for methods with a computational efficiency sufficient for modern data sets as well as for improvements of statistical accuracy and power. Another issue is that, currently, the relation between different methods for interaction inference is in many cases not transparent, complicating the comparison and interpretation of results between different interaction studies. In this paper we present computationally efficient tests of interaction for the complete family of generalized linear models (GLMs). The tests can be applied for inference of single or multiple interaction parameters, but we show, by simulation, that jointly testing the full set of interaction parameters yields superior power and control of false positive rate. Based on these tests we also describe how to combine results from multiple independent studies of interaction in a meta-analysis. We investigate the impact of several assumptions commonly made when modeling interactions. We also show that, across the important class of models with a full set of interaction parameters, jointly testing the interaction parameters yields identical results. Further, we apply our method to genetic data for cardiovascular disease. This allowed us to identify a putative interaction involved in Lp(a) plasma levels between two 'tag' variants in the LPA locus (p = 2.42 ⋅ 10-09) as well as replicate the interaction (p = 6.97 ⋅ 10-07). Finally, our meta-analysis method is used in a small (N = 16,181) study of interactions in myocardial infarction.


Conflict of interest statement

The authors have declared that no competing interests exist.

Figures

Fig 1
Fig 1. Two examples of the construction of bi-variant interaction models as the Kronecker product (⊗) of two uni-variate models.
(a) The construction of the P matrix of the G × G model, (b) The construction of the P matrix of the AD × AD model, (c) the G × G model in bi-variant notation, (d) the AD × AD model in bi-variant notation. For both models, the resulting parameter vector β = (α, β1, β2, γ1, δ11, δ12, γ2, δ21, δ22). In c) and d) a ∈ {0, 1, 2} is the genotype for the first variant and b ∈ {0, 1, 2} is the genotype for the second variant, implicitly β0 = γ0 = δ0* = δ*0 = 0, and, lastly, I(x) is an indicator function taking the value 1 if x is true and 0 otherwise.
Fig 2
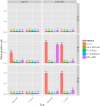
Fig 2. The estimated false positive rate for each test under six different generative models.
Data was generated with all interaction parameters set to zero in this plot. For each subplot, the y-axis indicates the estimated false positive rate and the x-axis indicates the dispersion distribution. The rows correspond to null generative models under three different parameterizations: A × A, R × A and R × D. The columns correspond to two cases, no LD and an LD of 0.8 measured with Lewontin’s D. The colored bars refer to different interaction tests used, as indicated by the legend next to the plots.
Fig 3
Fig 3. The estimated false positive rate under link function misspecification as a function of the second main effect.
The x-axis indicates the effect size of the second main effect under a A × A generative model, while the y-axis indicates the estimated false positive rate. The colored lines correspond to the estimated false positive rate using different interaction tests, as indicated by the legend next to the plots. The black line is the desired 0.05 level. The data was simulated using the log link function, and tested using an identity link.
Fig 4
Fig 4. The statistical power of different testing strategies.
The y-axes is the estimated statistical power, while the x-axis represents the effect size specific to each generative model: δ11 for the A × A model, δ11 = δ12 = δ21 = δ22 for the AD × AD, δ11 = δ12 = δ21 = δ22 for the D × D model, δ11 = δ22 = −δ12 = −δ21 for the D × D failed model, δ11 for the heterozygote model, and δ12 = δ22 for the R × D model. The sample size was 4000 and the minor allele frequency for both variants was 0.3. Notice that the line for the AD × AD joint test in all plots coincide with, and is hidden by, the line for the G × G joint test.
Fig 5
Fig 5. The exceedence distribution of power over all possible interaction generative models with a specific heritability.
For each plot, the x-axis shows a threshold, t, for power to detect an interaction among 1012 variant pairs, and the corresponding y-axis shows the fraction of generative models, for which the analysis have a power greater than or equal to t. The rows correspond to the sample size. The columns correspond to the minor allele frequency of both variants in the pair. The line for the AD × AD joint test is often obscured by the line for the G × G joint test.

References

    1. Mackay TF, Moore JH. Why epistasis is important for tackling complex human disease genetics. Genome Med. 2014;6(6):42 10.1186/gm561 - DOI - PMC - PubMed
    1. Sing CF, Davignon J. Role of the apolipoprotein E polymorphism in determining normal plasma lipid and lipoprotein variation. Am J Hum Genet. 1985;37(2):268–285. - PMC - PubMed
    1. Peacock RE, Temple A, Gudnason V, Rosseneu M, Humphries SE. Variation at the lipoprotein lipase and apolipoprotein AI-CIII gene loci are associated with fasting lipid and lipoprotein traits in a population sample from Iceland: interaction between genotype, gender, and smoking status. Genet Epidemiol. 1997;14(3):265–282. 10.1002/(SICI)1098-2272(1997)14:3%3C265::AID-GEPI5%3E3.0.CO;2-4 - DOI - PubMed
    1. Gyllenberg A, Piehl F, Alfredsson L, Hillert J, Bomfim IL, Padyukov L, et al. Variability in the CIITA gene interacts with HLA in multiple sclerosis. Genes Immun. 2014;15(3):162–167. 10.1038/gene.2013.71 - DOI - PubMed
    1. Kockum I, Sanjeevi CB, Eastman S, Landin-Olsson M, Dahlquist G, Lernmark A. Complex interaction between HLA DR and DQ in conferring risk for childhood type 1 diabetes. Eur J Immunogen. 1999;26(5):361–372. 10.1046/j.1365-2370.1999.00173.x - DOI - PubMed