

Synthesis and biochemical characterization of EGF receptor in a water-soluble membrane model system
- PMID: 28586369
- PMCID: PMC5460842
- DOI: 10.1371/journal.pone.0177761
Synthesis and biochemical characterization of EGF receptor in a water-soluble membrane model system
Abstract
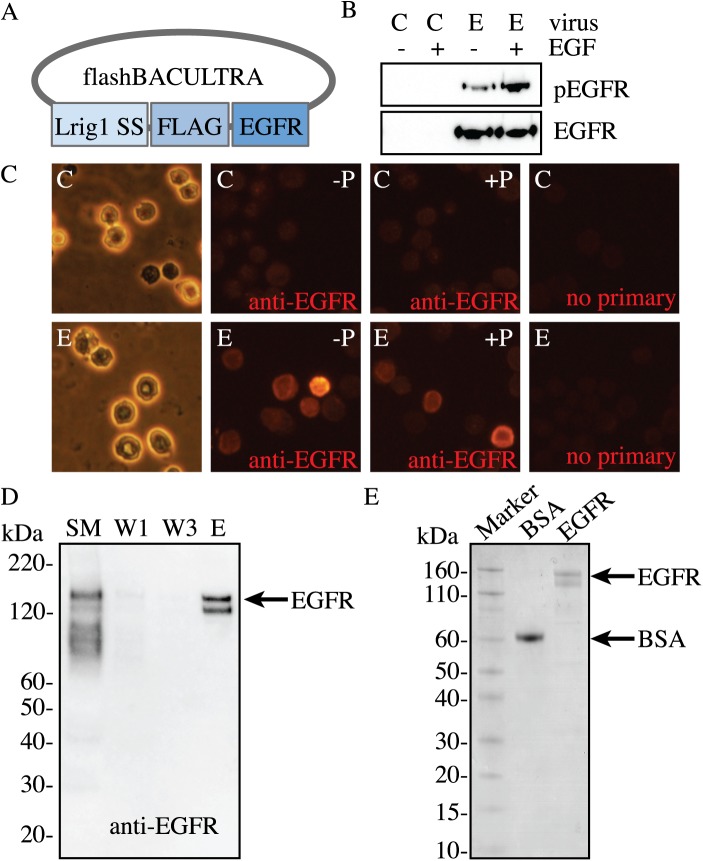
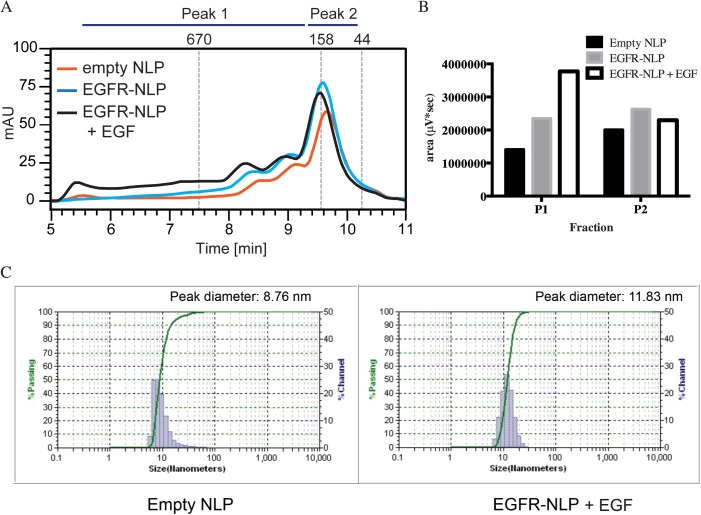
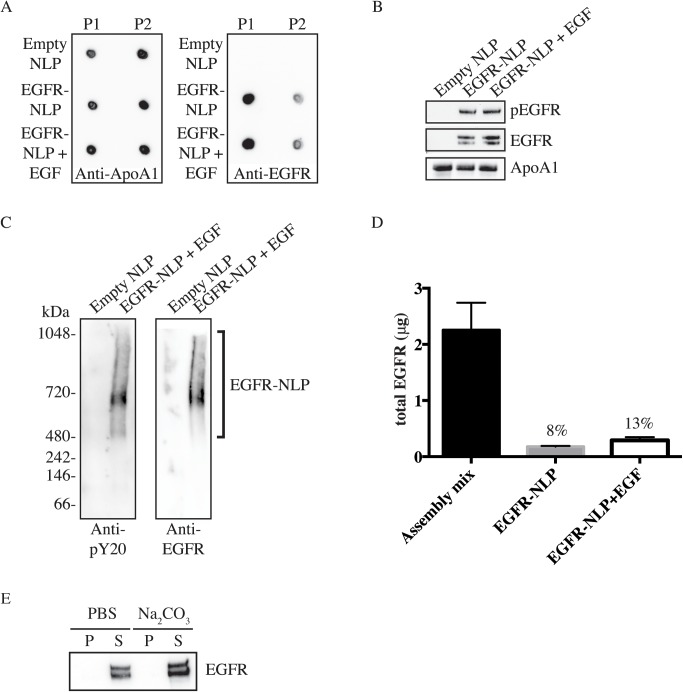
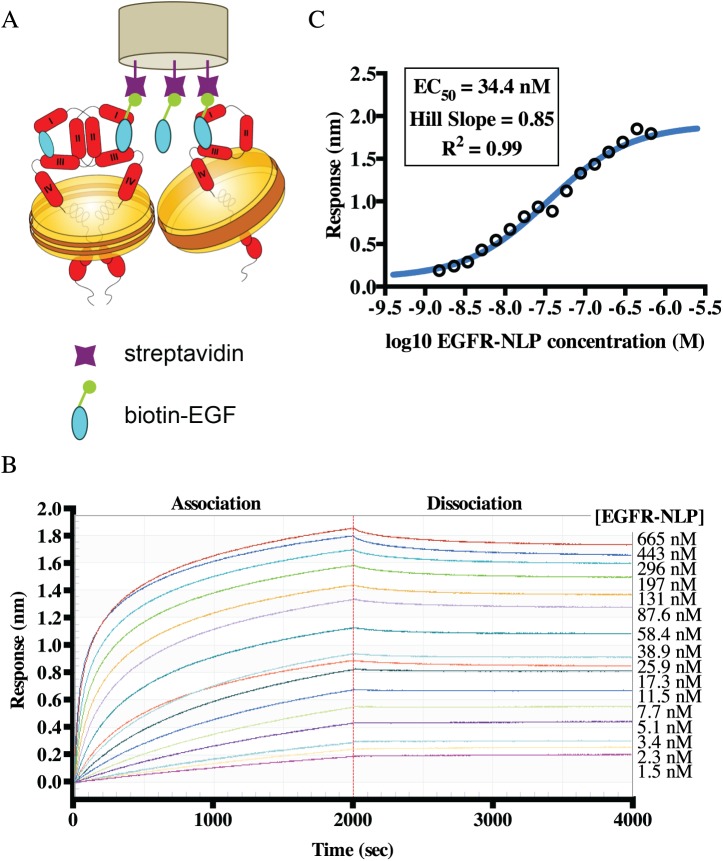
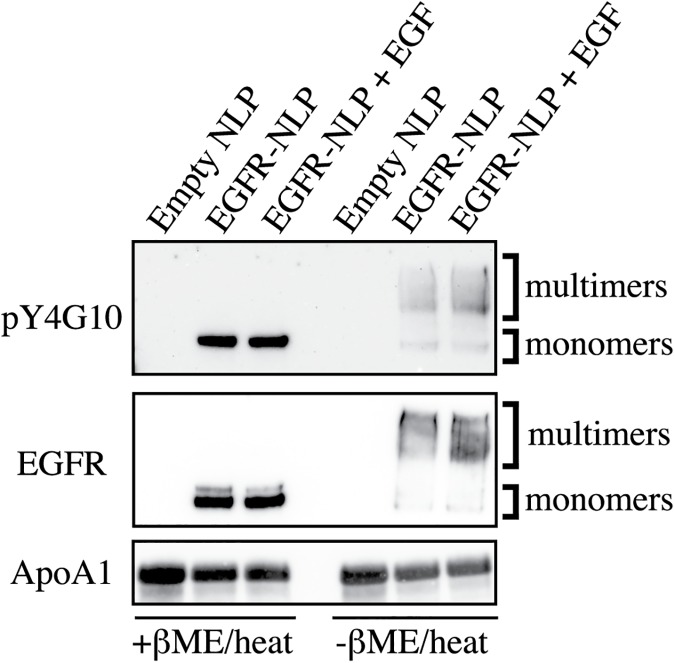
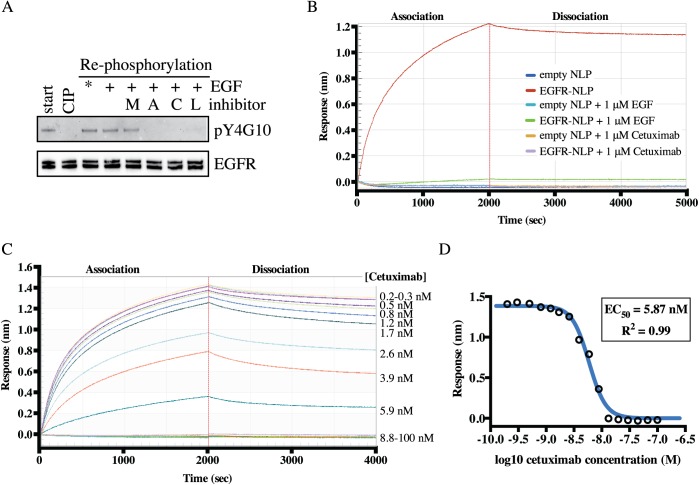
ErbB (Erythroblastic Leukemia Viral Oncogene Homolog) receptor tyrosine kinases are critical for tissue development and maintenance, and frequently become oncogenic when mutated or overexpressed. In vitro analysis of ErbB receptor kinases can be difficult because of their large size and poor water solubility. Here we report improved production and assembly of the correctly folded full-length EGF receptor (EGFR) into nanolipoprotein particles (NLPs). NLPs are ~10 nm in diameter discoidal cell membrane mimics composed of apolipoproteins surrounding a lipid bilayer. NLPs containing EGFR were synthesized via incubation of baculovirus-produced recombinant EGFR with apolipoprotein and phosphoplipids under conditions that favor self-assembly. The resulting EGFR-NLPs were the correct size, formed dimers and multimers, had intrinsic autophosphorylation activity, and retained the ability to interact with EGFR-targeted ligands and inhibitors consistent with previously-published in vitro binding affinities. We anticipate rapid adoption of EGFR-NLPs for structural studies of full-length receptors and drug screening, as well as for the in vitro characterization of ErbB heterodimers and disease-relevant mutants.
Conflict of interest statement
Figures
Similar articles
-
Integral membrane protein fragment recombination after transfer from nanolipoprotein particles to bicelles.Biochemistry. 2013 Dec 31;52(52):9405-12. doi: 10.1021/bi401391c. Epub 2013 Dec 18. Biochemistry. 2013. PMID: 24328096
-
Hydrogen production by a hyperthermophilic membrane-bound hydrogenase in water-soluble nanolipoprotein particles.J Am Chem Soc. 2009 Jun 10;131(22):7508-9. doi: 10.1021/ja809251f. J Am Chem Soc. 2009. PMID: 19449869
-
Characterization and purification of polydisperse reconstituted lipoproteins and nanolipoprotein particles.Int J Mol Sci. 2009 Jul 2;10(7):2958-2971. doi: 10.3390/ijms10072958. Int J Mol Sci. 2009. PMID: 19742178 Free PMC article.
-
Epidermal growth factor receptor (EGFR) signaling in cancer.Gene. 2006 Jan 17;366(1):2-16. doi: 10.1016/j.gene.2005.10.018. Epub 2005 Dec 27. Gene. 2006. PMID: 16377102 Review.
-
The ErbB/HER family of protein-tyrosine kinases and cancer.Pharmacol Res. 2014 Jan;79:34-74. doi: 10.1016/j.phrs.2013.11.002. Epub 2013 Nov 20. Pharmacol Res. 2014. PMID: 24269963 Review.
Cited by
-
Single-Molecule Fluorescence Detection of the Epidermal Growth Factor Receptor in Membrane Discs.Biochemistry. 2019 Jan 29;58(4):286-294. doi: 10.1021/acs.biochem.8b00089. Epub 2018 Apr 6. Biochemistry. 2019. PMID: 29553754 Free PMC article.
-
Lipid and Protein Transfer between Nanolipoprotein Particles and Supported Lipid Bilayers.Langmuir. 2019 Sep 17;35(37):12071-12078. doi: 10.1021/acs.langmuir.9b01288. Epub 2019 Sep 6. Langmuir. 2019. PMID: 31442053 Free PMC article.
-
Cell-Free Co-Translational Approaches for Producing Mammalian Receptors: Expanding the Cell-Free Expression Toolbox Using Nanolipoproteins.Front Pharmacol. 2019 Jul 3;10:744. doi: 10.3389/fphar.2019.00744. eCollection 2019. Front Pharmacol. 2019. PMID: 31333463 Free PMC article. Review.
References
-
- Lemmon MA. Ligand-induced ErbB receptor dimerization. Exp Cell Res. 2009;315(4): 638–648. doi: 10.1016/j.yexcr.2008.10.024 - DOI - PMC - PubMed
-
- Burgess AW, Cho HS, Eigenbrot C, Ferguson KM, Garrett TP, Leahy DJ, et al. An open-and-shut case? Recent insights into the activation of EGF/ErbB receptors. Mol Cell. 2003;12(3): 541–552. - PubMed
-
- Carraway KL 3rd, Cantley LC. A neu acquaintance for erbB3 and erbB4: a role for receptor heterodimerization in growth signaling. Cell. 1994;78(1): 5–8. - PubMed
-
- Alroy I, Yarden Y. The ErbB signaling network in embryogenesis and oncogenesis: signal diversification through combinatorial ligand-receptor interactions. FEBS Lett. 1997;410(1): 83–86. - PubMed
-
- Riese DJ 2nd, Stern DF. Specificity within the EGF family/ErbB receptor family signaling network. Bioessays. 1998;20(1): 41–48. doi: 10.1002/(SICI)1521-1878(199801)20:1<41::AID-BIES7>3.0.CO;2-V - DOI - PubMed
MeSH terms
Substances
Grants and funding
LinkOut - more resources
Full Text Sources
Other Literature Sources
Research Materials
Miscellaneous
