. 2017 Jun 15;68(13):3391-3403.
doi: 10.1093/jxb/erx184.

FRUITFULL controls SAUR10 expression and regulates Arabidopsis growth and architecture

Affiliations

FRUITFULL controls SAUR10 expression and regulates Arabidopsis growth and architecture

Marian Bemer et al. J Exp Bot. .

Abstract

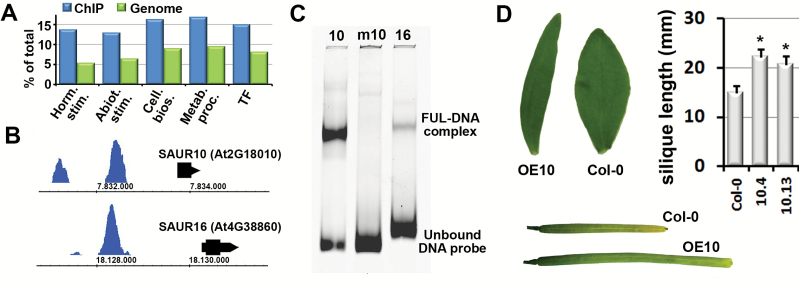
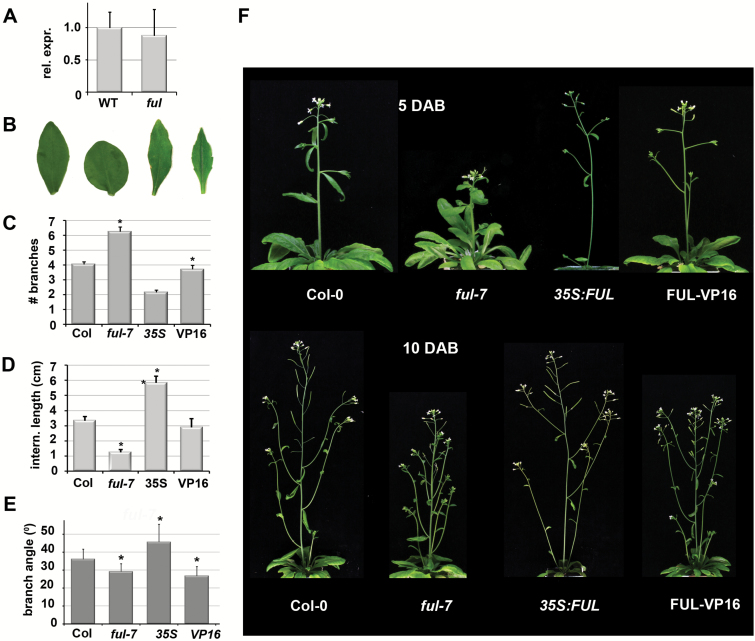
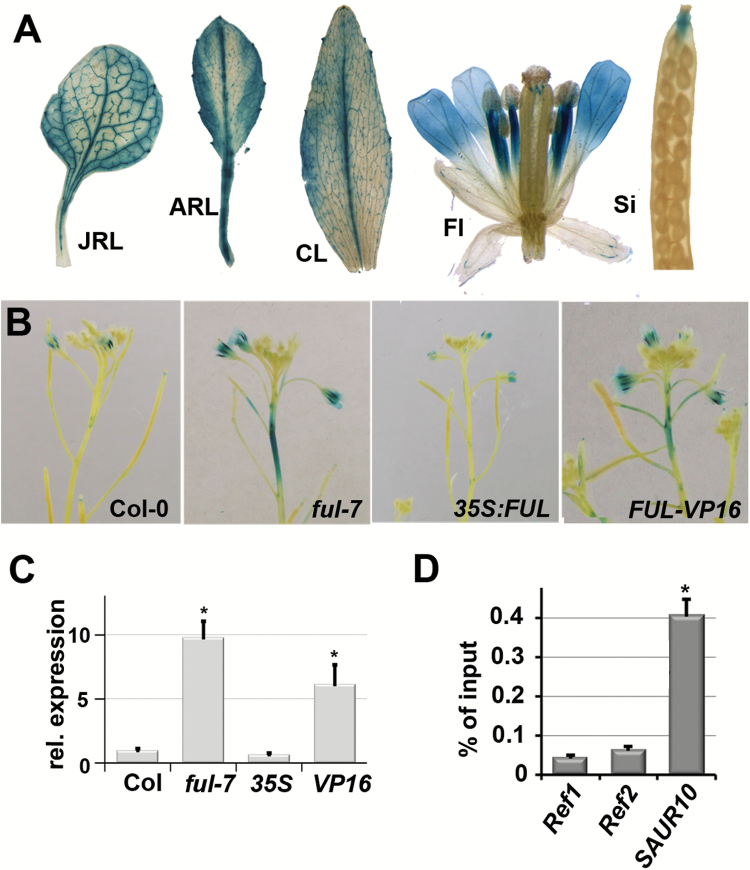
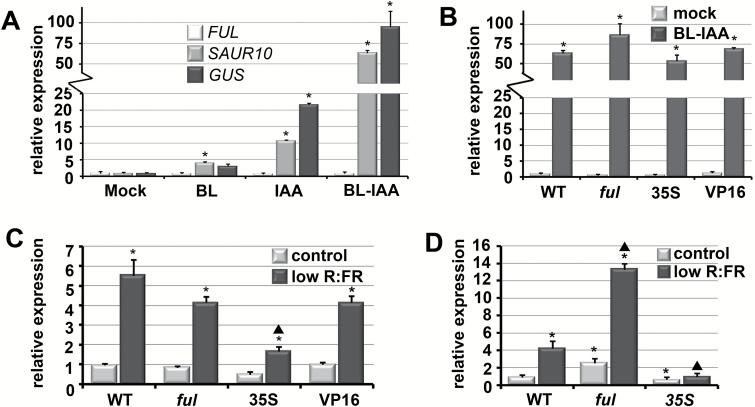
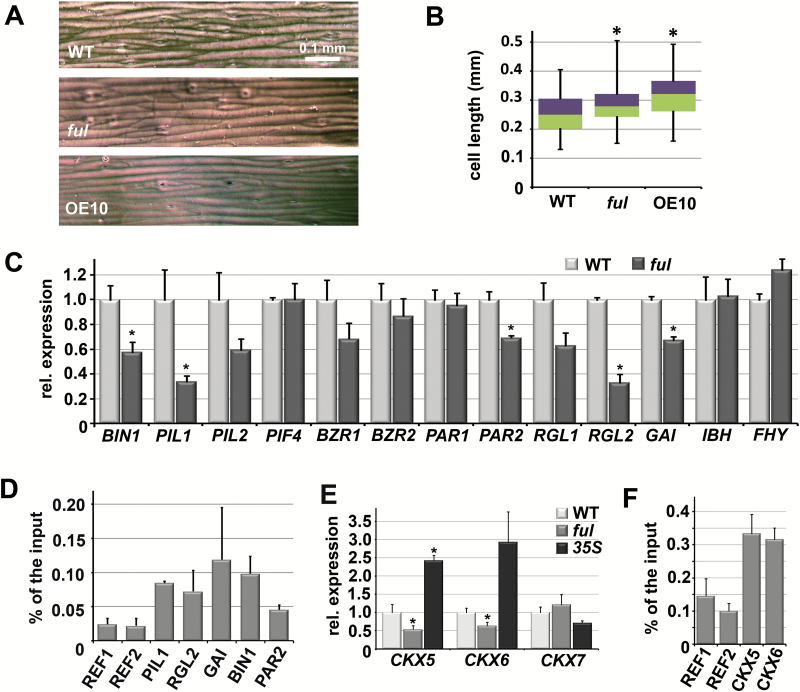
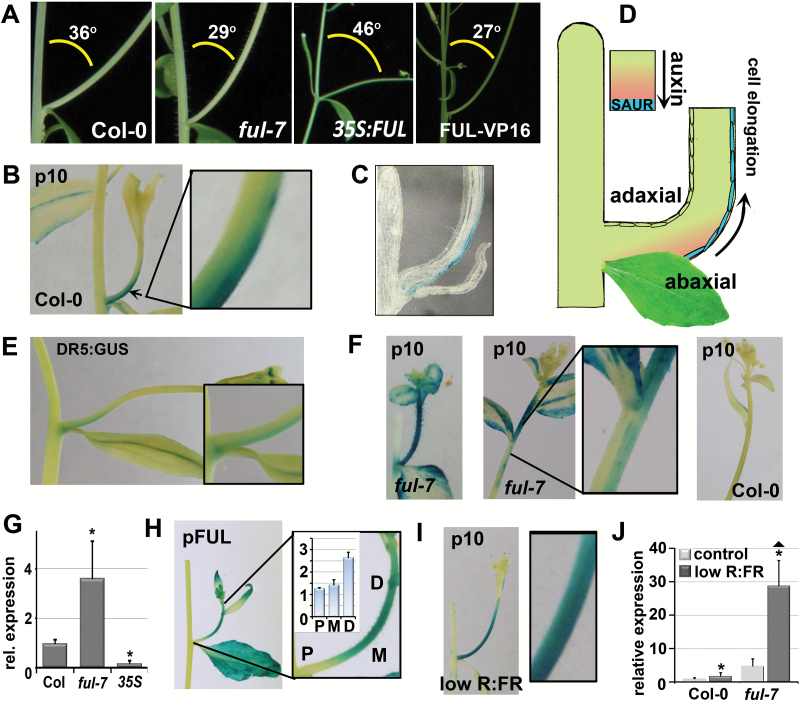
MADS-domain transcription factors are well known for their roles in plant development and regulate sets of downstream genes that have been uncovered by high-throughput analyses. A considerable number of these targets are predicted to function in hormone responses or responses to environmental stimuli, suggesting that there is a close link between developmental and environmental regulators of plant growth and development. Here, we show that the Arabidopsis MADS-domain factor FRUITFULL (FUL) executes several functions in addition to its noted role in fruit development. Among the direct targets of FUL, we identified SMALL AUXIN UPREGULATED RNA 10 (SAUR10), a growth regulator that is highly induced by a combination of auxin and brassinosteroids and in response to reduced R:FR light. Interestingly, we discovered that SAUR10 is repressed by FUL in stems and inflorescence branches. SAUR10 is specifically expressed at the abaxial side of these branches and this localized activity is influenced by hormones, light conditions and by FUL, which has an effect on branch angle. Furthermore, we identified a number of other genes involved in hormone pathways and light signalling as direct targets of FUL in the stem, demonstrating a connection between developmentally and environmentally regulated growth programs.

Keywords: Architecture; FRUITFULL; MADS-box transcription factor; SAUR; auxin; branching; growth; hormones; light response.


Figures

Fig. 1.
Fig. 1.
FUL binds many genes involved in hormone pathways, including SAUR10 and SAUR16. (A) Graph showing gene ontology categories in which the FUL targets are significantly over-represented. The y-axis indicates the percentage of genes belonging to this ontology category. A generic GO term finder was used for the analysis (http://go.princeton.edu/cgi-bin/GOTermFinder). The bars represent from left to right: i) response to hormones; ii) response to abiotic stimulus; iii) regulation of cellular biosynthetic process; iv) regulation of primary metabolic process; and v) regulation of transcription, DNA-templated. (B) FUL binding peaks in the upstream regions of SAUR10 (top) and SAUR16 (bottom). (C) Binding of the FUL homodimer to different DNA probes in an EMSA assay. Lane 1, SAUR10 promoter fragment; Lane 2, SAUR10 promoter fragment with mutated CArG box; Lane 3, SAUR16 promoter fragment. (D) The overexpression phenotypes of the 35S:SAUR10 lines include longer siliques (picture stage 17B siliques) and differently shaped cauline leaves. See Supplementary Fig. S4 for additional phenotypes. Significant differences from the wild-type (Student’s t-test, P<0.05) are indicated with an asterisk.
Fig. 2.
Fig. 2.
FUL is a pleiotropic regulator of plant growth and architecture. (A) Expression of SAUR10 in wild-type and ful-7 siliques from stages 12–16. (B) Cauline leaf phenotypes of Col-0, ful-7, 35S:FUL, and FUL-VP16 leaves (from left to right). (C) The number of branches formed along the main inflorescence. (D) Average internode length between the branches in plants at 10 DAB. (E) Average branch angle of all side branches along the primary stem of plants around 12 DAB. (F) Architecture phenotypes of Col-0, ful-7, 35S:FUL, and FUL-VP16 plants at 5 DAB (upper panel) and 10 DAB (lower panel). In (A), the error bars represent the SE based on two biological replicas. In (C–E), the error bars represent the SE based on at least 20 measurements. Significant differences from the control (Student’s t-test, P<0.05) are indicated with an asterisk.
Fig. 3.
Fig. 3.
SAUR10 is regulated by FUL in stems. (A) GUS staining pattern in different organs and tissues of a pSAUR10:GUS line. JRL, juvenile rosette leaf; ARL, adult rosette leaf; CL, fully expanded cauline leaf; Fl, flower stage 13; Si, silique stage 17. (B) GUS staining pattern of pSAUR10:GUS inflorescence stems from different FUL backgrounds. (C) Relative expression of SAUR10 in the upper stem segment of Col-0, ful-7, 35S:FUL, and FUL-VP16 plants 8–10 DAB. (D) Graph from a ChIP-qPCR experiment showing the enrichment of the SAUR10 fragment relative to two reference sequences in a ChIP sample from stem tissue. The enrichment of the fragments was calculated as a percentage of the input sample. Error bars represent the SE of three biological replicas in the case of expression analyses, and two replicas for the ChIP-PCR. Significant differences from the control (Student’s t-test, P<0.05) are indicated with an asterisk.
Fig. 4.
Fig. 4.
SAUR10 is induced by a combination of BRs and auxin, and by reduced R:FR ratios, which can be repressed by FUL in the stem. (A) Expression of SAUR10, GUS (in pSAUR10:GUS lines) and FUL in 10 day-old seedlings after a 4 h treatment with auxin (IAA), BRs (BL) or a combination of both (BL-IAA). (B) Expression of SAUR10 in 10 day-old Col-0, ful-7, 35S:FUL, and FUL-VP16 seedlings after a 4 h treatment with a combination of auxin and BRs (BL-IAA). (C) Expression of SAUR10 in Col-0, ful-7, 35S:FUL, and FUL-VP16 12 day-old seedlings grown for 4 h under reduced R:FR light conditions or under control conditions. (D) Expression of SAUR10 in Col-0, ful-7, 35S:FUL, and FUL-VP16 stems 7 DAB, grown for 4 h under reduced R:FR light conditions or under control conditions. The error bars represent the SE of three biological replicas. In (A) and (B), significant differences from the mock control (Student’s t-test, P<0.05) are indicated with an asterisk. In (C) and (D), significant differences from the wild-type control situation (Student’s t-test, P<0.05) are indicated with an asterisk, while significant differences from the wild-type low R:FR situation are indicated with a triangle.
Fig. 5.
Fig. 5.
The ful mutant stem phenotype is due to a combination of de-regulated genes. (A) Prints of stem segments between internode 1 and 2 from wild-type, ful-7, and 35S:SAUR10 stems. The scale bar represents 0.1 mm. (B) Boxplot showing the cell lengths of the stem segments such as in panel (A). The distribution of the lengths is depicted as follows: purple, upper quartile; green, lower quartile; upper error bar, maximum; lower error bar, minimum. Cell lengths were measured with ImageJ and based on at least 40 cells from three different stem segments. (C) Relative expression of a number of genes from the ChIP-seq target list in wild-type and ful-7 stems. (D) Graph from a ChIP-qPCR experiment showing the enrichment of the PIL1, RGL2, RGA2, and BIN1 fragments relative to two reference sequences in a ChIP sample from stem tissue. The enrichment of the fragments was calculated as a percentage from the input sample. (E) Relative expression of CKX5, CKX6 and CKX7 in the upper stem segment of wild-type, ful-7, and 35S:FUL inflorescences. The significance of the differential expression in the ful-7 samples compared to the wild-type was calculated based on five biological replicates. (F) Graph from a ChIP-qPCR experiment showing the enrichment of the CKX5 and CKX6 fragments relative to two reference sequences in a ChIP sample from stem tissue. The enrichment of the fragments was calculated as a percentage of the input sample. Error bars represent the SE of three biological replicas in the case of expression analyses. Significant differences from the control (Student’s t-test, P<0.05) are indicated with an asterisk. Two replicas were performed for the ChIP-PCR. (This figure is available in colour at JXB online)
Fig. 6.
Fig. 6.
The branch angle phenotype of the ful mutant correlates with specific abaxial expression of SAUR10 in branches. (A) Pictures showing the relation between branch angle and plant architecture in the different FUL backgrounds. The smaller the angle, the more vertical the branches grow. The average branch angle in the different backgrounds is indicated. (B) Localization of pSAUR10:GUS at the abaxial side of a young branch. The arrow points to the region that was enlarged. (C) Cross-section of a pSAUR10:GUS branch. (D) Model showing the correlation between auxin-induced accumulation of growth factors, SAURs, at the abaxial side and branch bending. (E) Localization of DR5:GUS at the abaxial side of the branch. (F) Expression and localization of pSAUR10:GUS in the branches of Col-0 and ful-7. Left panel: pSAUR10:GUS can be observed on both sides of emerging ful-7 branches. The middle and right panels show older, elongating branches, where no signal is visible any more at the proximal part near the primary stem, but a difference in the distal part can be observed. pSAUR10:GUS is clearly visible in the distal region of elongating ful-7 branches, and is specifically abaxially expressed directly below that region (middle panel), whereas pSAUR10:GUS is not visible in the distal region of elongating older Col-0 branches (right panel). (G) Relative transcript levels of SAUR10 in young branches from different FUL backgrounds. (H) FUL is highly expressed throughout branches, with the highest expression in the distal region. P, proximal region; M, middle region; D, distal region. (I) Localization of pSAUR10:GUS on both sides of branches grown under reduced R:FR light conditions. (J) Relative transcript levels of SAUR10 in Col-0 and ful-7 branches under control conditions and reduced R:FR light conditions. p10, pictures from pSAUR10:GUS stained tissue; pFUL, pictures from pFUL:GUS stained tissue. The error bars depict the SE based on three biological replicas. Significant differences (Student’s t-test, P<0.05) are indicated with an asterisk.

Similar articles

Cited by

References

    1. Atamian HS, Creux NM, Brown EA, Garner AG, Blackman BK, Harmer SL. 2016. Circadian regulation of sunflower heliotropism, floral orientation, and pollinator visits. Science 353, 587–590. - PubMed
    1. Bai MY, Shang JX, Oh E, Fan M, Bai Y, Zentella R, Sun TP, Wang ZY. 2012. Brassinosteroid, gibberellin and phytochrome impinge on a common transcription module in Arabidopsis. Nature Cell Biology 14, 810–817. - PMC - PubMed
    1. Bargmann BO, Vanneste S, Krouk G, et al. 2013. A map of cell type-specific auxin responses. Molecular Systems Biology 9, 688. - PMC - PubMed
    1. Bartrina I, Otto E, Strnad M, Werner T, Schmülling T. 2011. Cytokinin regulates the activity of reproductive meristems, flower organ size, ovule formation, and thus seed yield in Arabidopsis thaliana. The Plant Cell 23, 69–80. - PMC - PubMed
    1. Bemer M, van Mourik H, Muiño JM, Ferrándiz C, Kaufmann K, Angenent GC. 2017. Data from: FRUITFULL controls SAUR10 expression and regulates Arabidopsis growth and architecture. Gene Expression Omnibus. https://www.ncbi.nlm.nih.gov/geo/query/acc.cgi?acc=GSE79554 - PMC - PubMed

Publication types

MeSH terms