. 2017 May 25;18(6):1132.
doi: 10.3390/ijms18061132.

Prostaglandin E2-Induced COX-2 Expressions via EP2 and EP4 Signaling Pathways in Human LoVo Colon Cancer Cells

Affiliations

Prostaglandin E2-Induced COX-2 Expressions via EP2 and EP4 Signaling Pathways in Human LoVo Colon Cancer Cells

Hsi-Hsien Hsu et al. Int J Mol Sci. .

Abstract

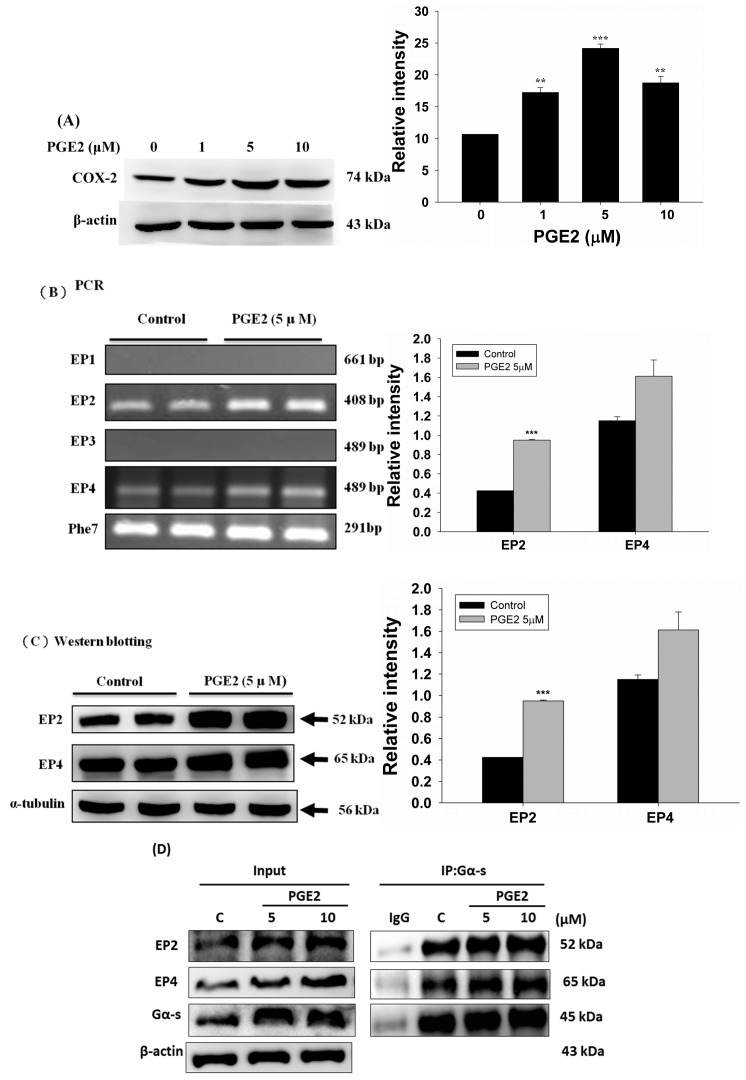
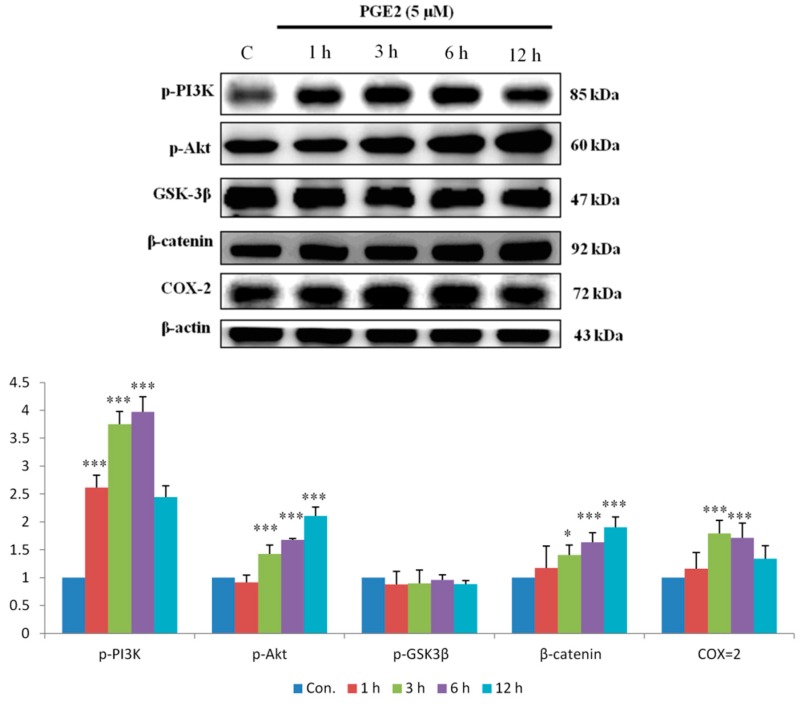
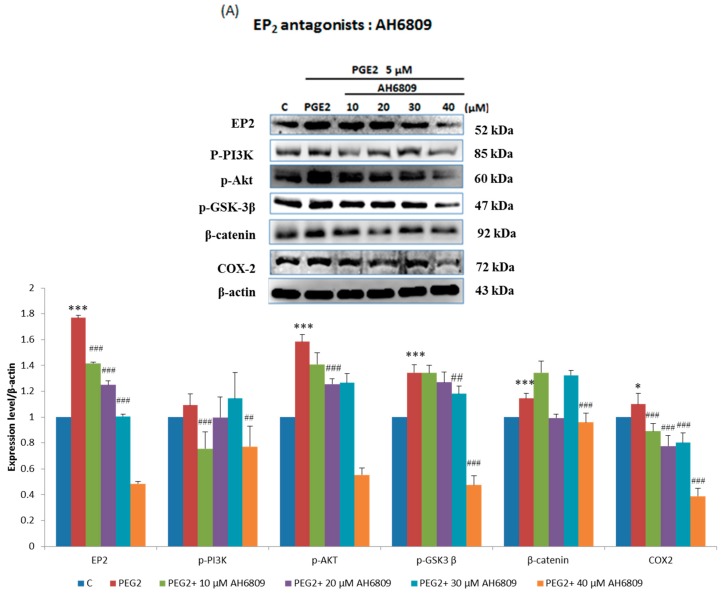
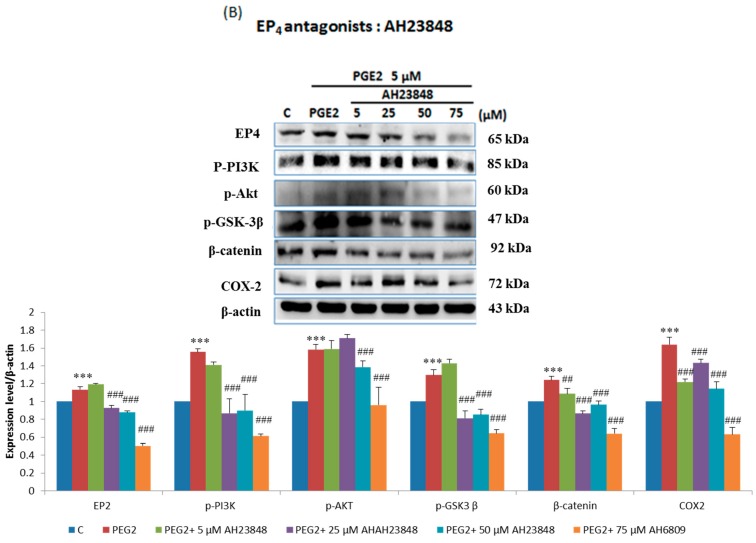
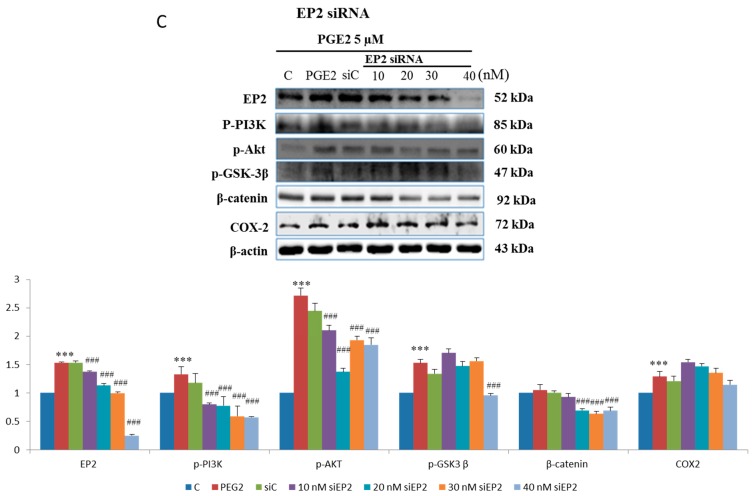
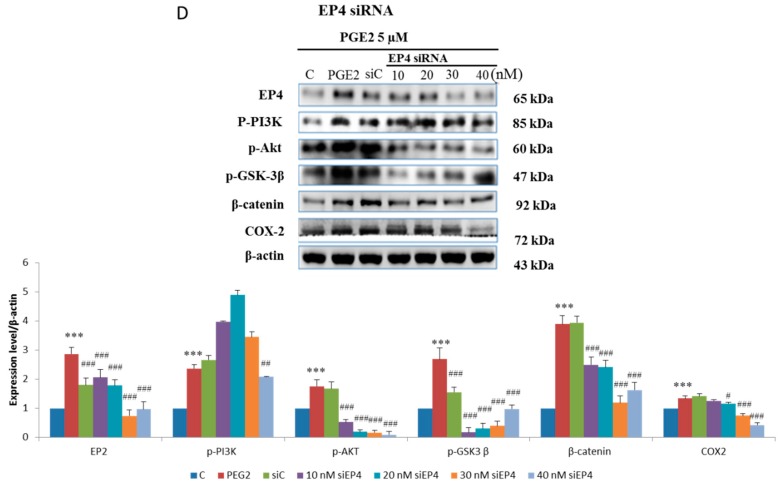
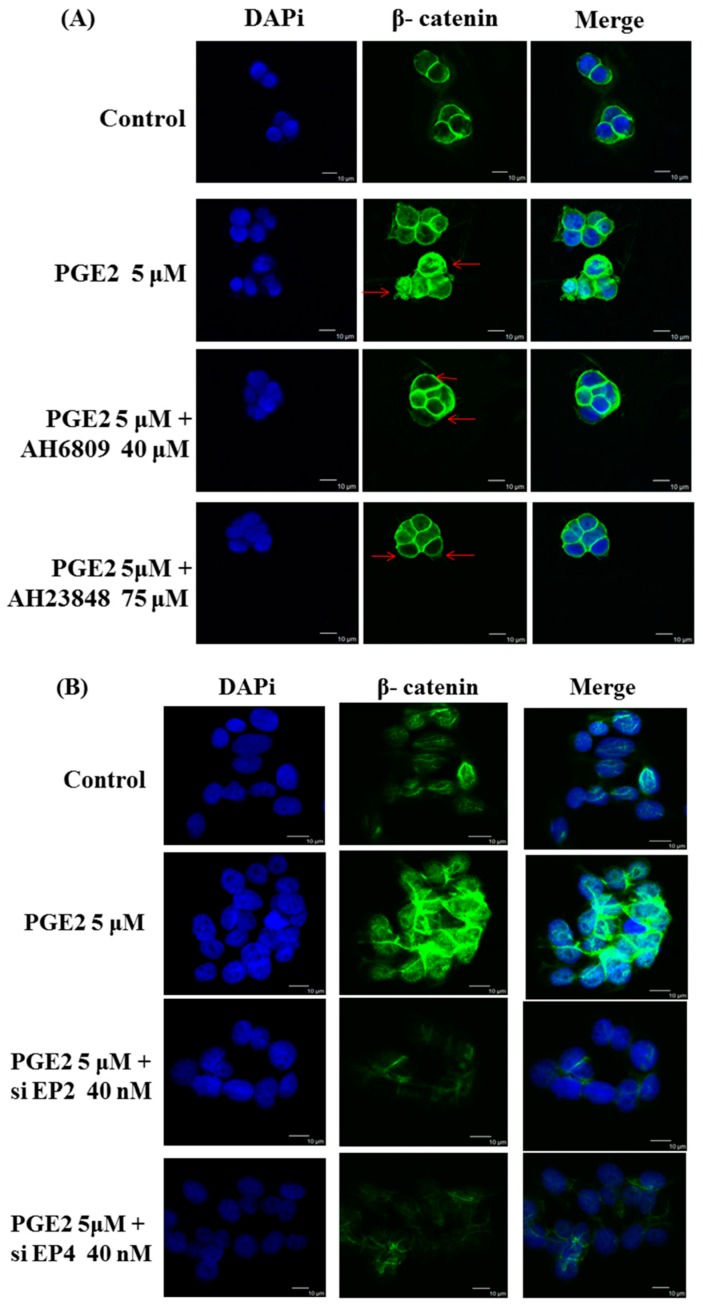
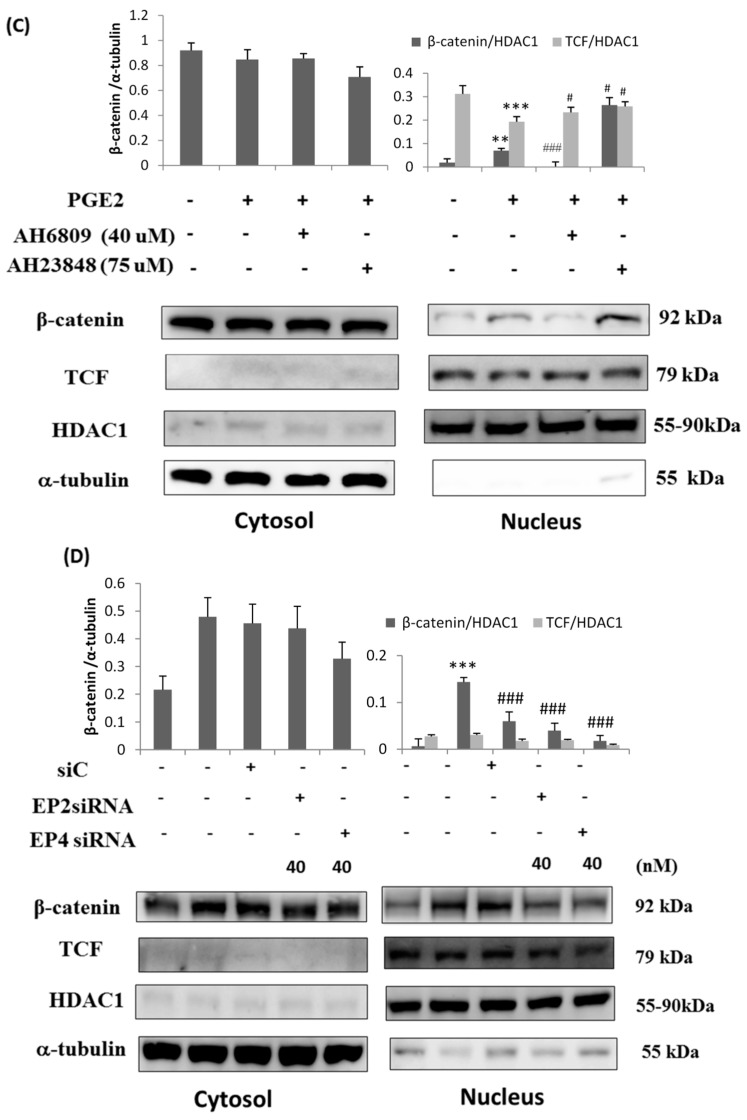
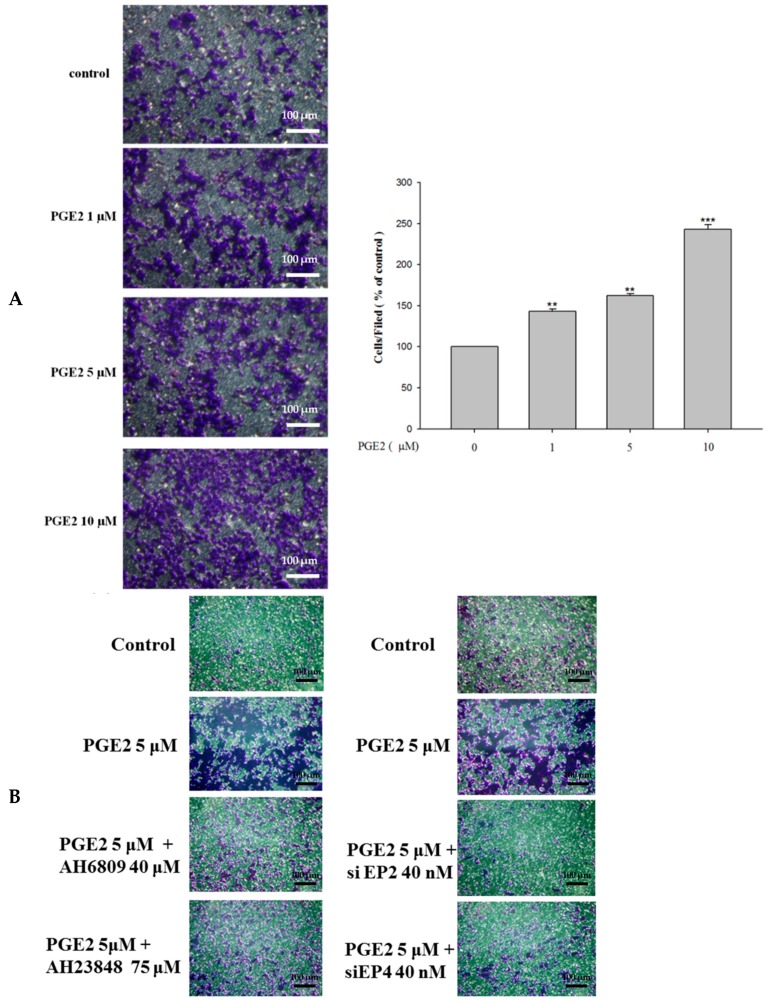
Metastasis is the most dangerous risk faced by patients with hereditary non-polyposis colon cancer (HNPCC). The expression of matrix metalloproteinases (MMPs) has been observed in several types of human cancers and regulates the efficacy of many therapies. Here, we show that treatment with various concentrations of prostaglandin E2 (PGE2; 0, 1, 5 or 10 μM) promotes the migration ability of the human LoVo colon cancer cell line. As demonstrated by mRNA and protein expression analyses, EP2 and EP4 are the major PGE2 receptors expressed on the LoVo cell membrane. The Phosphatidylinositol-4,5-bisphosphate 3-kinase (PI3K)/Akt cell survival pathway was upregulated by EP2 and EP4 activation. Following the activation of the PI3K/Akt pathway, β-catenin translocated into the nucleus and triggered COX2 transcription via LEF-1 and TCF-4 and its subsequent translation. COX2 expression correlated with the elevation in the migration ability of LoVo cells. The experimental evidence shows a possible mechanism by which PGE2 induces cancer cell migration and further suggests PGE2 to be a potential therapeutic target in colon cancer metastasis. On inhibition of PGE2, in order to determine the downstream pathway, the levels of PI3K/Akt pathway were suppressed and the β-catenin expression was also modulated. Inhibition of EP2 and EP4 shows that PGE2 induces protein expression of COX-2 through EP2 and EP4 receptors in LoVo colon cancer cells.

Keywords: COX-2; EP2 and EP4 receptors; hereditary non-polyposis colon cancer (HNPCC); prostaglandin E2 (PGE2); β-catenin.


Conflict of interest statement

The authors declare no conflict of interest.

Figures

Figure 1
Figure 1
Prostaglandin E2 (PGE2) induces protein expression of COX-2 through EP2 and EP4 in LoVo cells. (A) LoVo cells were treated with increasing concentrations of PGE2 (0, 1, 5 and 10 μM) for 6 h, and cells were then harvested and lysed. Cell extracts were separated by 12% sodium dodecyl sulfate polyacrylamide gel electrophoresis (SDS-PAGE), transferred to polyvinylidene difluoride (PVDF) membranes, and immunoblotted with an antibody against COX-2. (B) LoVo cells were treated with 5 μM PGE2 for 6 h. The expression of EP1–4 in LoVo cells was detected by reverse-transcription PCR. (C) LoVo cells were treated with 5 μM PGE2 for 6 h. Cells were harvested and analyzed for expression of EP2 and EP4 by immunoblot. (D) LoVo cells were pretreated with PGE2 (5 or 10 μM) for 6 h and then harvested for immunoblot analysis using antibodies against Gα-s, EP2 and EP4. A co-immunoprecipitation assay was used to determine the degree of association of Gα-s with EP2 or EP4. An antibody against Gα-s was used for the immunoprecipitation, while antibodies against Gα-s, EP2 and EP4 were used for the immunoblot analysis. ** p < 0.01, *** p < 0.001 denotes significant differences from control values. The results were presented as the mean ± standard deviation (SD) of three difference experiments.
Figure 2
Figure 2
PGE2 promotes the expression of Phosphatidylinositol-4,5-bisphosphate 3-kinase PI3K, Akt, p-GSK3β, β-catenin and COX-2 proteins in LoVo cells. LoVo cells were treated with 5 μM PGE2 for 1, 3, 6 and 12 h. Cells were harvested and lysed at the indicated time points. Cell extracts were separated by 12% SDS-PAGE, transferred to PVDF membranes, and immunoblotted with antibodies against PI3K, Akt, p-GSK3β, β-catenin and COX2. The expression of these downstream proteins exhibited an increasing trend with longer PGE2 treatment times. * p < 0.05, *** p < 0.001 denotes significant differences from control values. The results were presented as the mean ± SD of three difference experiments.
Figure 3
Figure 3
Effect of inhibitors on protein expression in PGE2-treated LoVo cells. LoVo cells were pretreated with either (A) the EP2 antagonist AH6809 or (B) the EP4 antagonist AH23848 for 21 h and then treated with 5 μM PGE2 for 24 h, or pretreated with either (C) EP2 small interfering RNA (siRNA) or (D) EP4 siRNA for 42 h and then treated with 5 μM PGE2 for 48 h. Cells were then harvested and analyzed by immunoblot using antibodies against p-PI3K, p-Akt, p-GSK3β, β-catenin and COX2 to determine the effect of PGE2 inhibition on protein expression. * p < 0.05, *** p < 0.001 denotes significant differences from control values # p < 0.05, ## p < 0.01 and ### p < 0.001 denote significant differences when compared to PGE2-treated groups. The results were presented as the mean ± SD of three difference experiments.
Figure 3
Figure 3
Effect of inhibitors on protein expression in PGE2-treated LoVo cells. LoVo cells were pretreated with either (A) the EP2 antagonist AH6809 or (B) the EP4 antagonist AH23848 for 21 h and then treated with 5 μM PGE2 for 24 h, or pretreated with either (C) EP2 small interfering RNA (siRNA) or (D) EP4 siRNA for 42 h and then treated with 5 μM PGE2 for 48 h. Cells were then harvested and analyzed by immunoblot using antibodies against p-PI3K, p-Akt, p-GSK3β, β-catenin and COX2 to determine the effect of PGE2 inhibition on protein expression. * p < 0.05, *** p < 0.001 denotes significant differences from control values # p < 0.05, ## p < 0.01 and ### p < 0.001 denote significant differences when compared to PGE2-treated groups. The results were presented as the mean ± SD of three difference experiments.
Figure 4
Figure 4
Prostaglandin E2 (PGE2) treatment caused the translocation of β-catenin from the cytosol to the nucleus in LoVo cell. LoVo cells were pretreated with (A) the EP2 antagonist AH6809 or the EP4 antagonist AH23848 or (B) EP2 siRNA or EP4 siRNA, and then treated with PGE2 (5 μM). Immunofluorescence assays were performed in LoVo cells using an antibody against β-catenin (1:250, green stain, Red arrows) followed by 4′,6-diamidino-2-phenylindole DAPI nuclear counterstaining (blue). The merged images of β-catenin (green) with DAPI (blue) are also shown. In addition, the cytosolic and nuclear proteins were isolated from LoVo cells pretreated with (C) the EP2 antagonist AH6809 or the EP4 antagonist AH23848 or (D) EP2- or EP4-specific siRNA and treated with PGE2 (5 μM). The expression of β-catenin, LEF-1, TCF-4 and HDAC1 was detected by immunoblot assay. ** p < 0.01 and *** p < 0.001 denotes significant differences from control values # p < 0.05 and ### p < 0.001 denote significant differences when compared to PGE2 treated groups. The results were presented as the mean ± SD of three difference experiments.
Figure 4
Figure 4
Prostaglandin E2 (PGE2) treatment caused the translocation of β-catenin from the cytosol to the nucleus in LoVo cell. LoVo cells were pretreated with (A) the EP2 antagonist AH6809 or the EP4 antagonist AH23848 or (B) EP2 siRNA or EP4 siRNA, and then treated with PGE2 (5 μM). Immunofluorescence assays were performed in LoVo cells using an antibody against β-catenin (1:250, green stain, Red arrows) followed by 4′,6-diamidino-2-phenylindole DAPI nuclear counterstaining (blue). The merged images of β-catenin (green) with DAPI (blue) are also shown. In addition, the cytosolic and nuclear proteins were isolated from LoVo cells pretreated with (C) the EP2 antagonist AH6809 or the EP4 antagonist AH23848 or (D) EP2- or EP4-specific siRNA and treated with PGE2 (5 μM). The expression of β-catenin, LEF-1, TCF-4 and HDAC1 was detected by immunoblot assay. ** p < 0.01 and *** p < 0.001 denotes significant differences from control values # p < 0.05 and ### p < 0.001 denote significant differences when compared to PGE2 treated groups. The results were presented as the mean ± SD of three difference experiments.
Figure 5
Figure 5
PGE2 can efficiently promote the migration ability of LoVo cells. (A) LoVo cells were pretreated with increasing concentrations of PGE2 (0, 1, 5 and 10 μM) for 6 h. Cells were harvested and migration ability was subsequently evaluated by a migration assay. (B) The use of antagonists or siRNA reduces the migration ability of LoVo cells. The responses to different treatments were observed and analyzed with a fluorescence microscope. *** p < 0.001 versus control. **, p < 0.01 versus control (mean ± SD, n = 3).

Similar articles

Cited by

References

    1. Jemal A., Murray T., Ward E., Samuels A., Tiwari R.C., Ghafoor A., Feuer E.J., Thun M.J. Cancer statistics, 2005. CA Cancer J. Clin. 2005;55:10–30. doi: 10.3322/canjclin.55.1.10. - DOI - PubMed
    1. Lin T.Y., Fan C.W., Maa M.C., Leu T.H. Lipopolysaccharide-promoted proliferation of Caco-2 cells is mediated by c-Src induction and ERK activation. Biomedicine. 2015;5:5. doi: 10.7603/s40681-015-0005-x. - DOI - PMC - PubMed
    1. Greenwald P. Colon cancer overview. Cancer. 1992;70:1206–1215. doi: 10.1002/1097-0142(19920901)70:3+<1206::AID-CNCR2820701504>3.0.CO;2-J. - DOI - PubMed
    1. Jemal A., Thomas A., Murray T., Thun M. Cancer statistics, 2002. CA Cancer J. Clin. 2002;52:23–47. doi: 10.3322/canjclin.52.1.23. - DOI - PubMed
    1. Jemal A., Thomas A., Murray T., Ghafoor A., Samuels A., Ward E., Feuer E.J., Thun M.J., American Cancer Society Cancer statistics, 2004. CA Cancer J. Clin. 2004;54:8–29. doi: 10.3322/canjclin.54.1.8. - DOI - PubMed

MeSH terms

Substances