

Lithium in the Natural Waters of the South East of Ireland
- PMID: 28587126
- PMCID: PMC5486247
- DOI: 10.3390/ijerph14060561
Lithium in the Natural Waters of the South East of Ireland
Abstract
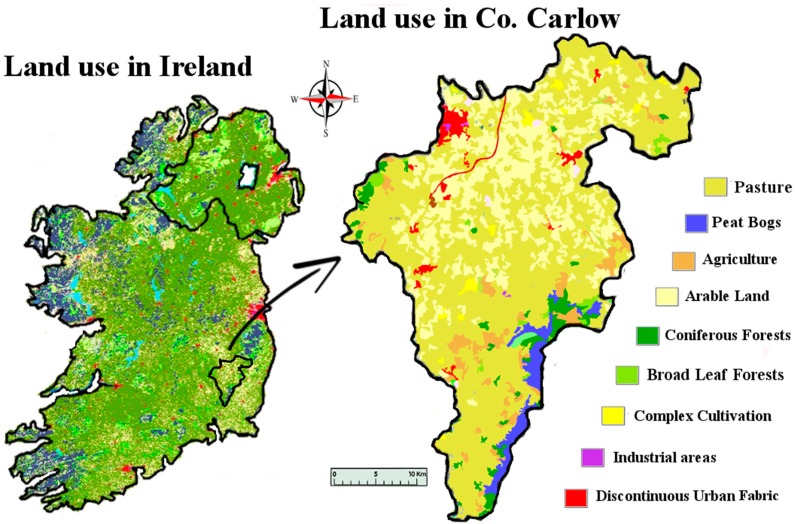
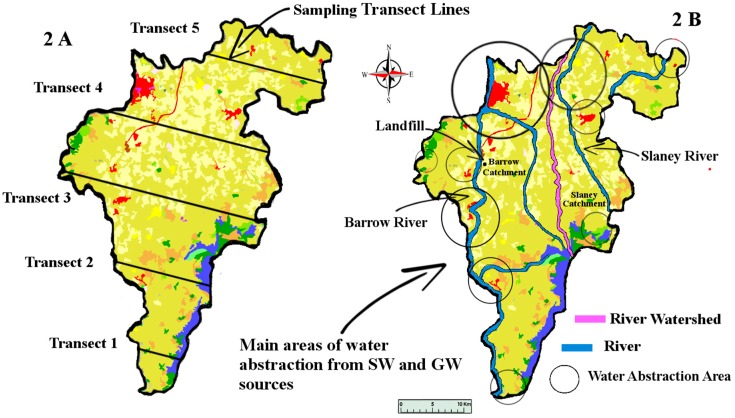
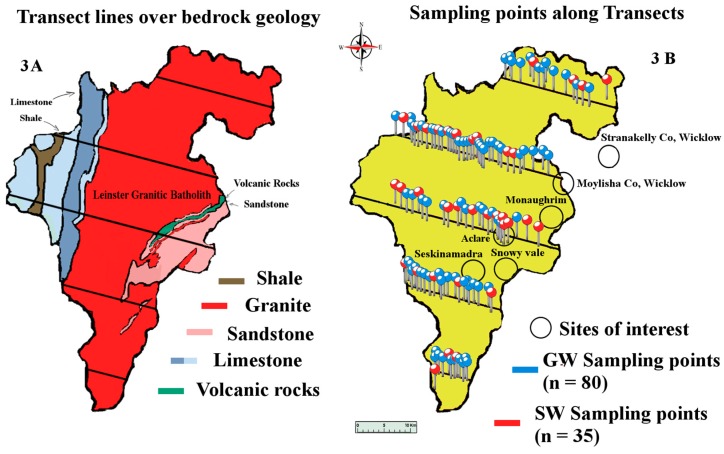
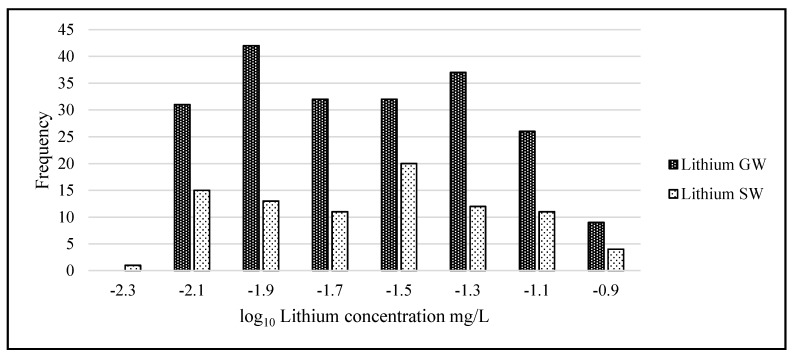
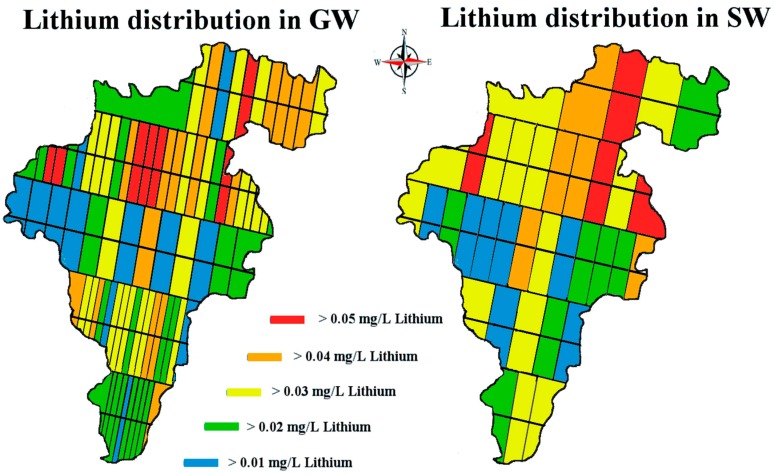
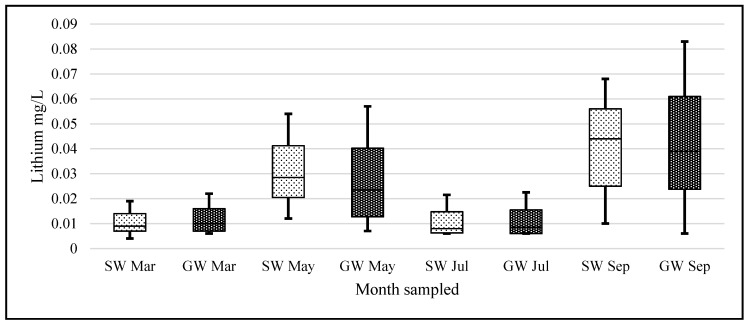
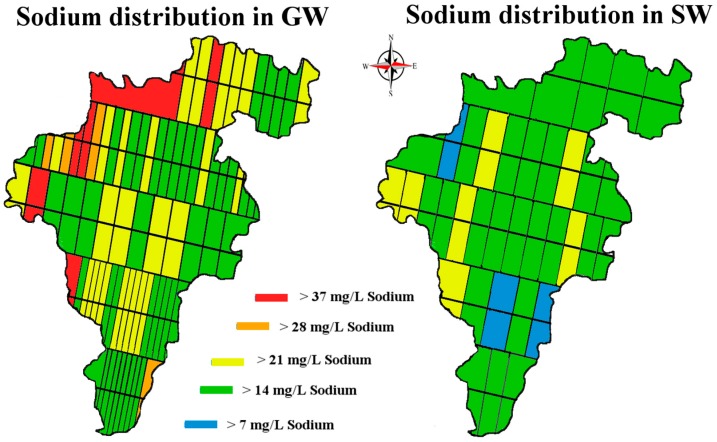
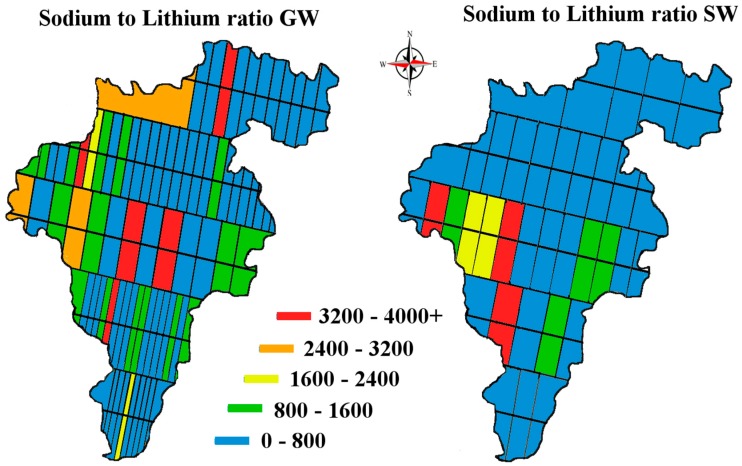
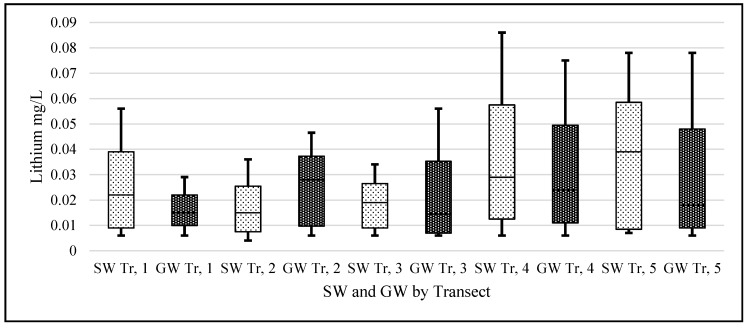
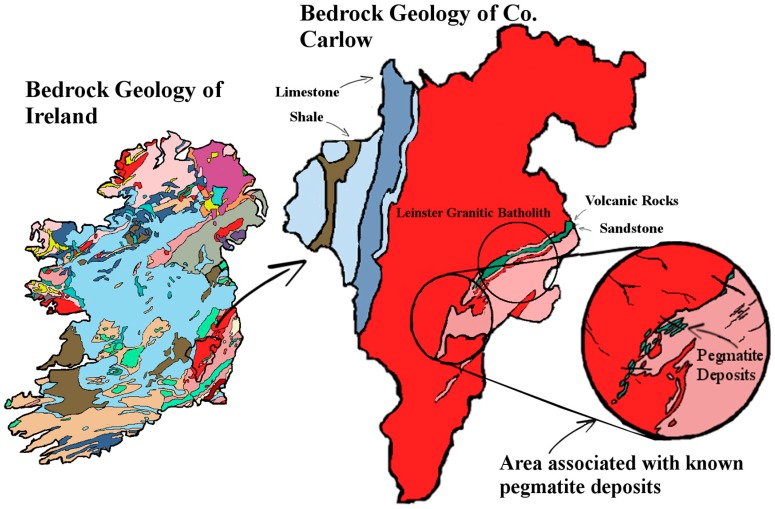
The South East of Ireland (County Carlow) contains a deposit of the valuable lithium-bearing mineral spodumene (LiAl(SiO₃)₂). This resource has recently attracted interest and abstractive mining in the area is a possibility for the future. The open cast mining of this resource could represent a potential hazard in the form of metalliferous pollution to local water. The population of County Carlow is just under 60,000. The local authority reports that approximately 75.7% of the population's publicly supplied drinking water is abstracted from surface water and 11.6% from groundwater. In total, 12.7% of the population abstract their water from private groundwater wells. Any potential entry of extraneous metals into the area's natural waters will have implications for people in county Carlow. It is the goal of this paper to establish background concentrations of lithium and other metals in the natural waters prior to any mining activity. Our sampling protocol totaled 115 sites along five sampling transects, sampled through 2015. From this dataset, we report a background concentration of dissolved lithium in the natural waters of County Carlow, surface water at x ¯ = 0.02, SD = 0.02 ranging from 0 to 0.091 mg/L and groundwater at x ¯ = 0.023, SD = 0.02 mg/L ranging from 0 to 0.097 mg/L.
Keywords: groundwater; lithium; mining; surface-water.
Conflict of interest statement
The authors declare no conflict of interest. The founding sponsors had no role in the design of the study; in the collection, analyses, or interpretation of data; in the writing of the manuscript, and in the decision to publish the results.
Figures

References
-
- Riley J.P., Tongudai M. The lithium content of sea water. Deep Sea Res. Oceanogr. Abstr. 1964;11:563–568. doi: 10.1016/0011-7471(64)90002-6. - DOI
-
- Angino E.E., Billings G.K. Lithium content of sea water by atomic absorption spectrometry. Geochim. Cosmochim. Acta. 1966;30:153–158. doi: 10.1016/0016-7037(66)90104-9. - DOI
-
- Lenntech B.V. Lithium and Water Reaction Mechanisms, Environmental Impact and Health Effects. [(accessed on 15 March 2017)]; Available online: http://www.lenntech.com/periodic/water/lithium/lithium-and-water.htm.
-
- Salminen R. Geochemical Atlas of Europe. [(accessed on 14 March 2017)]; Available online: http://weppi.gtk.fi/publ/foregsatlas/
-
- Ayotte J.D., Gronberg J.M., Apodaca L.E. Trace Elements and Radon in Groundwater across the United States, 1992–2003. U.S. Geological Survey; Reston, VA, USA: 2011.
MeSH terms
Substances
LinkOut - more resources
Full Text Sources
Other Literature Sources
Miscellaneous
