

Differential Sarcomere and Electrophysiological Maturation of Human iPSC-Derived Cardiac Myocytes in Monolayer vs. Aggregation-Based Differentiation Protocols
- PMID: 28587156
- PMCID: PMC5485997
- DOI: 10.3390/ijms18061173
Differential Sarcomere and Electrophysiological Maturation of Human iPSC-Derived Cardiac Myocytes in Monolayer vs. Aggregation-Based Differentiation Protocols
Abstract
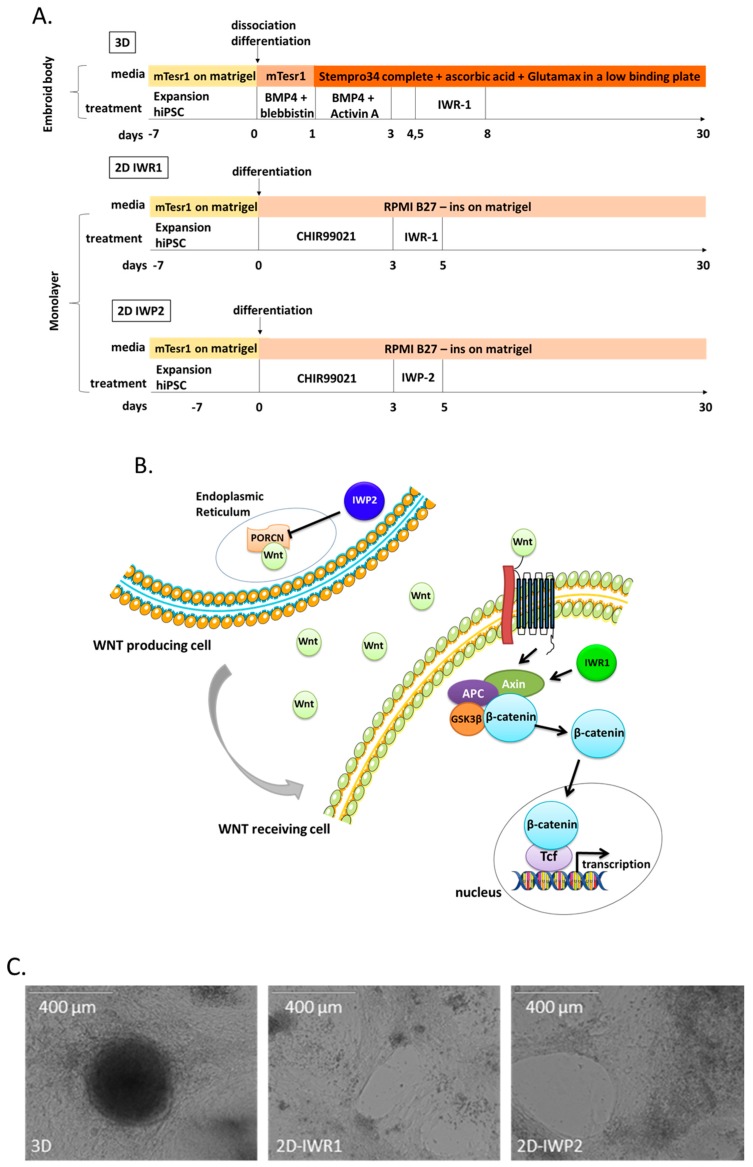
Human induced pluripotent stem cells (iPSCs) represent a powerful human model to study cardiac disease in vitro, notably channelopathies and sarcomeric cardiomyopathies. Different protocols for cardiac differentiation of iPSCs have been proposed either based on embroid body formation (3D) or, more recently, on monolayer culture (2D). We performed a direct comparison of the characteristics of the derived cardiomyocytes (iPSC-CMs) on day 27 ± 2 of differentiation between 3D and 2D differentiation protocols with two different Wnt-inhibitors were compared: IWR1 (inhibitor of Wnt response) or IWP2 (inhibitor of Wnt production). We firstly found that the level of Troponin T (TNNT2) expression measured by FACS was significantly higher for both 2D protocols as compared to the 3D protocol. In the three methods, iPSC-CM show sarcomeric structures. However, iPSC-CM generated in 2D protocols constantly displayed larger sarcomere lengths as compared to the 3D protocol. In addition, mRNA and protein analyses reveal higher cTNi to ssTNi ratios in the 2D protocol using IWP2 as compared to both other protocols, indicating a higher sarcomeric maturation. Differentiation of cardiac myocytes with 2D monolayer-based protocols and the use of IWP2 allows the production of higher yield of cardiac myocytes that have more suitable characteristics to study sarcomeric cardiomyopathies.
Keywords: cardiomyocytes; cardiomyopathies; differentiation; induced pluripotent stem cells; sarcomere.
Conflict of interest statement
Jean-Sébastien Hulot and Eric Villard declare a research grant to the institution from Sanofi. The founding sponsors had no role in the design of the study; in the collection, analyses, or interpretation of data; in the writing of the manuscript, and in the decision to publish the results.
Figures


References
-
- Lahti A.L., Kujala V.J., Chapman H., Koivisto A.P., Pekkanen-Mattila M., Kerkela E., Hyttinen J., Kontula K., Swan H., Conklin B.R., et al. Model for long QT syndrome type 2 using human iPS cells demonstrates arrhythmogenic characteristics in cell culture. Dis. Model. Mech. 2012;5:220–230. doi: 10.1242/dmm.008409. - DOI - PMC - PubMed
-
- Stillitano F., Hansen J., Kong C.W., Karakikes I., Funck-Brentano C., Geng L., Scott S., Reynier S., Wu M., Valogne Y., et al. Modeling susceptibility to drug-induced long QT with a panel of subject-specific induced pluripotent stem cells. Elife. 2017;6:e19406. doi: 10.7554/eLife.19406. - DOI - PMC - PubMed
-
- Itzhaki I., Maizels L., Huber I., Gepstein A., Arbel G., Caspi O., Miller L., Belhassen B., Nof E., Glikson M., et al. Modeling of catecholaminergic polymorphic ventricular tachycardia with patient-specific human-induced pluripotent stem cells. J. Am. Coll. Cardiol. 2012;60:990–1000. doi: 10.1016/j.jacc.2012.02.066. - DOI - PubMed
-
- Hick A., Wattenhofer-Donze M., Chintawar S., Tropel P., Simard J.P., Vaucamps N., Gall D., Lambot L., Andre C., Reutenauer L., et al. Neurons and cardiomyocytes derived from induced pluripotent stem cells as a model for mitochondrial defects in friedreich’s ataxia. Dis. Model. Mech. 2013;6:608–621. doi: 10.1242/dmm.010900. - DOI - PMC - PubMed
MeSH terms
LinkOut - more resources
Full Text Sources
Other Literature Sources
Research Materials
Miscellaneous
