

Bayesian hierarchical piecewise regression models: a tool to detect trajectory divergence between groups in long-term observational studies
- PMID: 28587592
- PMCID: PMC5461770
- DOI: 10.1186/s12874-017-0358-9
Bayesian hierarchical piecewise regression models: a tool to detect trajectory divergence between groups in long-term observational studies
Abstract
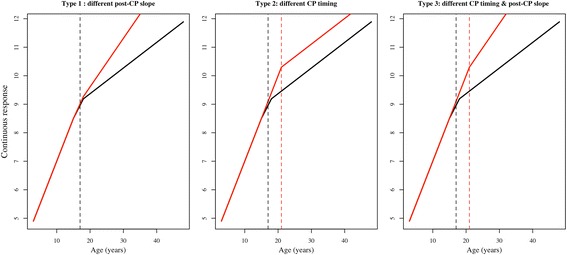
Background: Bayesian hierarchical piecewise regression (BHPR) modeling has not been previously formulated to detect and characterise the mechanism of trajectory divergence between groups of participants that have longitudinal responses with distinct developmental phases. These models are useful when participants in a prospective cohort study are grouped according to a distal dichotomous health outcome. Indeed, a refined understanding of how deleterious risk factor profiles develop across the life-course may help inform early-life interventions. Previous techniques to determine between-group differences in risk factors at each age may result in biased estimate of the age at divergence.
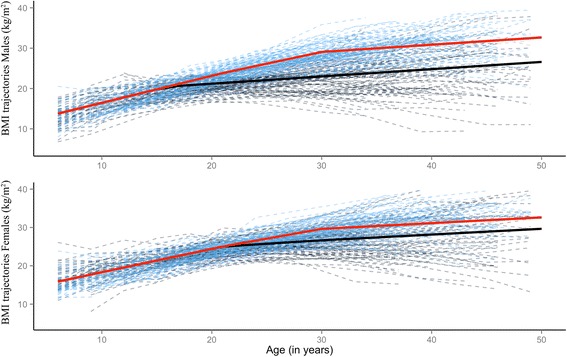
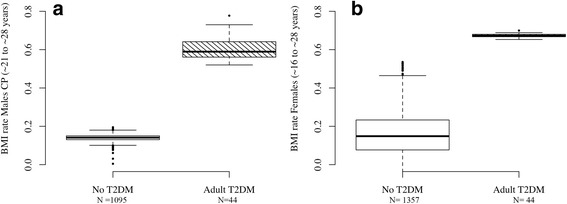
Methods: We demonstrate the use of Bayesian hierarchical piecewise regression (BHPR) to generate a point estimate and credible interval for the age at which trajectories diverge between groups for continuous outcome measures that exhibit non-linear within-person response profiles over time. We illustrate our approach by modeling the divergence in childhood-to-adulthood body mass index (BMI) trajectories between two groups of adults with/without type 2 diabetes mellitus (T2DM) in the Cardiovascular Risk in Young Finns Study (YFS).
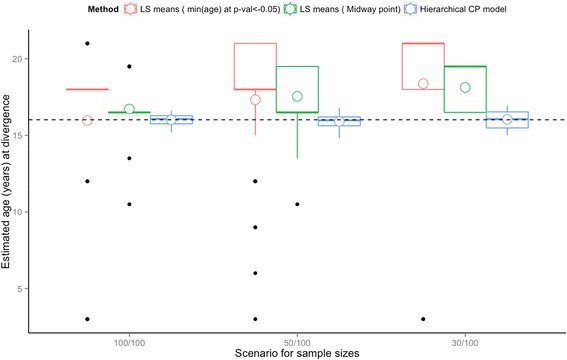
Results: Using the proposed BHPR approach, we estimated the BMI profiles of participants with T2DM diverged from healthy participants at age 16 years for males (95% credible interval (CI):13.5-18 years) and 21 years for females (95% CI: 19.5-23 years). These data suggest that a critical window for weight management intervention in preventing T2DM might exist before the age when BMI growth rate is naturally expected to decrease. Simulation showed that when using pairwise comparison of least-square means from categorical mixed models, smaller sample sizes tended to conclude a later age of divergence. In contrast, the point estimate of the divergence time is not biased by sample size when using the proposed BHPR method.
Conclusions: BHPR is a powerful analytic tool to model long-term non-linear longitudinal outcomes, enabling the identification of the age at which risk factor trajectories diverge between groups of participants. The method is suitable for the analysis of unbalanced longitudinal data, with only a limited number of repeated measures per participants and where the time-related outcome is typically marked by transitional changes or by distinct phases of change over time.
Keywords: Accelerated longitudinal design; Cohort effect; Group divergence; Hierarchical regression; Non-linear trajectory model; Piecewise model.
Figures
References
-
- Færch K, Witte DR, Tabák AG, Perreault L, Herder C, Brunner EJ, Kivimäki M, Vistisen D. Trajectories of cardiometabolic risk factors before diagnosis of three subtypes of type 2 diabetes: a post-hoc analysis of the longitudinal Whitehall II cohort study. Lancet Diabetes Endocrinol.1:43–51. - PubMed
MeSH terms
LinkOut - more resources
Full Text Sources
Other Literature Sources
