

Low genetic and phenotypic divergence in a contact zone between freshwater and marine sticklebacks: gene flow constrains adaptation
- PMID: 28587593
- PMCID: PMC5461706
- DOI: 10.1186/s12862-017-0982-3
Low genetic and phenotypic divergence in a contact zone between freshwater and marine sticklebacks: gene flow constrains adaptation
Abstract
Background: Distinct hybrid zones and phenotypic and genomic divergence is often observed between marine and freshwater threespine sticklebacks (Gasterosteus aculeatus). Nevertheless, cases also exist where marine-freshwater divergence is diffuse despite seemingly similar environmental settings. In order to assess what characterizes these highly different outcomes, we focused on the latter kind of system in the Odder River, Denmark. Here, a previous study based on RAD (Restriction site Associated DNA) sequencing found non-significant genome-wide differentiation between marine and freshwater sticklebacks. In the present study, we analyzed samples on a finer geographical scale. We assessed if the system should be regarded as panmictic, or if fine-scale genetic structure and local selection was present but dominated by strong migration. We also asked if specific population components, that is the two sexes and different lateral plate morphs, contributed disproportionally more to dispersal.
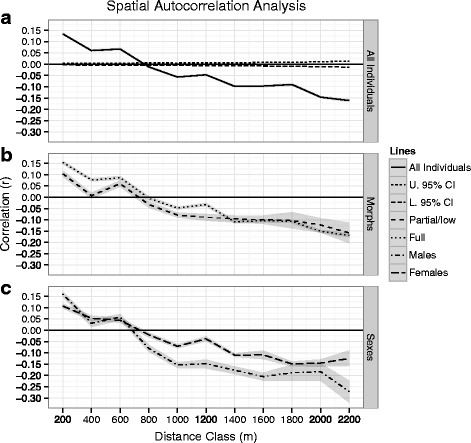
Results: We assessed variation at 96 SNPs and the Eda gene that affects lateral plate number, conducted molecular sex identification, and analyzed morphological traits. Genetic differentiation estimated by FST was non-significant throughout the system. Nevertheless, spatial autocorrelation analysis suggested fine scale genetic structure with a genetic patch size of 770 m. There was no evidence for sex-biased dispersal, but full-plated individuals showed higher dispersal than low- and partial-plated individuals. The system was dominated by full-plated morphs characteristic of marine sticklebacks, but in the upstream part of the river body shape and frequency of low-plated morphs changed in the direction expected for freshwater sticklebacks. Five markers including Eda were under possible diversifying selection. However, only subtle clinal patterns were observed for traits and markers.
Conclusions: We suggest that gene flow from marine sticklebacks overwhelms adaptation to freshwater conditions, but the short genetic patch size means that the effect of gene flow on the most upstream region must be indirect and occurs over generations. The occurrence of both weak unimodal and strong bimodal hybrid zones within the same species is striking. We suggest environmental and demographic factors that could determine these outcomes, but also highlight the possibility that long-term population history and the presence or absence of genomic incompatibilities could be a contributing factor.
Keywords: Adaptive divergence; Body shape; Eda; Gene flow; Hybrid zone; Sex-biased dispersal; Single nucleotide polymorphisms; Spatial autocorrelation.
Figures


Similar articles
-
The impact of selection, gene flow and demographic history on heterogeneous genomic divergence: three-spine sticklebacks in divergent environments.Mol Ecol. 2016 Jan;25(1):238-59. doi: 10.1111/mec.13399. Epub 2015 Nov 11. Mol Ecol. 2016. PMID: 26412233
-
Non-parallel divergence across freshwater and marine three-spined stickleback Gasterosteus aculeatus populations.J Fish Biol. 2017 Jul;91(1):175-194. doi: 10.1111/jfb.13336. Epub 2017 May 17. J Fish Biol. 2017. PMID: 28516498
-
A low-density SNP array for analyzing differential selection in freshwater and marine populations of threespine stickleback (Gasterosteus aculeatus).BMC Genomics. 2014 Oct 6;15(1):867. doi: 10.1186/1471-2164-15-867. BMC Genomics. 2014. PMID: 25286752 Free PMC article.
-
Toward conservation of genetic and phenotypic diversity in Japanese sticklebacks.Genes Genet Syst. 2016 Oct 13;91(2):77-84. doi: 10.1266/ggs.15-00082. Epub 2016 Jun 10. Genes Genet Syst. 2016. PMID: 27301281 Review.
-
Perspectives on the genetic architecture of divergence in body shape in sticklebacks.Integr Comp Biol. 2010 Dec;50(6):1057-66. doi: 10.1093/icb/icq030. Epub 2010 Apr 26. Integr Comp Biol. 2010. PMID: 21082067 Free PMC article. Review.
Cited by
-
Mutation potentiates migration swamping in polygenic local adaptation.Genetics. 2024 Oct 12;228(4):iyae165. doi: 10.1093/genetics/iyae165. Online ahead of print. Genetics. 2024. PMID: 39395190 Free PMC article.
-
Study of morphological variation of northern Neotropical Ariidae reveals conservatism despite macrohabitat transitions.BMC Evol Biol. 2018 Mar 27;18(1):38. doi: 10.1186/s12862-018-1152-y. BMC Evol Biol. 2018. PMID: 29587647 Free PMC article.
-
Small fish, large river: Surprisingly minimal genetic structure in a dispersal-limited, habitat specialist fish.Ecol Evol. 2020 Feb 6;10(4):2253-2268. doi: 10.1002/ece3.6064. eCollection 2020 Feb. Ecol Evol. 2020. PMID: 32128153 Free PMC article.
-
Rapid microevolution during recent range expansion to harsh environments.BMC Evol Biol. 2018 Dec 7;18(1):187. doi: 10.1186/s12862-018-1311-1. BMC Evol Biol. 2018. PMID: 30526493 Free PMC article.
-
Allometric relationships in morphological traits associated with foraging, swimming ability, and predator defense reveal adaptations toward brackish and freshwater environments in the threespine stickleback.Ecol Evol. 2020 Oct 29;10(23):13412-13426. doi: 10.1002/ece3.6945. eCollection 2020 Dec. Ecol Evol. 2020. PMID: 33304548 Free PMC article.
References
-
- Endler JA. Natural selection in the wild. Princeton: Princeton University Press; 1986.
-
- Kawecki TJ, Ebert D. Conceptual issues in local adaptation. Ecol Lett. 2004;7(12):1225–1241. doi: 10.1111/j.1461-0248.2004.00684.x. - DOI
-
- Garant D, Forde SE, Hendry AP. The multifarious effects of dispersal and gene flow on contemporary adaptation. Funct Ecol. 2007;21(3):434–443. doi: 10.1111/j.1365-2435.2006.01228.x. - DOI
-
- Lenormand T. Gene flow and the limits to natural selection. Trends Ecol Evol. 2002;17(4):183–189. doi: 10.1016/S0169-5347(02)02497-7. - DOI
MeSH terms
LinkOut - more resources
Full Text Sources
Other Literature Sources
Miscellaneous
