. 2017 Jun 6;18(1):444.
doi: 10.1186/s12864-017-3825-0.

Proteomic analysis by iTRAQ-MRM of soybean resistance to Lamprosema Indicate

Affiliations

Proteomic analysis by iTRAQ-MRM of soybean resistance to Lamprosema Indicate

Weiying Zeng et al. BMC Genomics. .

Abstract

Background: Lamprosema indicate is a major leaf feeding insect pest to soybean, which has caused serious yield losses in central and southern China. To explore the defense mechanisms of soybean resistance to Lamprosema indicate, a highly resistant line (Gantai-2-2) and a highly susceptible line (Wan 82-178) were exposed to Lamprosema indicate larval feedings for 0 h and 48 h, and the differential proteomic analyses of these two lines were carried out.

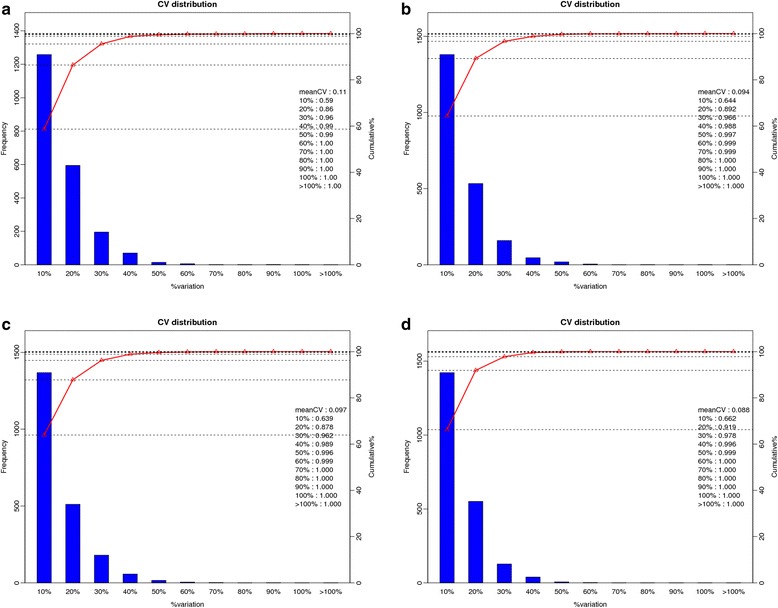
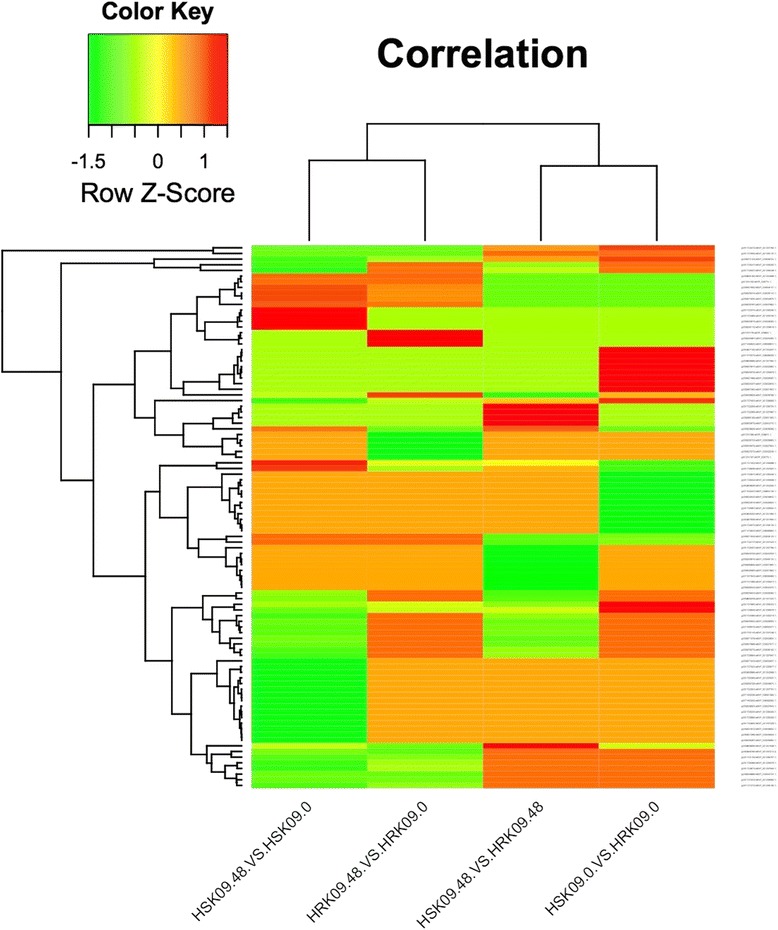
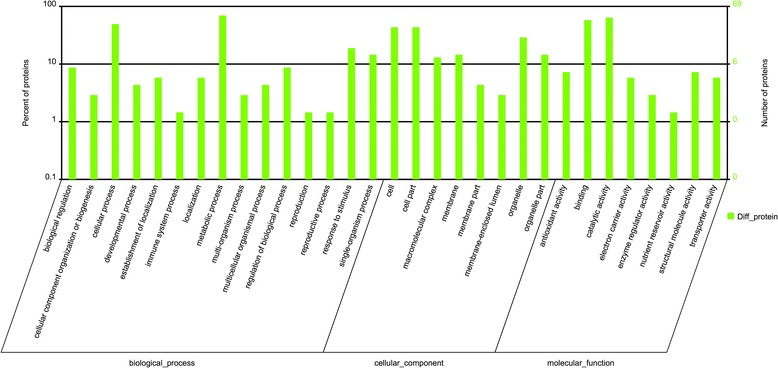
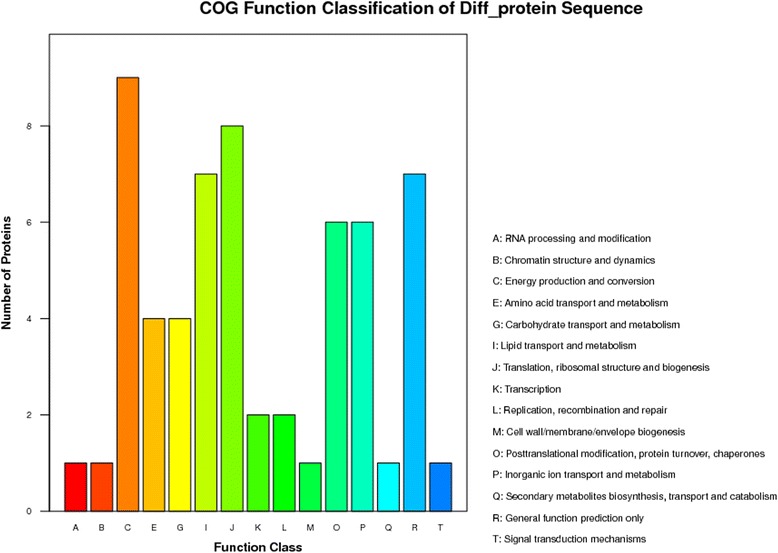
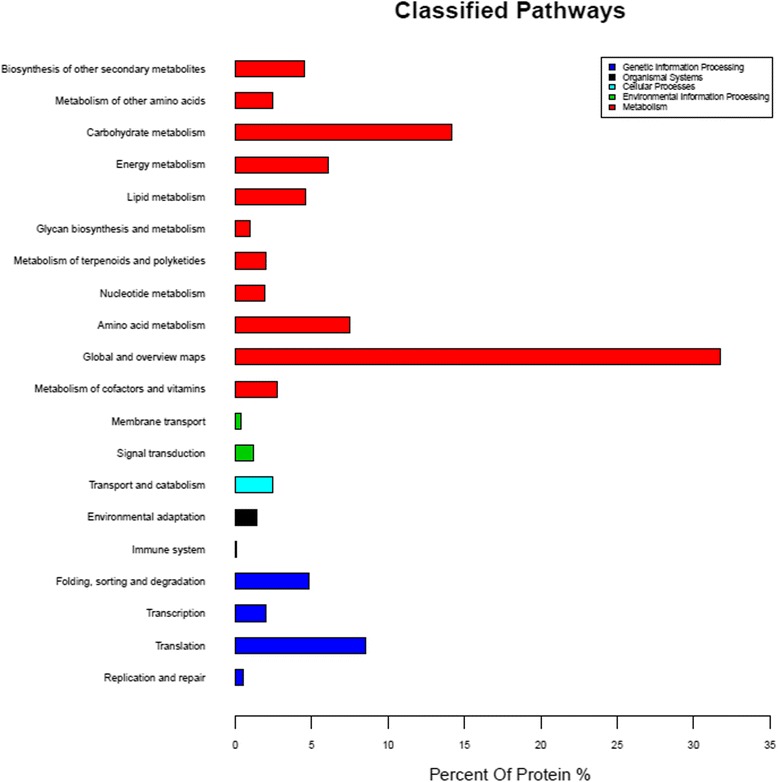
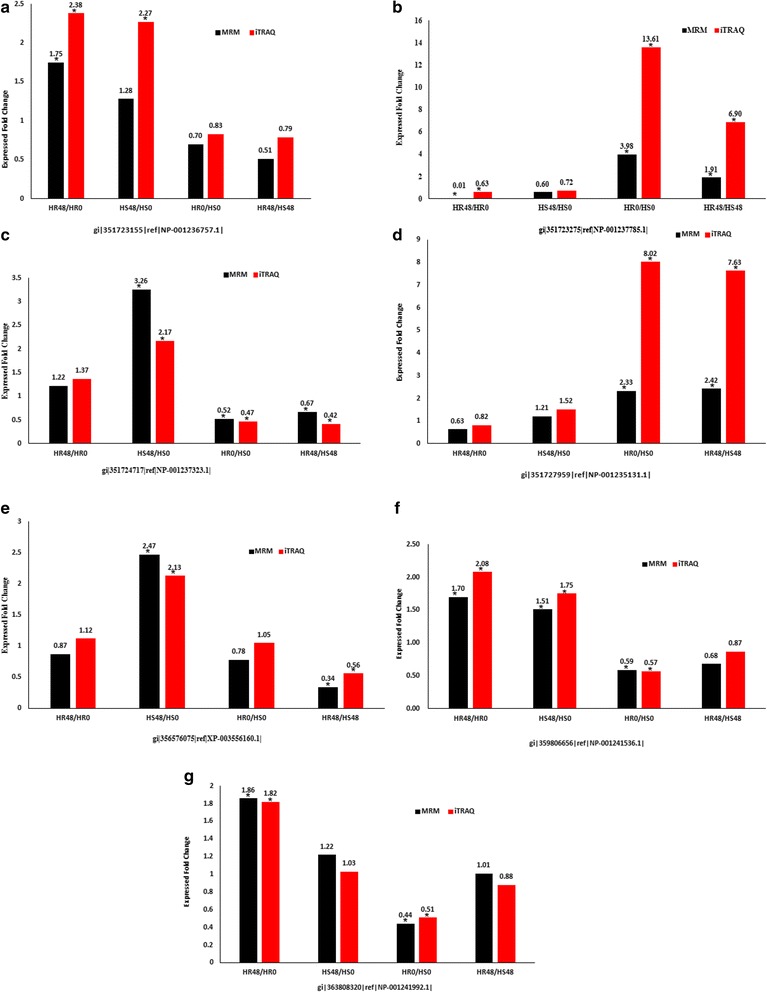
Results: The results showed that 31 differentially expressed proteins (DEPs) were identified in the Gantai-2-2 when comparing 48 h feeding with 0 h feeding, and 53 DEPs were identified in the Wan 82-178. 28 DEPs were identified when comparing Gantai-2-2 with Wan 82-178 at 0 h feeding. The bioinformatic analysis results showed that most of the DEPs were associated with ribosome, linoleic acid metabolism, flavonoid biosynthesis, phenylpropanoid biosynthesis, peroxisome, stilbenoid, diarylheptanoid and gingerol biosynthesis, glutathione metabolism, pant hormone signal transduction, and flavone and flavonol biosynthesis, as well as other resistance related metabolic pathways. The MRM analysis showed that the iTRAQ results were reliable.

Conclusions: According to the analysis of the DEPs results, the soybean defended or resisted the Lamprosema indicate damage by the induction of a synthesis of anti-digestive proteins which inhibit the growth and development of insects, reactive oxygen species scavenging, signaling pathways, secondary metabolites synthesis, and so on.

Keywords: Differentially expressed protein; Lamprosema indicate (Fabricius); MRM; Soybean; iTRAQ.


Figures

Fig. 1
Fig. 1
Protein mass distribution. Note: The X axis represents the molecular weights (kDa) of the identified proteins, and the Y axis represents the number of proteins
Fig. 2
Fig. 2
Peptide length distribution. Note: The X axis represents the length of the peptides, and the Y axis represents the number of proteins
Fig. 3
Fig. 3
Distribution of the proteins’ sequence coverages. Note: The different colors represent the coverage range of the different sequences, and the pie chart displays the proportion of the number of the different proteins within the scope of coverage in the total protein amount
Fig. 4
Fig. 4
Distribution of the number of peptides. Note: The X axis represents the scope of the number of identified peptides, and the Y axis represents the number of proteins
Fig. 5
Fig. 5
Repeatability analysis. a. cv_HR48/HR0_combine, b. cv_HS48/HS0_combine, c. cv_HR0/HS0_combine, d. cv_HR48/HS48_combine. Note: The horizontal axis represents the different levels of variation; the left vertical axis indicates the numbers of the quantitative proteins at different levels of variation and the corresponding column; and the right vertical axis represents the summation of the proportion of the number of proteins at different levels of variation, which accounted for the total number of proteins, along with the corresponding line chart. HR represents the highly resistant line of the Gantai-2-2; HS represents the highly susceptible line of the Wan 82–178; and 0, 48 indicate that the soybean samples were treated with Lamprosema indicate at 0 and 48 h, respectively
Fig. 6
Fig. 6
TheDEPs function clustering analysis of four comparison groups. Note: The fold changes of DEPs were presented with different colors, red represents down-regulated; green up-regulated. HR represents the highly resistant line of the Gantai-2-2; HS represents the highly susceptible line of the Wan 82–178; and 0, 48 indicate that the soybean samples were treated with Lamprosema indicate at 0 and 48 h, respectively
Fig. 7
Fig. 7
GO enrichment for all of the identified DEPs. Note: The X axis represents each GO term, and the Y axis represents the enrichment ratio of the DEPs in each of the major classes
Fig. 8
Fig. 8
COG functional classes of all of the identified DEPs. Note: The capital letters in the X axis represent the COG categories on the right of column, and the Y axis represents the number of DEPs
Fig. 9
Fig. 9
Pathways Classification of all of the identified DEPs. Note: The X axis represent the percent of protein (%), and the Y axis represents the metabolic process
Fig. 10
Fig. 10
Network metabolic analysis for DEPs. a. HR48/HR0, b. HS48/HS0, c. HS0/HR0. Note: The fold changes of differential expressed proteins were presented with different colors, red represents down-regulated; green up-regulated. HR represents the highly resistant line of the Gantai-2-2; HS represents the highly susceptible line of the Wan 82–178; and 0, 48 indicate that the soybean samples were treated with Lamprosema indicate at 0 and 48 h, respectively
Fig. 11
Fig. 11
Relative expression leves of selected proteins measured by iTRAQ and MRM in the HR48/HR0, HS48/HS0, HR0/HS0 and HR48/HS48. a. gi|351,723,155|ref.|NP-001236757.1|, b. gi|351,723,275|ref.|NP-001237785.1|, c. gi|351,724,717|ref.|NP-001237323.1|, d. gi|351,727,959|ref.|NP-001235131.1|, e. gi|356,576,075|ref.|XP-003556160.1|, f. gi|359,806,656|ref.|NP-001241536.1|, g. gi|363,808,320|ref.|NP-001241992.1|. Note: “*” means DEPs. HR represents the highly resistant line of the Gantai-2-2; HS represents the highly susceptible line of the Wan 82–178; and 0, 48 indicate that the soybean samples were treated with Lamprosema indicate at 0 and 48 h, respectively

Similar articles

Cited by

References

    1. Paiva NL. An introduction to the biosynthesis of chemicals used in plant-microbe communication. J Plant Growth Regul. 2000;19(2):131–143. - PubMed
    1. Mauricio R, Rausher MD, Burdick DS. Variation in the defense strategies of plant: are resistance and tolerance mutually exclusive. Ecol. 1997;78(5):1301–1311. doi: 10.1890/0012-9658(1997)078[1301:VITDSO]2.0.CO;2. - DOI
    1. Fan R, Wang H, Wang YL, Yu DY. Proteomic analysis of soybean defense response induced by cotton worm (Prodenia litura, fabricius) feeding. Proteome Sci. 2012;10(1):338–348. doi: 10.1186/1477-5956-10-16. - DOI - PMC - PubMed
    1. Wei Z, Hu W, Lin QS, Cheng XY, Tong MJ, Zhu LL, et al. Understanding rice plant resistance to the Brown Planthopper (Nilaparvata lugens): a proteomic approach. Proteomics. 2009;9(10):2798–2808. doi: 10.1002/pmic.200800840. - DOI - PubMed
    1. Sangha JS, Chen YH, Jatinder K, Wajahatullah K, Zainularifeen A, Mohammed SA, et al. Proteome analysis of rice (Oryza sativa L.) mutants reveals differentially induced proteins during Brown Planthopper (Nilaparvata lugens) infestation. Int J Mol Sci. 2013;14(2):3921–3945. doi: 10.3390/ijms14023921. - DOI - PMC - PubMed

Publication types