. 2017 Jun 6;5(1):59.
doi: 10.1186/s40168-017-0275-5.

Improved detection of gene-microbe interactions in the mouse skin microbiota using high-resolution QTL mapping of 16S rRNA transcripts

Affiliations

Improved detection of gene-microbe interactions in the mouse skin microbiota using high-resolution QTL mapping of 16S rRNA transcripts

Meriem Belheouane et al. Microbiome. .

Abstract

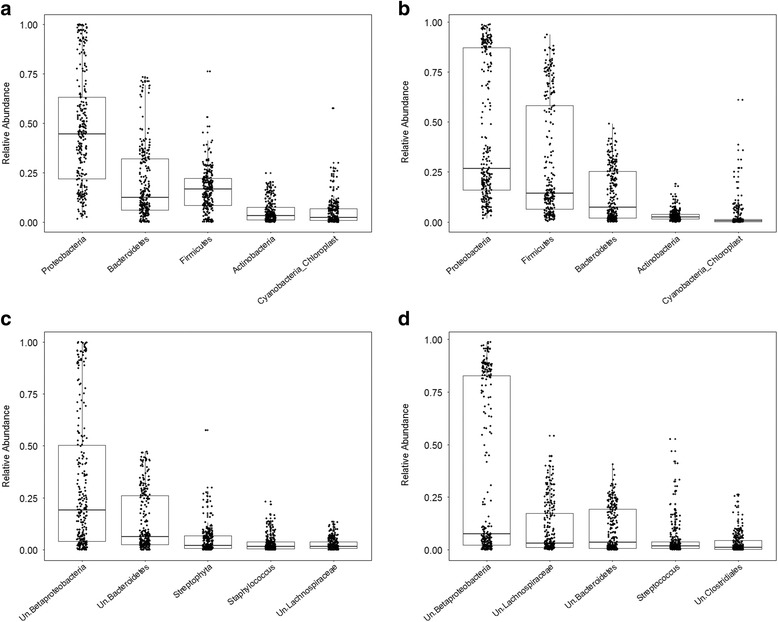
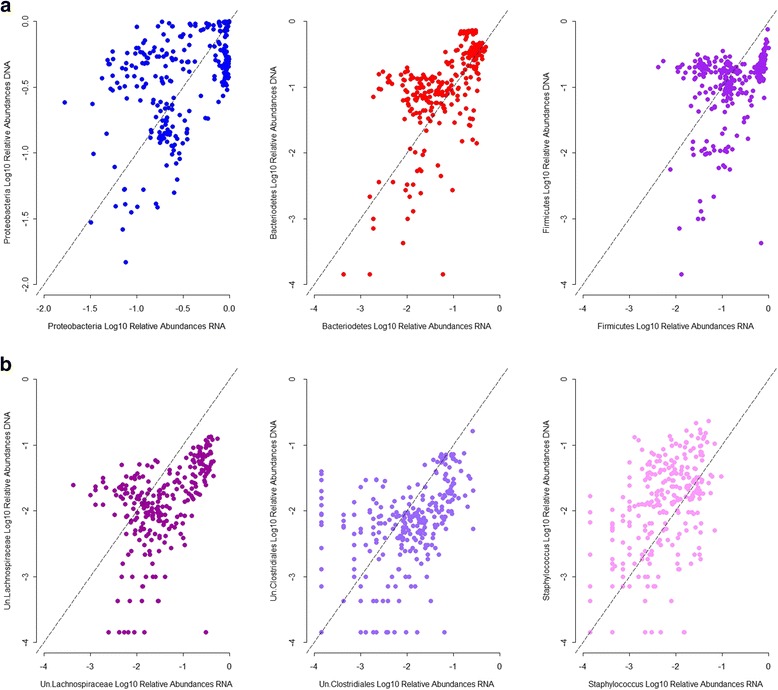
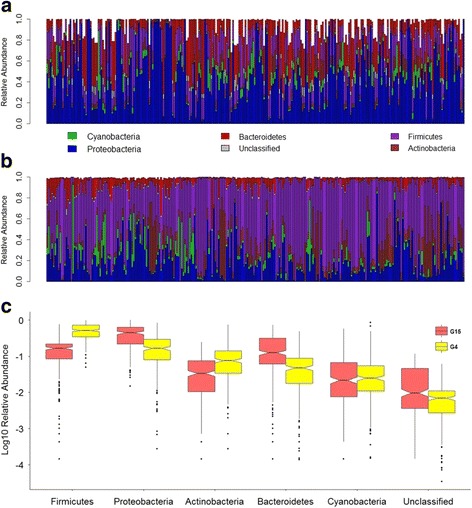
Background: Recent studies highlight the utility of quantitative trait locus (QTL) mapping for determining the contribution of host genetics to interindividual variation in the microbiota. We previously demonstrated that similar to the gut microbiota, abundances of bacterial taxa in the skin are significantly influenced by host genetic variation. In this study, we analyzed the skin microbiota of mice from the 15th generation of an advanced intercross line using a novel approach of extending bacterial trait mapping to both the 16S rRNA gene copy (DNA) and transcript (RNA) levels, which reflect relative bacterial cell number and activity, respectively.

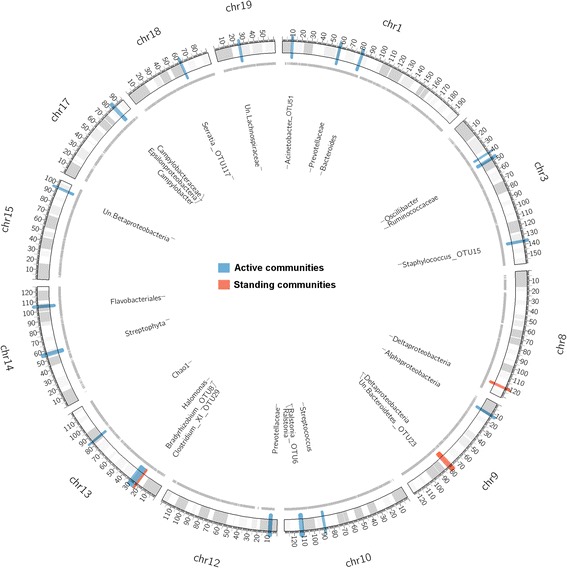
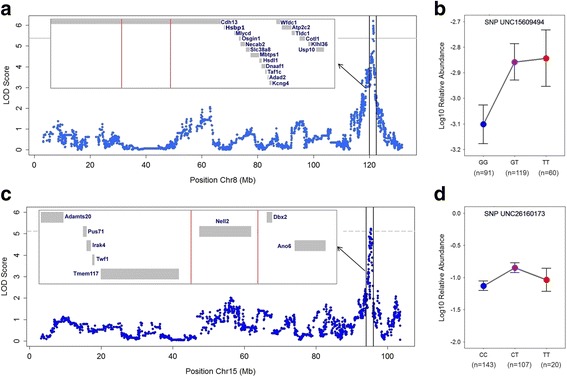
Results: Remarkably, the combination of highly recombined individuals and 53,203 informative SNPs allowed the identification of genomic intervals as small as <0.1 megabases containing single genes. Furthermore, the inclusion of 16S rRNA transcript-level mapping dramatically increased the number of significant associations detected, with five versus 21 significant SNP-bacterial trait associations based on DNA- compared to RNA-level profiling, respectively. Importantly, the genomic intervals identified contain many genes involved in skin inflammation and cancer and are further supported by the bacterial traits they influence, which in some cases have known genotoxic or probiotic capabilities.

Conclusions: These results indicate that profiling based on the relative activity levels of bacterial community members greatly enhances the capability of detecting interactions between the host and its associated microbes. Finally, the identification of several genes involved in skin cancer suggests that similar to colon carcinogenesis, the resident microbiota may play a role in skin cancer susceptibility and its potential prevention and/or treatment.

Keywords: 16S rRNA transcript; QTL mapping; Skin cancer; Skin microbiota.


Figures

Fig. 1
Fig. 1
Relative abundances of phyla and genera. The five most abundant phyla and genera are shown. a Major phyla in standing (DNA-based) communities. b Major phyla in active (RNA-based) communities. c Major genera in standing (DNA-based) communities. d Major genera in active (RNA-based) communities. Un unclassified
Fig. 2
Fig. 2
Correlation between standing and active relative abundances for representative taxa. a Phyla. b Genera. Spearman’s correlation: Proteobacteria: r = 0.42, p = 4.19 × 10−13; Bacteroidetes: r = 0.66, p = 3.3 × 10−16; Firmicutes: r = 0.39, p = 2.72 × 10−11; Un.Lachnospiraceae: r = 0.56, p = 3.3 × 10−16; Un.Clostridiales: r = 0.50, p = 3.3 × 10−16; Staphylococcus: r = 0.48, p = 3.3 × 10−16. Un unclassified. p values are adjusted following Benjamini and Hochberg method [27]
Fig. 3
Fig. 3
Comparison of skin microbiota composition between G4 and G15 populations. a Bar plot of phylum abundances in the G15 population. b Bar plot of phylum abundances in the G4 population. c Boxplots of log10-transformed mean relative abundances of major phyla in populations G4 and G15. ANOVA: Firmicutes, p = 2.2 × 10−16; Proteobacetria, p = 2.2 × 10−16
Fig. 4
Fig. 4
QTL mapping of the standing and active microbiota in the G15 population. Only chromosomes with identified QTLs are shown. Black lines on the chromosomes denote SNPs used in the mapping, and each colored region denotes a QTL defined on either the standing (DNA) or active (RNA) communities
Fig. 5
Fig. 5
Candidate regions for Deltaproteobacteria and unclassified Betaproteobacteria traits. a, c Manhattan plots and confidence intervals (red bars) for Deltaproteobacteria and unclassified Betaproteobacteria QTL mapping, respectively. b, d Peak-SNP effect and frequency in QTLs for Deltaproteobacteria and unclassified Betaproteobacteria, respectively. Bars represent SE of the mean. Un unclassified
Fig. 6
Fig. 6
Correlations among CMM phyla in the standing communities of populations G4 and G15. a G4 population. b G15 population. Non-significant correlations (p > 0.05) after multiple testing correction are left blank

References

    1. Human Microbiome Project Consortium Structure, function and diversity of the healthy human microbiome. Nature. 2012;486(7402):207–14. doi: 10.1038/nature11234. - DOI - PMC - PubMed
    1. Ley RE, Turnbaugh PJ, Klein S, Gordon JI. Microbial ecology: human gut microbes associated with obesity. Nature. 2006;444(7122):1022–3. doi: 10.1038/4441022a. - DOI - PubMed
    1. McKnite AM, Perez-Munoz ME, Lu L, Williams EG, Brewer S, Andreux PA, Bastiaansen JW, Wang X, Kachman SD, Auwerx J, Williams RW, Benson AK, Peterson DA, Ciobanu DC. Murine gut microbiota is defined by host genetics and modulates variation of metabolic traits. PLoS One. 2012;7(6):e39191. doi: 10.1371/journal.pone.0039191. - DOI - PMC - PubMed
    1. Stappenbeck TS, Hooper LV, Gordon JI. Developmental regulation of intestinal angiogenesis by indigenous microbes via Paneth cells. Proc Natl Acad Sci U S A. 2002;99(24):15451–5. doi: 10.1073/pnas.202604299. - DOI - PMC - PubMed
    1. Linnenbrink M, Wang J, Hardouin EA, Künzel S, Metzler D, Baines JF. The role of biogeography in shaping diversity of the intestinal microbiota in house mice. Mol Ecol. 2013;22(7):1904–16. doi: 10.1111/mec.12206. - DOI - PubMed

Publication types

Substances