. 2017 Jun 6;5(1):44.
doi: 10.1186/s40478-017-0444-6.

PLGF, a placental marker of fetal brain defects after in utero alcohol exposure

Affiliations

PLGF, a placental marker of fetal brain defects after in utero alcohol exposure

Matthieu Lecuyer et al. Acta Neuropathol Commun. .

Abstract

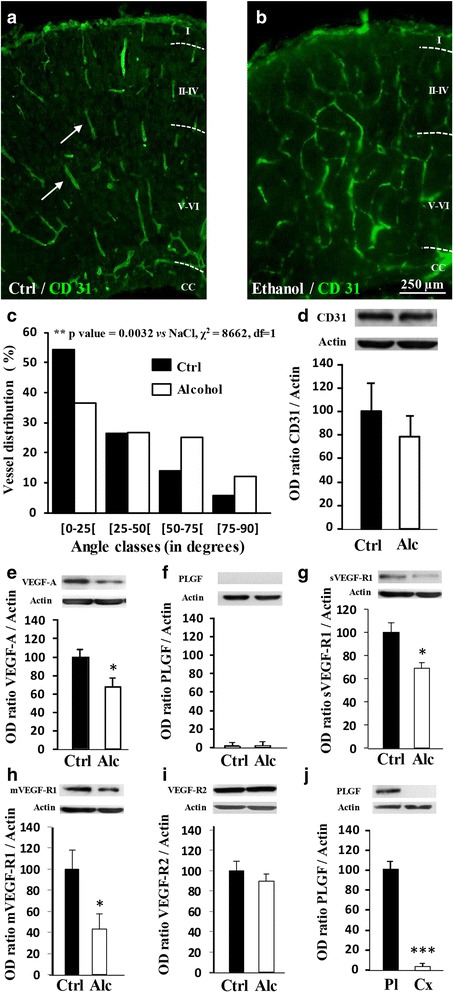
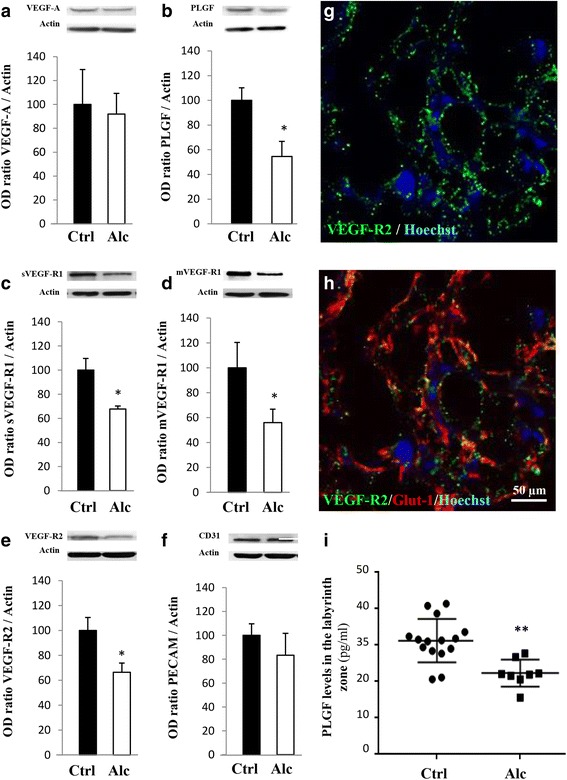
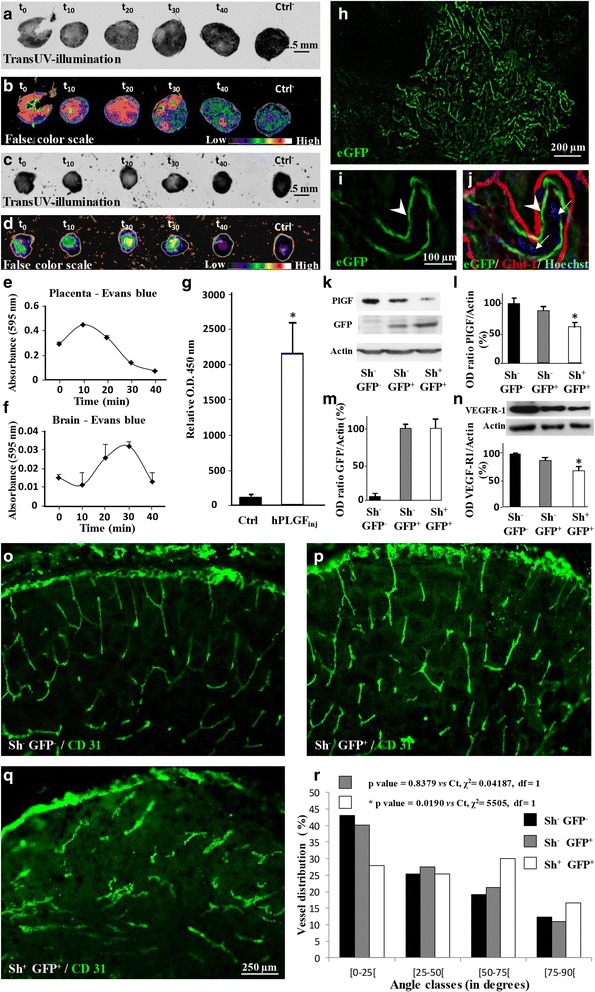
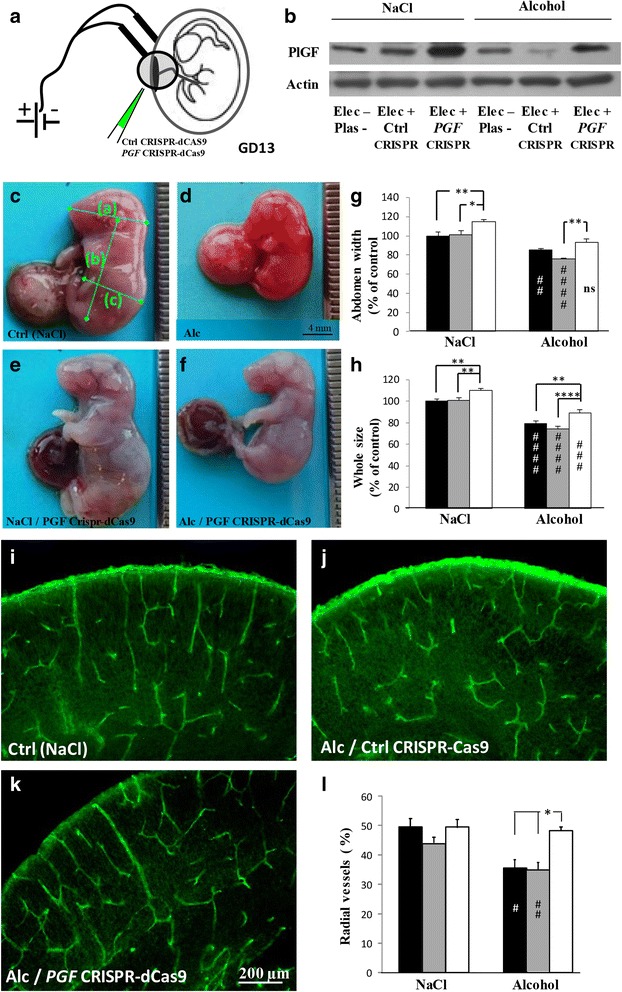
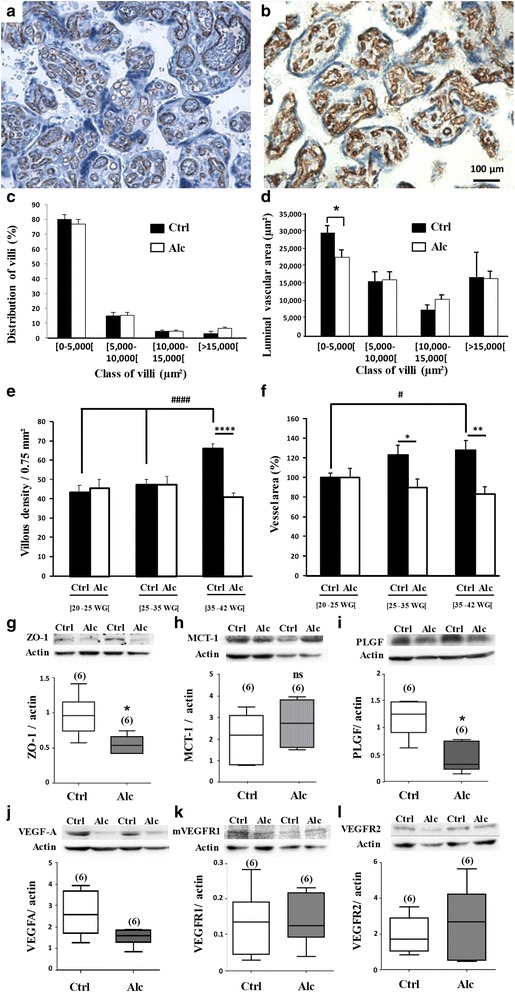
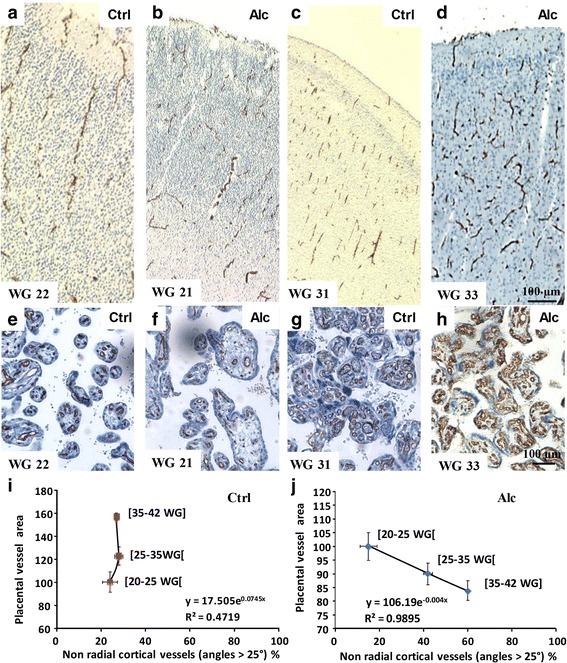
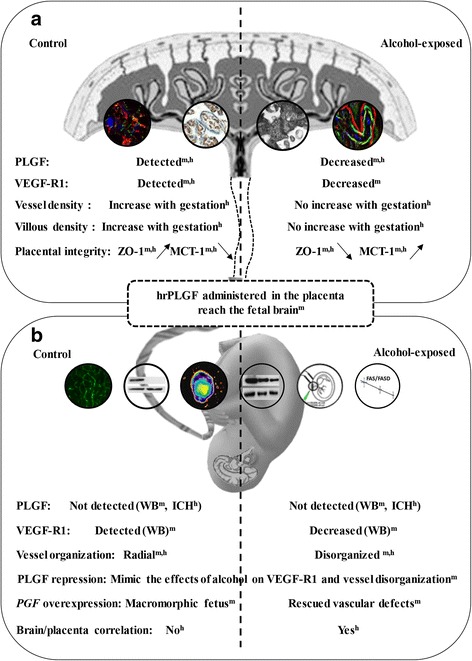
Most children with in utero alcohol exposure do not exhibit all features of fetal alcohol syndrome (FAS), and a challenge for clinicians is to make an early diagnosis of fetal alcohol spectrum disorders (FASD) to avoid lost opportunities for care. In brain, correct neurodevelopment requires proper angiogenesis. Since alcohol alters brain angiogenesis and the placenta is a major source of angiogenic factors, we hypothesized that it is involved in alcohol-induced brain vascular defects. In mouse, using in vivo repression and overexpression of PLGF, we investigated the contribution of placenta on fetal brain angiogenesis. In human, we performed a comparative molecular and morphological analysis of brain/placenta angiogenesis in alcohol-exposed fetuses. Results showed that prenatal alcohol exposure impairs placental angiogenesis, reduces PLGF levels and consequently alters fetal brain vasculature. Placental repression of PLGF altered brain VEGF-R1 expression and mimicked alcohol-induced vascular defects in the cortex. Over-expression of placental PGF rescued alcohol effects on fetal brain vessels. In human, alcohol exposure disrupted both placental and brain angiogenesis. PLGF expression was strongly decreased and angiogenesis defects observed in the fetal brain markedly correlated with placental vascular impairments. Placental PGF disruption impairs brain angiogenesis and likely predicts brain disabilities after in utero alcohol exposure. PLGF assay at birth could contribute to the early diagnosis of FASD.

Keywords: Angiogenesis; Cortex; Fetal alcohol exposure; Placenta.


Figures

Fig. 1
Fig. 1
Effects of in utero alcohol exposure on brain angiogenesis and expression of members of the VEGF/PLGF family from E20 embryos. a, b Effects of fetal alcohol exposure from GD15 to GD20 on the organization of cortical microvessels in control and alcohol-exposed animals. Brain microvessels were visualized by immunohistochemistry against CD31. Arrows indicate brain microvessels presenting a radial orientation in the control group. Note a loss of the radial organization in the alcohol-exposed group. I-VI: Cortical layers; CC: Corpus callosum. c Distribution of the orientation (angle classes) of cortical microvessels in the immature cortex from GD20 fetuses. Statistical analysis was performed using the χ2 test. d Quantification by Western blot of the effects of fetal alcohol exposure during the last gestational week on the cortical expression of CD31 at GD20. e-i Quantification by Western blot of VEGFA, PLGF, sVEGF-R1, mVEGF-R1 and VEGF-R2 protein levels in the cortex from control and alcohol-exposed groups. *p < 0.05 vs the control group using the unpaired t test. j Comparison by Western blot of the PLGF protein levels in the cortex and the placenta of E20 embryos from the control group. ***p < 0.001 vs the control group using the unpaired t test
Fig. 2
Fig. 2
Effects of in utero alcohol exposure on protein expression of members from the VEGF/PLGF family. Quantification by Western blot of the effects of alcohol administered during the last gestational week on the placental expression of VEGF-A (a), PLGF (b), sVEGF-R1 (c), mVEGF-R1 (d), VEGF-R2 (e) and CD31 (f) at GD20. *p < 0.05 vs the control group using the unpaired t test. (g, h) Immunohistochemistry experiments illustrating the distribution of VEGF-R2 in the syncytiotrophoblast layers of the placenta co-labelled with Glut-1. Hoechst was used to label nuclei. (i) Quantification by ELISA of PLGF levels in the microdissected labyrinth zone of control and alcohol-exposed placentae. **p < 0.01 vs the control group using the Mann-Whitney test
Fig. 3
Fig. 3
Evans blue and hPLGF diffusion from the placenta to the fetal brain and effect of in utero PLGF repression on brain VEGF-R1 levels and cortical vasculature. (a, b) Time-course visualization of Evans blue administered by microinjection in the placenta of pregnant mice at GD15. Fluorescence was acquired by transUV illumination (a) and visualized with a false color scale (b). (c, d) Time-course visualization of Evans blue fluorescence in the brain of fetuses after a placental microinjection at GD15. Fluorescence was acquired by transUV illumination (c) and visualized with a false color scale (d). (e, f) Time-course quantification by spectrophotometry of the 595 nm absorbance of the Evans blue signal injected in placentae (e) and the follow-up in the corresponding fetal brains (f). (g) Quantification by ELISA of human PLGF in the brain of fetuses 30 min after injection in the placentas of pregnant mice at GD15. *p < 0.05 vs the control group using the unpaired t test. (h) Microphotograph visualizing eGFP expression 48 h after in utero transfection of placentae from GD15 pregnant mice with an eGFP encoding plasmid. (i, j) triple staining eGFP/Glut-1/Hoechst indicating that eGFP fluorescence (i) is mainly associated with the fetal trophoblastic layer (j) labelled with Glut-1 (arrow heads). Note that the maternal trophoblastic layer which is also labelled by Glut-1 is poorly transfected. The fetal side of the trophoblastic layers is identified by the presence of nucleated red blood cells characteristic of the fetal circulation (arrows). (k) Visualization by Western blot of PlGF, GFP and actin proteins in placentae from non-transfected (sh/GFP), GFP-transfected (sh/GFP+) and shPLGF/GFP transfected (sh+/GFP+) animals. (l, m) Quantification by Western blot of PLGF and GFP expression levels in placentae from non-transfected (sh/GFP), GFP-transfected (sh/GFP+) and shPLGF/GFP transfected (sh+/GFP+) animals four days post-transfection. (n) Quantification by Western blot of VEGF-R1 expression levels in the brain of fetuses from non-transfected (sh/GFP), GFP-transfected (sh/GFP+) and shPLGF/GFP-transfected (sh+/GFP+) placentae four days post-transfection. *p < 0.05 vs the “sh/GFP” group using the one way ANOVA test followed by Tukey’s post hoc test. (o-r) Visualization of the vasculature in the cortex of fetuses from non-transfected (sh/GFP) (o), GFP-transfected (sh/GFP+) (p) and shPLGF/GFP-transfected (sh+/GFP+) (q) placentae. Statistical analysis of vessel disorganization was performed using the χ2 test (r)
Fig. 4
Fig. 4
Effects of in utero PGF overexpression on fetal growth and cortical vasculature during prenatal alcohol exposure. (a, b) PGF CRISPR-dCas 9 activation approach coupled with in utero electroporation of the placenta was done at GD13 (a) and overexpression of PLGF controlled at GD20 (b). In the alcohol group, in utero exposure occurred from GD15 to GD20. (c, d) Visualization of E20 fetuses from pregnant mice exposed to NaCl (c) or alcohol (d). Note the small size of alcohol-exposed fetuses. Green bars indicate morphometric measures that have been done (head size (a); body size (b); abdomen size (c) and whole fetus size (a + b). (e, f) Visualization of E20 fetuses after in utero electroporation of PGF CRISPR-dCas9 plasmids in placentae from control (e) or alcohol-exposed pregnant mice (f). (g, h) Quantification of abdomen (g) and whole fetus (h) sizes in control (NaCl) and alcohol groups. In a same uterine horn some placentae were not electroporated (black bars), electroporated with control CRISPR-Cas9 plasmids (grey bars) or electroporated with PGF CRISPR-dCas9 plasmids (white bars). ##p < 0.01; ###p < 0.001; ####p < 0.0001 vs the control group and *p < 0.05; **p < 0.01; ****p < 0.0001 as indicated using the two way ANOVA test followed by Tukey’s post hoc test. (i-k) Visualization of the vasculature in the cortex of E20 fetuses from control (NaCl)/non-transfected (i), alcohol/control CRISPR-Cas9 transfected (j) and alcohol/ PGF CRISPR-dCas9 transfected (k) placentae. (l) Quantification of the percentage of radial vessels in the cortex of E20 fetuses from not electroporated (black bars), electroporated with control CRISPR-Cas9 plasmids (grey bars) and electroporated with PGF CRISPR-dCas9 plasmids (white bars) placentae. #p < 0.05 vs the control group and *p < 0.05 as indicated using the two way ANOVA test followed by Tukey’s post hoc test
Fig. 5
Fig. 5
Effects of in utero alcohol exposure on histomorphometric characteristics of human placentae and on the expression of proteins from the placental barrier, the energy metabolism and the VEGF/PLGF family. a, b Immunohistochemistry performed against CD31 and toluidine blue counterstaining visualizing microvessels (brown) present in placental villi (blue) from control and alcohol-exposed groups collected at gestational ages ranging from [35–42 WG]. Note the marked reduction of the luminal area of microvessels in the alcohol-exposed group. c Percentage of villi classified by sizes in placentae from control and alcohol-exposed groups collected at gestational ages ranging from [35–42 WG]. d Luminal vascular area per size of villi in placentae from control and alcohol-exposed groups collected at gestational ages ranging from [35–42 WG].*p < 0.05 vs the control group using the unpaired t test. e Time-course of the villous densities in placentae from control and alcohol-exposed groups for classes of gestational ages [20–25 WG], [25–35 WG] and [35–42 WG]. #### p < 0.0001 vs Ctrl [20–25 WG] after one way ANOVA analysis; ****p < 0.0001 between Control and Alcohol groups after impaired t test analysis. f Time-course of the vessel area in placentae from control and alcohol-exposed groups for classes of gestational ages [20–25 WG], [25–35 WG] and [35–42 WG].# p < 0.05 vs Ctrl [20–25 WG [after one way ANOVA analysis; *p < 0.05 between Control and Alcohol groups after impaired t test analysis. g-l Quantification by Western blot of ZO-1, MCT-1, PLGF, VEGFA, VEGF-R1 and VEGF-R2 protein levels in human placentae from control and alcohol-exposed groups. *p < 0.05 vs the control group using Mann and Whitney test
Fig. 6
Fig. 6
Brain/placenta comparisons of in utero alcohol-induced defects in human. (a-h) Comparative visualization of the vascular organization in the brains (a-d) and the placentae (e-h) of control and alcohol-exposed groups. Two developmental windows are shown: [21–22] WG and [10, 32, 33] WG. Statistical correlation between cortical and placental vascular impairments in patients from the control (i) and the alcohol-exposed groups (j)
Fig. 7
Fig. 7
Diagram summarizing the main effects of in utero alcohol exposure on the placenta and the fetal brain in mouse and human. a In the placenta, alcohol induced a decrease of PLGF expression in both mouse and human. This effect was associated with a decrease of VEGF-R1 levels in mouse. At a structural level, alcohol consumption altered the density of both villi and vessels in humans. The placental integrity was impacted by a decrease of the placental barrier marker ZO-1 and an increase of the energy metabolism marker MCT-1. b In the fetal brain, in utero alcohol exposure induced a disorganization of the cortical vasculature. Cortical VEGF-R1 levels were decreased, whereas PLGF was not detected. Recombinant human PLGF administered in the placenta reached the fetal brain. In utero repression of PGF transcription by shRNA mimicked the effects of alcohol on VEGF-R1 in the fetal brain while placental over-expression of the PGF gene induced macromorphic fetuses in the control group and rescued the effects of in utero alcohol exposure on vascular defects in the fetal brain. In human, vascular brain defects correlated with vascular placental defects.m,h indicate the experiments performed in mouse and/or human; WB, Western blot approach; IHC, immunohistochemistry

Similar articles

Cited by

References

    1. Autiero M, Waltenberger J, Communi D, Kranz A, Moons L, Lambrechts D, Kroll J, Plaisance S, De Mol M, Bono F, et al. Role of PlGF in the intra- and intermolecular cross talk between the VEGF receptors Flt1 and Flk1. Nat Med. 2003;9:936–943. doi: 10.1038/nm884. - DOI - PubMed
    1. Bakoyiannis I, Gkioka E, Pergialiotis V, Mastroleon I, Prodromidou A, Vlachos GD, Perrea D. Fetal alcohol spectrum disorders and cognitive functions of young children. Rev Neurosci. 2014;25:631–639. doi: 10.1515/revneuro-2014-0029. - DOI - PubMed
    1. Cao Y, Ji WR, Qi P, Rosin A, Cao Y. Placenta growth factor: identification and characterization of a novel isoform generated by RNA alternative splicing. Biochem Biophys Res Commun. 1997;235:493–498. doi: 10.1006/bbrc.1997.6813. - DOI - PubMed
    1. Carmeliet P, Moons L, Luttun A, Vincenti V, Compernolle V, De Mol M, Wu Y, Bono F, Devy L, Beck H, et al. Synergism between vascular endothelial growth factor and placental growth factor contributes to angiogenesis and plasma extravasation in pathological conditions. Nat Med. 2001;7:575–583. doi: 10.1038/87904. - DOI - PubMed
    1. Carmeliet P, Tessier-Lavigne M. Common mechanisms of nerve and blood vessel wiring. Nature. 2005;436:193–200. doi: 10.1038/nature03875. - DOI - PubMed

Publication types

MeSH terms

Substances