. 2017 Aug 1:627:1-9.
doi: 10.1016/j.abb.2017.05.019. Epub 2017 Jun 3.

Functional communication between PKC-targeted cardiac troponin I phosphorylation sites

Affiliations

Functional communication between PKC-targeted cardiac troponin I phosphorylation sites

Sarah E Lang et al. Arch Biochem Biophys. .

Abstract

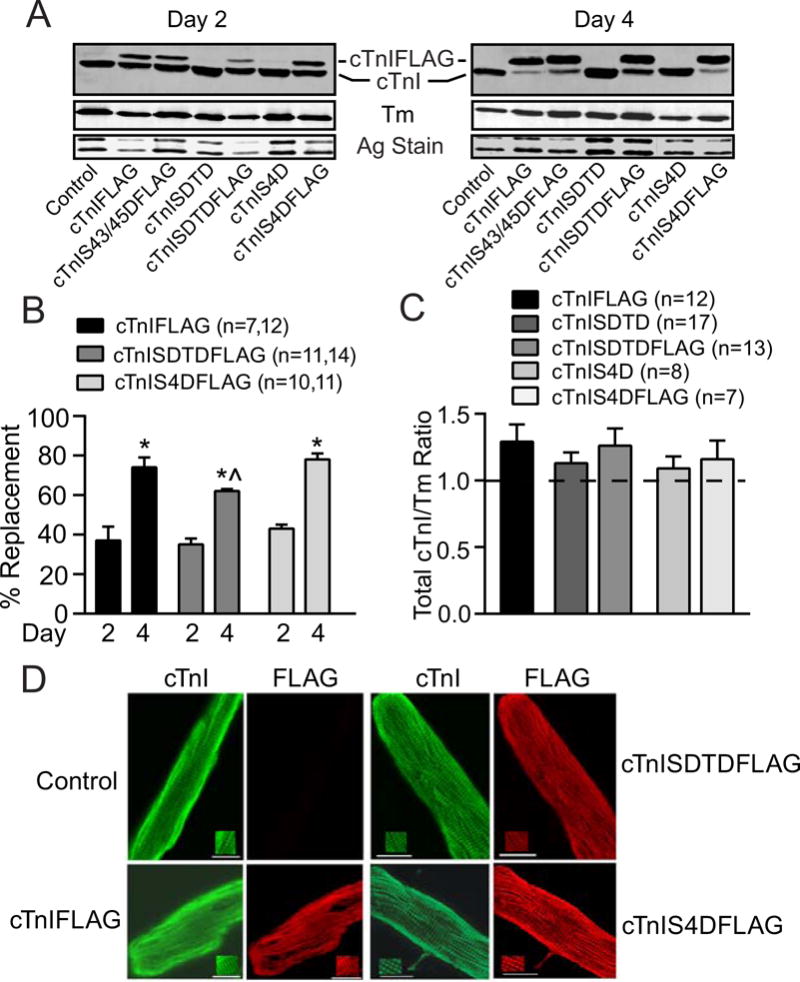
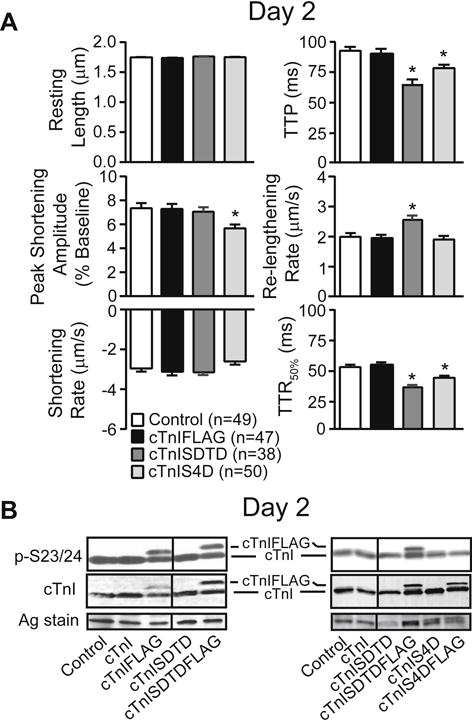
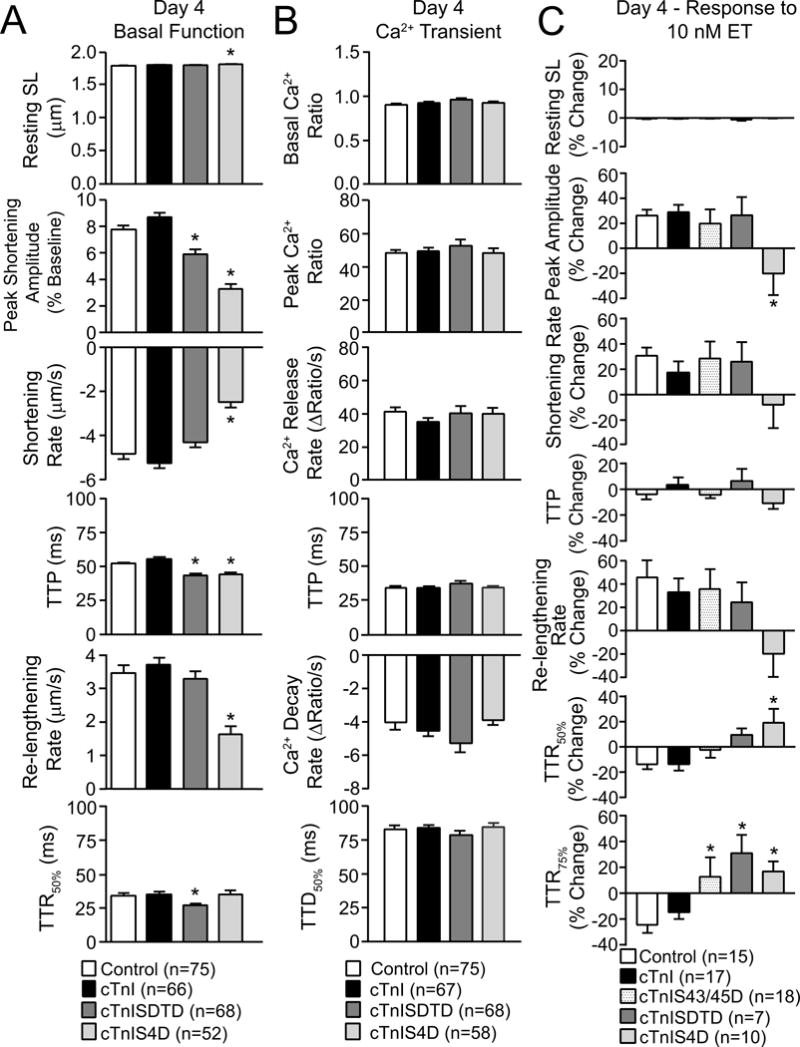
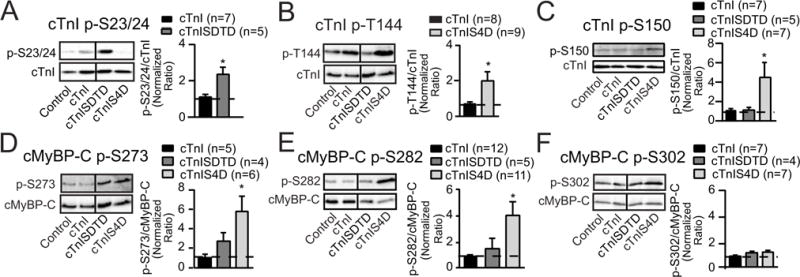
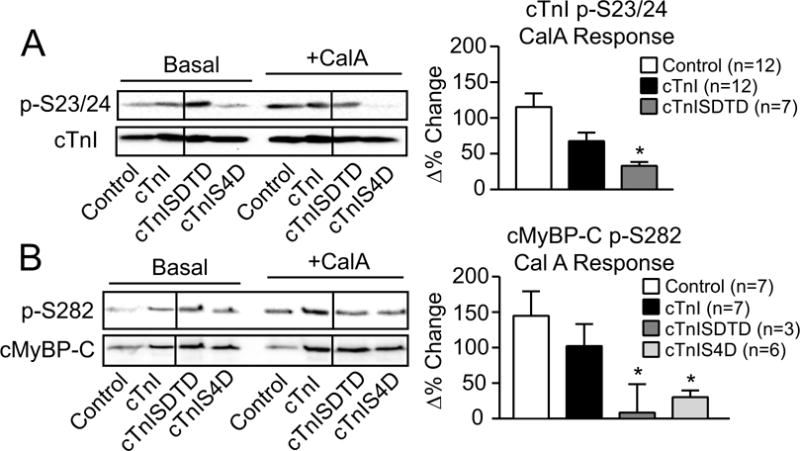
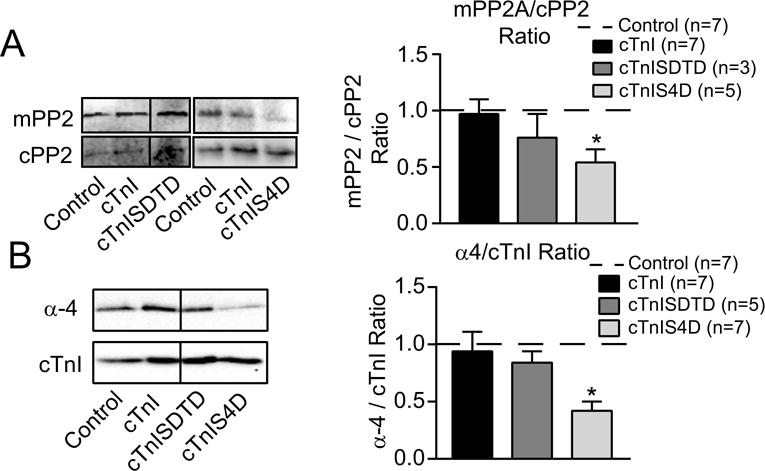
Increased protein kinase C (PKC) activity is associated with heart failure, and can target multiple cardiac troponin I (cTnI) residues in myocytes, including S23/24, S43/45 and T144. In earlier studies, cTnI-S43D and/or -S45D augmented S23/24 and T144 phosphorylation, which suggested there is communication between clusters. This communication is now explored by evaluating the impact of phospho-mimetic cTnI S43/45D combined with S23/24D (cTnIS4D) or T144D (cTnISDTD). Gene transfer of epitope-tagged cTnIS4D and cTnISDTD into adult cardiac myocytes progressively replaced endogenous cTnI. Partial replacement with cTnISDTD or cTnIS4D accelerated the time to peak (TTP) shortening and time to 50% re-lengthening (TTR50%) on day 2, but peak shortening was only diminished by cTnIS4D. Extensive cTnIS4D replacement continued to accelerate TTP, and decrease shortening amplitude, while TTR50% returned to baseline levels on day 4. In contrast, cTnISDTD modestly reduced shortening amplitude and continued to accelerate myocyte TTP and TTR50%. These results indicate cTnIS43/45 communicates with S23/24 and T144, with S23/24 exacerbating and T144 attenuating the S43/45D-dependent functional deficit. In addition, more severe functional alterations in cTnIS4D myocytes were accompanied by higher levels of secondary phosphorylation compared to cTnISDTD. These results suggest that secondary phosphorylation helps to maintain steady-state contractile function during chronic cTnI phosphorylation at PKC sites.

Keywords: Cardiac myocyte; Contractile function; Myofilament; Phosphorylation; Troponin I.


Figures

FIGURE 1
FIGURE 1. Protein expression, thin filament stoichiometry and sarcomere incorporation of cTnISDTD and cTnIS4D after gene transfer
A. Representative Western blots show cTnI (upper panel) and tropomyosin (Tm; middle panel) expression 2 and 4 days after gene transfer. A silver-stained (Ag stain) portion of gel also is included to indicate protein loading (lower panel). Gene transfer of FLAG-tagged cTnI, cTnI-S43/45D (30), -SDTD, and –S4D resulted in partial (left panel) and more extensive (right panel) replacement of endogenous cTnI 2 and 4 days after gene transfer, respectively. B. Quantitative analysis of FLAG-tagged cTnI, cTnISDTD, and cTnIS4D replacement of endogenous cTnI at 2 and 4 days post-gene transfer. Replacement was calculated as the percent FLAG-tagged/total cTnI ratio. FLAG-tagged expression increased significantly between days 2 and 4 for each construct (*p<0.05, 2-way ANOVA plus post-hoc Tukey), although cTnISDTDFLAG expression lagged behind cTnIFLAG on day 4 (^p<0.05). C. Quantitative analysis of thin filament stoichiometry based on total cTnI/Tm ratios in controls, myocytes expressing FLAG-tagged cTnI, and myocytes expressing either FLAG- or non-tagged cTnISDTD or cTnIS4D 4 days after gene transfer. The non-treated, time-matched control cTnI/Tm ratio is set to 1.0 for each blot and is indicated by a dotted line in this graph. The cTnI/Tm ratios observed for each construct are normalized to this control value and compared using a one-way ANOVA (p>0.05). The n in panels C and D indicate the number of rat samples analyzed in each group. D. Immunohistochemical staining for TnI (left; FITC) and FLAG (right; TR) in controls (upper left panels), and myocytes expressing cTnI-FLAG (lower left panels), -SDTDFLAG (upper right panels) and -S4DFLAG (lower right panels). Insets in each panel emphasize the striated patterns detected in each myocyte (bar =10μm). The detection of a comparable striated pattern in myocytes stained for TnI and FLAG Abs confirms there is sarcomere incorporation of each construct.
FIGURE 2
FIGURE 2. Myocyte contractile function and phosphorylation 2 days after gene transfer of cTnI-FLAG, -SDTD, and –S4D compared to non-treated controls
A. Analysis of signal averaged resting sarcomere length (SL, μm), peak shortening amplitude (expressed as a percent of resting length), shortening and re-lengthening rates (μm/s), along with the time to peak (TTP), and time to 50% re-lengthening (TTR50%) in 38–50 myocytes per group (6–8 hearts/group), as described earlier (24). Results were compared to control values using 1-way ANOVA and post-hoc Newman-Keuls tests, with statistical significance set at p<0.05 (*). B. Representative Westerns show results for cTnI p-S23/24 and total cTnI in control, cTnI, cTnISDTD ± FLAG, and cTnIS4D ± FLAG expressing myocytes 2 days after gene transfer. The response for cTnISDTDFLAG is compared to cTnIFLAG in the left panel, and the responses for cTnISDTDFLAG and cTnIS4DFLAG are shown in the right panel. The relative p-S23/24 levels remain similar to control values for myocytes expressing each of the phospho-mimetics 2 days after gene transfer. A silver (Ag) stained portion of each gel also is shown to indicate protein loading in each lane. Vertical black lines in each blot indicate a separation between cTnI or cTnI-FLAG and -SDTD on the same blot.
FIGURE 3
FIGURE 3. Analysis of basal contractile function (A), Ca2+ transients (B), and the contractile response to endothelin (ET; C) 4 days after gene transfer
Adult myocytes from control, cTnI, cTnISDTD and cTnIS4D expressing myocytes were loaded with Fura-2AM 4 days after gene transfer and analyzed for basal contractile function (A), as described in Figure 2, plus Ca2+ transients (B). For the Ca2+ transient analysis, basal and peak Ca2+ ratios, Ca2+ release and decay rates (ΔRatio/s), and the time to 50% Ca2+ decay (TTD50%; ms) were measured in each myocyte. C. Contractile function responses before and after ET also were evaluated in the same groups plus myocytes expressing cTnIS43/45D. ET responses are expressed as the percent change in resting SL, peak amplitude, rates of shortening and re-lengthening, and TTP, TTR50% and TTR75% after ET. The TTR75% response is included in this panel due to the significant differences detected for all 3 phospho-mimetic substitutions compared to controls. In each panel, responses in cTnI-, cTnISDTD- and cTnIS4D-expressing myocytes were compared to controls, with significance set at *p<0.05.
FIGURE 4
FIGURE 4. Phosphorylation of myofilament cTnI and cMyBP-C residues 4 days after gene transfer
Representative immunoblots (left panels) and quantitative analysis (right panels) of phosphorylated cTnI -S23/24 (p-S23/24; A), -T144 (p-T144, B) and -S150 (p-S150, C) relative to total cTnI expression (lower panels) in controls and myocytes expressing cTnI, cTnISDTD or cTnIS4D 4 days post-gene transfer. The ratios of phosphorylated/total cTnI in each panel are normalized to control ratios, which are set to 1.0 (dotted line in each graph) for each quantitative analysis (30). The ratios in cTnISDTD- and/or cTnIS4D-expressing myocytes were compared to myocytes expressing cTnI after gene transfer, with statistical significance set at p<0.05 (*). This Western analysis also shows the expected reduction in p-S23/24 and p-T144 after replacement with cTnIS4D and cTnISDTD, respectively. Due to this reduction, p-S23/24 in cTnIS4D- and p-T144 in cTnISDTD- expressing myocytes were not quantitatively analyzed in their respective panels. Representative immunoblots shown in panels D–F show site-specific phosphorylation of cMyBP-C in the same groups of day 4 myocytes shown in A–C. Immunoblots (left panels) and quantitative analysis (right panels) are shown for phosphorylated cMyBP-C -S273 (p-S273, D), -S282 (p-S282, E), and -S302 (p-S302, F). Detection of the specific phosphorylated residue (left panels) is shown in the upper blot and total cMyBP-C in the lower panel. Quantitative analysis was performed using the normalized phosphorylated/total cMyBP-C ratio in each group, with the control ratio set to 1.0 (indicated by dashed line). Results in each panel were compared to cTnI expressing myocytes, with statistical significance set at p<0.05 (*). Vertical black lines shown in Western blots in this figure and in Figures 5 and 6 indicate a separation between cTnI and cTnISDTD on the same blot.
FIGURE 5
FIGURE 5. Secondary myofilament phosphorylation in the presence and absence of phosphatase inhibition by calyculin A (calA)
Representative Western (left panel) and quantitative (right panel) analyses of cTnI p-S23/24 (A) and cMyBP-C p-S282 (B) in the absence and presence of the phosphatase inhibitor calA (10 nM) and expressed relative to total cTnI and cMyBP-C, respectively. The ratio of phosphorylated/total protein is normalized to control values (set to 1.0) in the absence of calyculin A (CalA) for the quantitative analysis. Then, control responses to calA (Δ% change) on day 4 are compared to responses in cTnI-, cTnISDTD- and cTnIS4D-expressing myocytes, with the Δ% response shown in each right panel graph. The p-S23/24 and p-S282 levels after calA treatment are not different among groups. The Δ% change in the p-S23/24/cTnI and the p-S282/cMyBP-C ratios were analyzed by ANOVA (see Methods) with statistical significance set at p<0.05 (*). Note the absence of p-S23/24 detection in the cTnIS4D response (panel A). Any p-S23/24 detection in cTnIS4D myocytes is due to residual endogenous cTnI expression and not explained by calA treatment.
FIGURE 6
FIGURE 6. Analysis of phosphatase activity and stability in myocytes expressing cTnISDTD and cTnIS4D compared to controls and cTnI
A. Western analysis of methylated protein phosphatase 2A (mPP2; upper left panel) and PP2A catalytic subunit (cPP2; lower left panel) along with the quantitative analysis of the mPP2/cPP2 ratio (right panel) for cTnISDTD and cTnIS4D. Blots were initially probed for mPP2, stripped and re-probed for cPP2, and then stained with Sypro stain. Then, the cPP2/Sypro band ratios were normalized to control values on the same blot (set to 1.0, n=7) and these ratios were not different between groups (cPP2/Sypro ratio: cTnI 1.11+0.15, n = 7; cTnISDTD 1.30+0.86, n = 3; cTnIS4D 1.15+0.23, n = 5). The ratio of mPP2/normalized cPP2 ratio was determined for the quantitative analysis shown in the right panel. B. Representative Western analysis of alpha-4 (a-4; left upper panel) relative to cTnI (lower left panel), plus the quantitative analysis of a-4/cTnI ratio (right panel) in day 4 myocytes. Each set of results was statistically analyzed by ANOVA (see Methods) with significance set at p<0.05 (*).

Similar articles

Cited by

References

    1. Andrew CD, Warwicker J, Jones GR, Doig AJ. Effect of phosphorylation on alpha-helix stability as a function of position. Biochemistry. 2002;41:1897–1905. - PubMed
    1. Bayer AL, Heidkamp MC, Patel N, Porter M, Engman S, Samarel AM. Alterations in protein kinase C isoenzyme expression and autophosphorylation during the progression of pressure overload-induced left ventricular hypertrophy. Mol Cell Biochem. 2003;242:145–152. - PubMed
    1. Bilchick KC, Duncan JG, Ravi R, Takimoto E, Champion HC, Gao WD, Stull LB, Kass DA, Murphy AM. Heart failure-associated alterations in troponin I phosphorylation impair ventricular relaxation-afterload and force-frequency responses and systolic function. Am J Physiol Heart Circ Physiol. 2007;292:H318–325. - PubMed
    1. Bowling N, Walsh RA, Song G, Estridge T, Sandusky GE, Fouts RL, Mintze K, Pickard T, Roden R, Bristow MR, Sabbah HN, Mizrahi JL, Gromo G, King GL, Vlahos CJ. Increased protein kinase C activity and expression of Ca2+-sensitive isoforms in the failing human heart. Circulation. 1999;99:384–391. - PubMed
    1. Braz JC, Gregory K, Pathak A, Zhao W, Sahin B, Klevitsky R, Kimball TF, Lorenz JN, Nairn AC, Liggett SB, Bodi I, Wang S, Schwartz A, Lakatta EG, DePaoli-Roach AA, Robbins J, Hewett TE, Bibb JA, Westfall MV, Kranias EG, Molkentin JD. PKC-alpha regulates cardiac contractility and propensity toward heart failure. Nat Med. 2004;10:248–254. - PubMed

Publication types

LinkOut - more resources