

Inactivation of γ-secretases leads to accumulation of substrates and non-Alzheimer neurodegeneration
- PMID: 28588032
- PMCID: PMC5538297
- DOI: 10.15252/emmm.201707561
Inactivation of γ-secretases leads to accumulation of substrates and non-Alzheimer neurodegeneration
Abstract
γ-Secretases are a family of intramembrane cleaving aspartyl proteases and important drug targets in Alzheimer's disease. Here, we generated mice deficient for all γ-secretases in the pyramidal neurons of the postnatal forebrain by deleting the three anterior pharynx defective 1 (Aph1) subunits (Aph1abc cKO Cre+). The mice show progressive cortical atrophy, neuronal loss, and gliosis. Interestingly, this is associated with more than 10-fold accumulation of membrane-bound fragments of App, Aplp1, Nrg1, and Dcc, while other known substrates of γ-secretase such as Aplp2, Lrp1, and Sdc3 accumulate to lesser extents. Despite numerous reports linking neurodegeneration to accumulation of membrane-bound App fragments, deletion of App expression in the combined Aph1 knockout does not rescue this phenotype. Importantly, knockout of only Aph1a- or Aph1bc-secretases causes limited and differential accumulation of substrates. This was not associated with neurodegeneration. Further development of selective Aph1-γ-secretase inhibitors should be considered for treatment of Alzheimer's disease.
Keywords: Alzheimer's disease; Aph1 subunit; selective inhibition; side effects; γ‐Secretase.
© 2017 The Authors. Published under the terms of the CC BY 4.0 license.
Figures

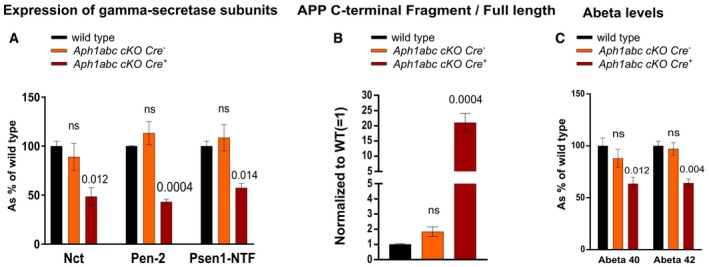
Cortical lysates from wild‐type, Aph1abc cKO Cre −, and Aph1abc cKO Cre + were analyzed by immunoblotting using antibodies against Nct, Pen‐2, and Psen1 NTF. Protein levels were standardized with β‐actin and normalized to wild types. Mean, SEM, and P‐values of 6 animals per genotype are shown. Differences in protein expression between wild‐type and Aph1abc cKO Cre − or Aph1abc cKO Cre + were computed using one‐way ANOVA per protein, followed by FDR P‐value adjustment of a Dunnett's post hoc test.
Cortical lysates from wild‐type, Aph1abc cKO Cre −, and Aph1abc cKO Cre + were analyzed by immunoblotting using antibodies against App C‐terminus. Protein levels were quantified and FL/CTF ratios are plotted normalized to wild‐type controls. Mean, SEM, and P‐values of six animals per genotype are shown. One‐way ANOVA per protein, followed by FDR P‐value adjustment of the P‐values obtained from a Dunnett's post hoc test.
Cortical lysates from seven wild‐type, seven Aph1abc cKO Cre −, and seven Aph1abc cKO Cre + mice were analyzed by Aβ ELISA. Aβ levels were normalized to wild types. Mean, SEM, and P‐values of seven animals are shown. One‐way ANOVA per protein, followed by FDR P‐value adjustment of a Dunnett's post hoc test. ns = not statistically significant.

Hematoxylin/eosin staining of sagittal brain slices of 9‐month‐old mice. Upper panel scale bar = 1,100 μm; lower panel scale bar = 195 μm. Cortical atrophy is present in Aph1abc cKO Cre + mice, whereas absent in Aph1abc cKO Cre − mice.
NeuN, Iba1 and Gfap immunofluorescent labeling of parietal cortex of 9‐month‐old mice. Scale bar = 115 μm. Full cortical thickness counts of NeuN‐positive cells, as determined via NeuN staining, was decreased in Aph1abc cKO Cre + mice. Reactive gliosis, as determined via Gfap and Iba1 staining, is present in Aph1abc cKO Cre + mice, whereas absent in Aph1abc cKO Cre − mice.

Cortical lysates from six wild‐type, six Aph1a cKO Cre +, and six Aph1bc cKO Cre + mice were analyzed by immunoblotting using antibodies against Nct, Pen‐2 and Psen1‐NTF. Protein levels were standardized with β‐actin and normalized to wild type.
Cortical lysates from six wild‐type, six Aph1a cKO Cre +, and six Aph1bc cKO Cre + mice were analyzed by immunoblotting using antibodies against App C‐terminus. Protein levels were quantified and FL/CTF ratios are plotted normalized to wild‐type control.
Cortical lysates from seven wild‐type, seven Aph1a cKO Cre +, and seven Aph1bc cKO Cre + mice were analyzed by Aβ ELISA. Aβ levels were normalized to wild type.

Hematoxylin/eosin staining of sagittal brain slices of 6‐month‐old mice. Scale bar = 195 μm. Cortical atrophy is absent in Aph1a cKO Cre + and Aph1bc cKO Cre + brains.
NeuN, Iba1, and Gfap immunofluorescent labeling of parietal cortex. Scale bar = 115 μm. Full cortical thickness counts of NeuN‐positive cells, as determined via NeuN staining, was comparable in control, Aph1a cKO Cre +, and Aph1bc cKO Cre + mice. Reactive gliosis, as determined via Gfap and Iba1 staining, is absent in Aph1a cKO Cre + and Aph1bc cKO Cre + mice.
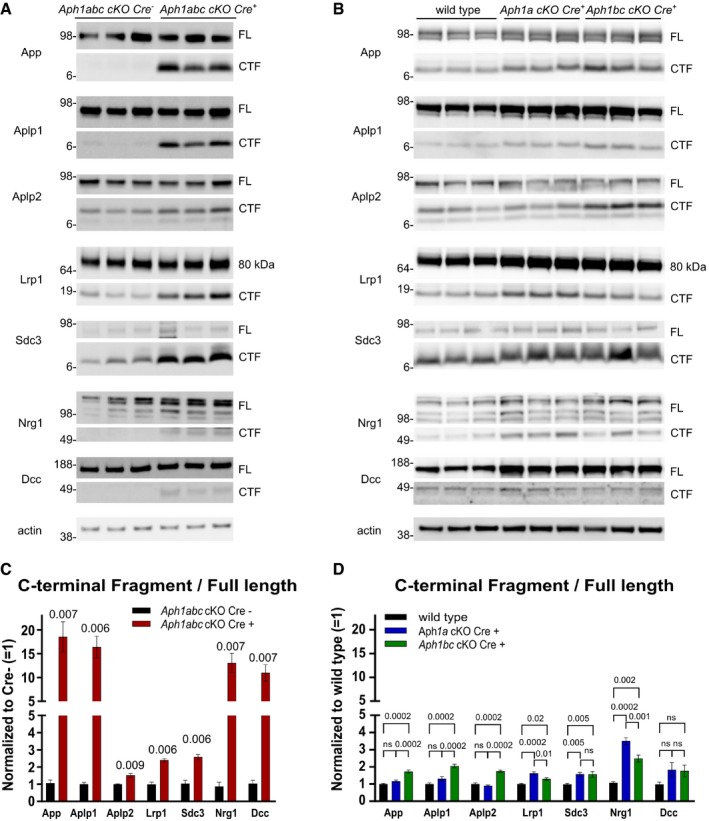
Western blot analysis of hippocampal lysates from Aph1abc cKO Cre − and Aph1abc cKO Cre + mice, three representative samples are shown. Five mice per genotype were analyzed.
Western blot analysis of hippocampal lysates from wild‐type, Aph1a cKO Cre + , and Aph1bc cKO Cre +, three representative samples are shown. Ten mice per genotype were analyzed.
FL and CTF protein levels in panel (A) were quantified and FL/CTF ratios are plotted, normalized to Aph1abc cKO Cre − controls. Significant differences in protein expression between controls and Aph1abc cKO Cre + mice were assessed using Student's t‐test per protein (GraphPad), followed by false discovery rate (FDR) P‐value adjustments (R, version 3.3.1) to correct for multiple protein testing. Mean, SEM, and P‐values are shown, ns = not statistically significant, N = 5.
FL and CTF protein levels in panel (B) were quantified and FL/CTF ratios are plotted, normalized to wild‐type controls. Differences in protein expression between wild‐type, Aph1a cKO Cre +, and Aph1bc cKO Cre + were computed using one‐way ANOVA per protein, followed by FDR P‐value adjustment of the Tukey's post hoc test. Mean, SEM, and P‐values are shown, ns = not statistically significant, N = 10.
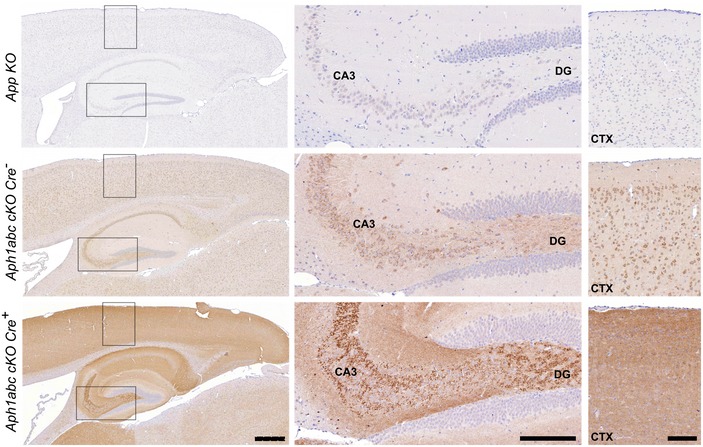

Hematoxylin/eosin staining of sagittal brain slices of 9‐month‐old mice. Scale bar = 195 μm. Progressive cortical atrophy is present to the same extent in Aph1abc cKO Cre + and Aph1abc cKO Cre + × App KO mice, whereas absent in control and App KO mice.
NeuN, Iba1, and Gfap immunofluorescent labelings of parietal cortex. Scale bar = 115 μm. Full cortical thickness counts of NeuN‐positive cells, as determined via NeuN staining, was comparable in control and App KO mice, whereas decreased to the same extent in Aph1abc cKO Cre + and Aph1abc cKO Cre + × App KO mice. Reactive gliosis, as determined via Gfap and Iba1 staining, is present to the same extent in Aph1abc cKO Cre + and Aph1abc cKO Cre + × App KO mice, whereas absent in control and App KO mice.

References
-
- Annaert WG, Esselens C, Baert V, Boeve C, Snellings G, Cupers P, Craessaerts K, De Strooper B (2001) Interaction with telencephalin and the amyloid precursor protein predicts a ring structure for presenilins. Neuron 32: 579–589 - PubMed
-
- Beglopoulos V, Sun X, Saura CA, Lemere CA, Kim RD, Shen J (2004) Reduced beta‐amyloid production and increased inflammatory responses in presenilin conditional knock‐out mice. J Biol Chem 279: 46907–46914 - PubMed
-
- Bentahir M, Nyabi O, Verhamme J, Tolia A, Horre K, Wiltfang J, Esselmann H, Strooper B (2006) Presenilin clinical mutations can affect gamma‐secretase activity by different mechanisms. J Neurochem 96: 732–742 - PubMed
MeSH terms
Substances
Grants and funding
LinkOut - more resources
Full Text Sources
Other Literature Sources
Medical
Molecular Biology Databases
Miscellaneous
