

Salt-inducible kinase induces cytoplasmic histone deacetylase 4 to promote vascular calcification
- PMID: 28588072
- PMCID: PMC5494505
- DOI: 10.15252/embr.201643686
Salt-inducible kinase induces cytoplasmic histone deacetylase 4 to promote vascular calcification
Abstract
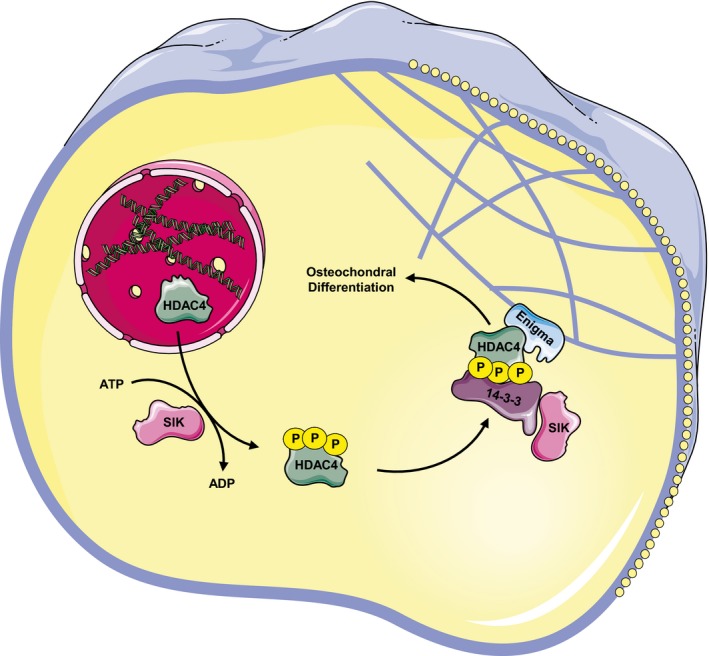
A pathologic osteochondrogenic differentiation of vascular smooth muscle cells (VSMCs) promotes arterial calcifications, a process associated with significant morbidity and mortality. The molecular pathways promoting this pathology are not completely understood. We studied VSMCs, mouse aortic rings, and human aortic valves and showed here that histone deacetylase 4 (HDAC4) is upregulated early in the calcification process. Gain- and loss-of-function assays demonstrate that HDAC4 is a positive regulator driving this pathology. HDAC4 can shuttle between the nucleus and cytoplasm, but in VSMCs, the cytoplasmic rather than the nuclear activity of HDAC4 promotes calcification, and a nuclear-localized mutant of HDAC4 fails to promote calcification. The cytoplasmic location and function of HDAC4 is controlled by the activity of salt-inducible kinase (SIK). Pharmacologic inhibition of SIK sends HDAC4 to the nucleus and inhibits the calcification process in VSMCs, aortic rings, and in vivo In the cytoplasm, HDAC4 binds and its activity depends on the adaptor protein ENIGMA (Pdlim7) to promote vascular calcification. These results establish a cytoplasmic role for HDAC4 and identify HDAC4, SIK, and ENIGMA as mediators of vascular calcification.
Keywords: histone deacetylase; smooth muscle cell; vascular calcification.
© 2017 The Authors.
Figures
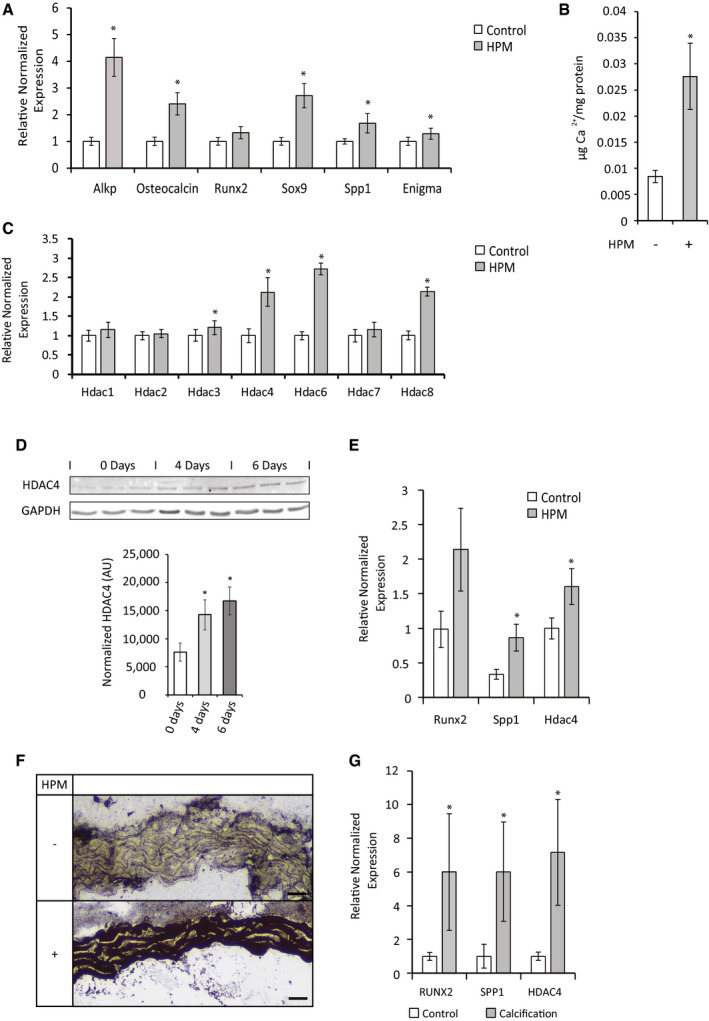
qRT–PCR gene expression analysis of osteochondrogenic markers in VSMCs following 7‐day treatment with high phosphate media (HPM) (gray) or control media (white). Data are shown as means ± SEM (n = 6), normalized to control. Two‐tailed unpaired Student's t‐test, *P < 0.05.
O‐cresolphthalein calcium colorimetric assay, normalized to protein concentration, of VSMCs after 2 weeks in HPM (gray) or control media (white). Data are shown as means ± SEM (n = 9). Two‐tailed unpaired Student's t‐test, *P < 0.05.
qRT–PCR gene expression analysis of HDACs in VSMCs following 7‐day treatment with high phosphate media (HPM) (gray) or control media (white). Data are shown as means ± SEM (n = 6), normalized to control. Two‐tailed unpaired Student's t‐test, *P < 0.05.
Western blot analysis and quantification of HDAC4 protein levels in VSMCs after 4 or 6 days of HPM treatment. HDAC4 levels were normalized to GAPDH levels in arbitrary density units (AU). Data are shown as means ± SEM (n = 3). Two‐tailed unpaired Student's t‐test, *P < 0.05.
qRT–PCR gene expression analysis of osteochondrogenic markers and HDAC4 in the mouse aortic rings assay treated for 14 days with (gray) or without (white) HPM. Data are shown as means ± SEM (n = 4), relative to zero. Two‐tailed unpaired Student's t‐test, *P < 0.05.
Representative images of histological sections of aortic rings grown for 14 days in control medium or HPM, stained black for calcium using Von Kossa stain. Scale bar = 10 μm.
qRT–PCR gene expression analysis of osteochondrogenic markers and HDAC4 in calcified human aortic valves compared to controls. Data are shown as means ± SEM (n = 3), normalized to control. Two‐tailed unpaired Student's t‐test, *P < 0.05.
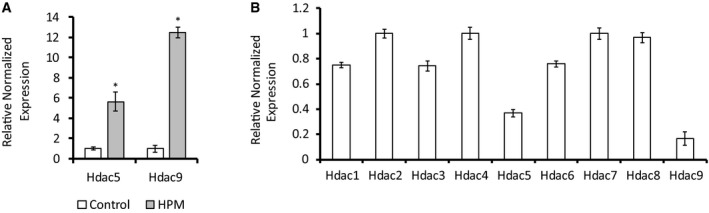
Gene expression qRT–PCR analysis of HDAC5 and HDAC9 in VSMCs following treatment with high phosphate media (HPM) (gray) or control media (white). Data are shown as means ± SEM (n = 6), normalized to control, with two‐tailed unpaired Student's t‐test, *P < 0.05.
Expression levels of HDACs 1–9 in VSMCs grown in control media analyzed using qRT–PCR. Data are shown as means ± SEM (n = 6), relative to zero.
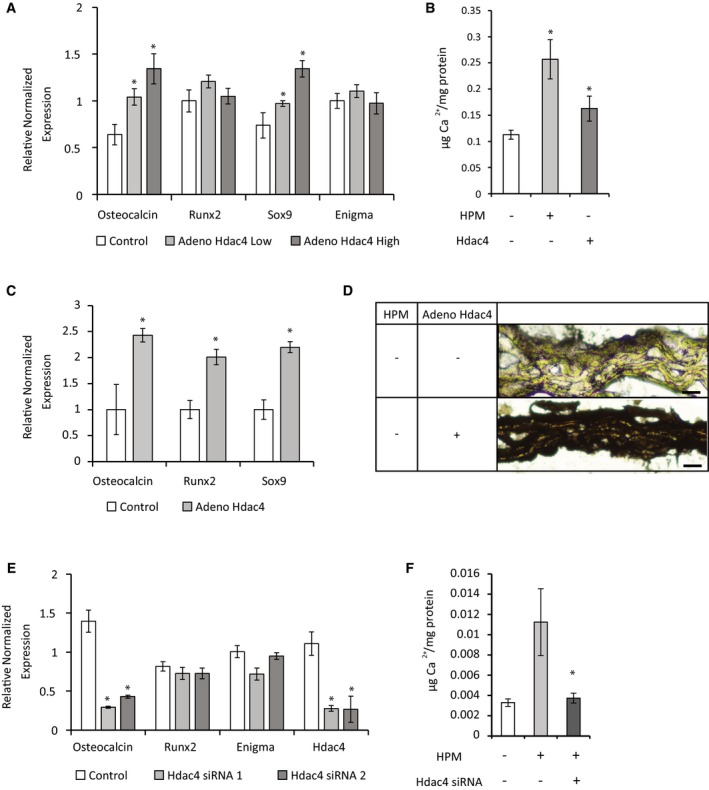
VSMCs were transduced with two different concentrations of adenoviral vector encoding for Flag‐tagged HDAC4 or control beta‐gal virus. Gene expression qRT–PCR analysis of calcification markers was performed. Data are shown as means ± SEM (n = 6), relative to zero. Two‐tailed unpaired Student's t‐test, *P < 0.05 vs. control.
O‐cresolphthalein calcium colorimetric assay of VSMCs after 2 weeks of control media (white) or HPM (light gray), or VSMCs transfected with HDAC4 in control media (dark gray). Data are shown as means ± SEM (n = 6), normalized to protein concentration. Two‐tailed unpaired Student's t‐test, *P < 0.05 vs. control.
Aortic rings were transduced with adenoviral vector encoding for Flag‐tagged HDAC4 or control beta‐gal and were grown for 14 days in control media. Osteochondrogenic markers were analyzed using qRT–PCR gene expression. Data are shown as means ± SEM (n = 6), normalized to control. Two‐tailed unpaired Student's t‐test, *P < 0.05.
Histological sections of control beta‐gal or HDAC4 transduced aortic rings in control medium after 14 days, stained black for calcium with Von Kossa stain. Representative images are shown. Scale bar = 20 μm.
VSMCs were transfected with two different siRNAs for HDAC4 or with control siRNA. Gene expression qRT–PCR analysis shows similar level of knockdown of HDAC4 for the two siRNAs and inhibition of the osteochondrogenic marker Osteocalcin. Data are shown as means ± SEM (n = 5), relative to zero. Two‐tailed unpaired Student's t‐test, *P < 0.05 vs. control.
O‐cresolphthalein calcium colorimetric assay of VSMCs transfected with scrambled siRNA after 2 weeks treatment with control media (white) or HPM (light gray), or VSMCs transfected with HDAC4 siRNA in HPM (dark gray). Data are shown as means ± SEM (n = 8), normalized to protein concentration. Two‐tailed unpaired Student's t‐test, *P < 0.05 vs. control siRNA.
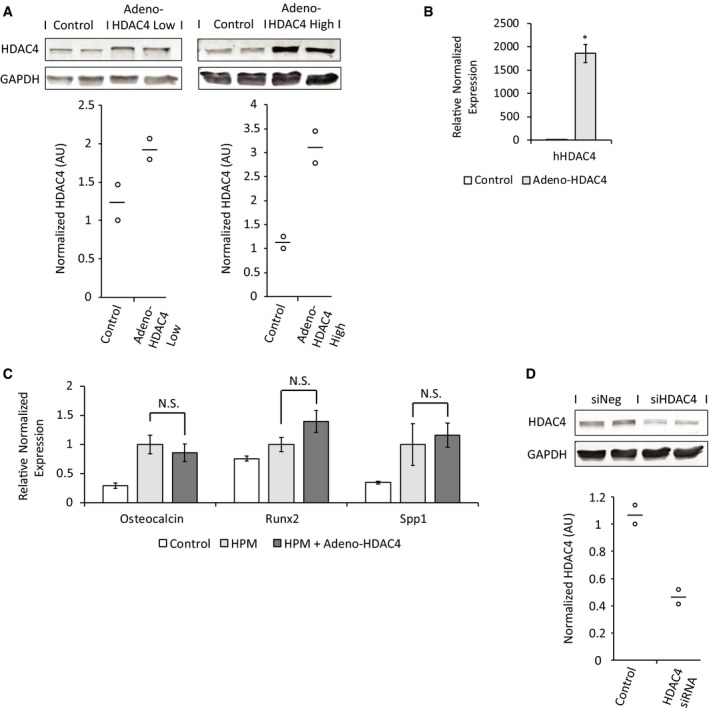
Western blot analysis and quantification showing the degree of HDAC4 protein overexpression after viral transduction in VSMCs. Data are shown as single data points and mean (n = 2).
qRT–PCR with human‐specific HDAC4 primers in aortic rings showing effective viral transduction of Ad‐HDAC4. This analysis, however, cannot be used to quantify the degree (fold‐ratio) of HDAC4 overexpression over endogenous mouse HDAC4, since the level of human HDAC4 in control rings is zero. Data are shown as means ± SEM (n = 6), normalized to control. Two‐tailed unpaired Student's t‐test, *P < 0.05.
Aortic rings were transduced with adenoviral vector encoding for Flag‐tagged HDAC4 or control beta‐gal and were grown in HPM or control media. Gene expression qRT–PCR analysis for osteochondrogenic markers was performed. Data are shown as means ± SEM (n = 4), relative to zero. Two‐tailed unpaired Student's t‐test. N.S., P > 0.05.
Western blot analysis and quantification showing the degree of HDAC4 protein knockdown in VSMCs in response to HDAC4 siRNA transfection. Data are shown as single data points and mean (n = 2).
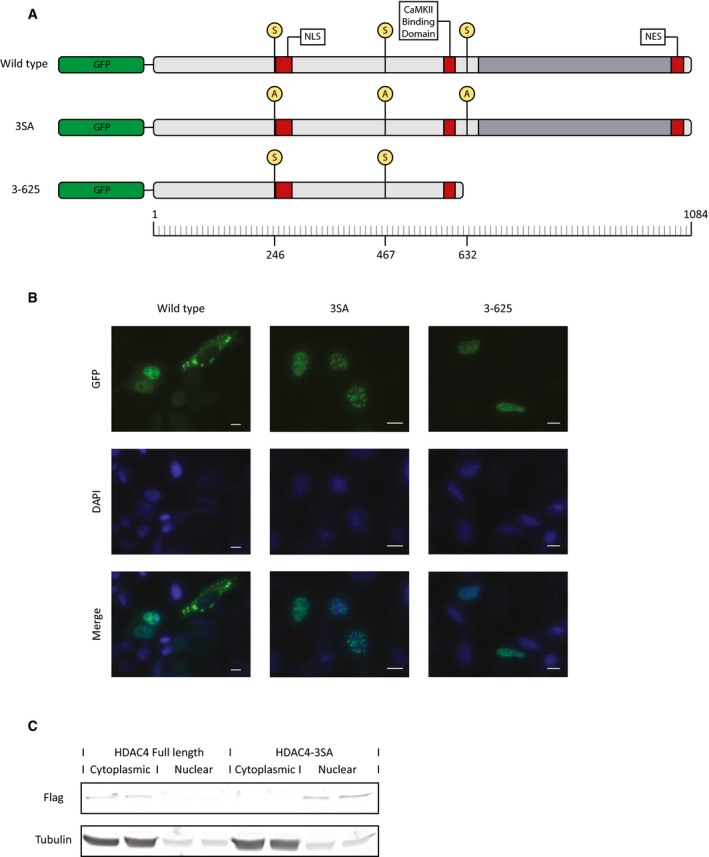
GFP‐tagged constructs of HDAC4: Wild‐type, full‐length HDAC4 protein; 3SA, full‐length HDAC4 protein, in which three amino acids (Ser246, Ser467, and Ser632) were mutated to alanine; 3–625, the N‐terminal fragment of HDAC4‐containing amino acids 3‐625 of the protein that includes the NLS but not the NES.
HeLa cells were transfected with the different HDAC4 constructs to examine their intracellular localization. Cells were fixed with formaldehyde, and nuclei were counterstained with DAPI. High magnification representative images are shown. Scale bar = 10 μm.
VSMCs were transduced with adenoviral vector encoding for Flag‐tagged HDAC4 or Flag‐tagged 3SA HDAC4. Cytoplasmic and nuclear protein extracts were obtained and Western blot was performed using anti‐Flag antibody. Anti‐tubulin immunoblot was used as a loading control and to mark the cytoplasmic fraction.
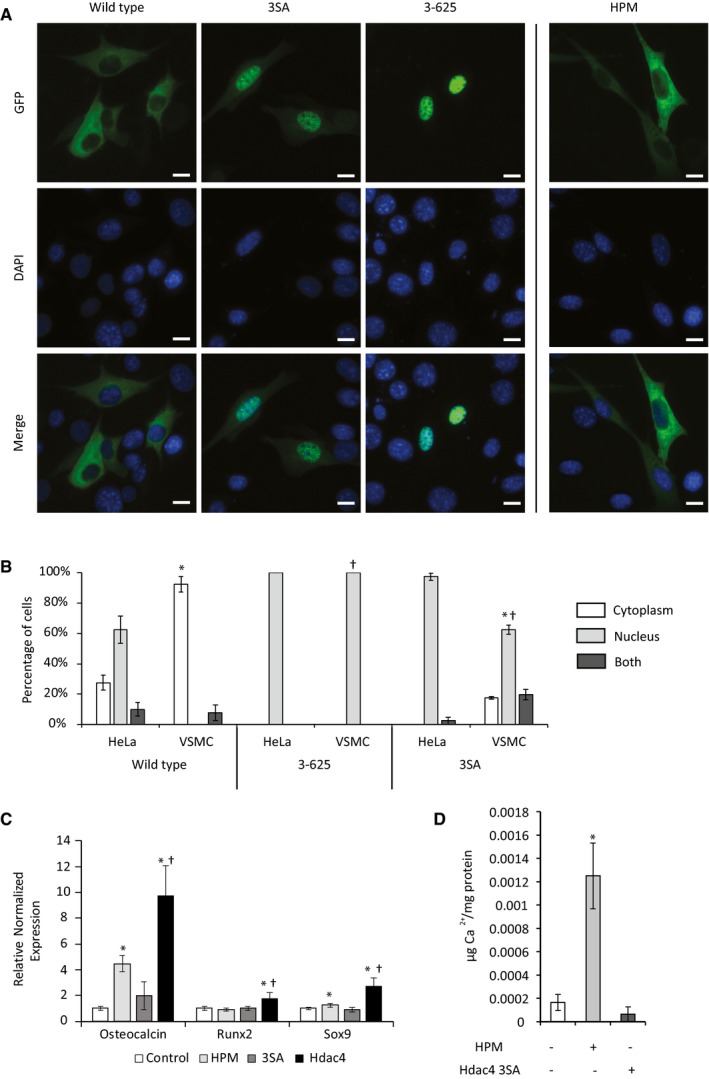
VSMCs were transfected with the indicated HDAC4 constructs (Fig EV3A) to examine their intracellular localization. VSMCs transfected with the wild‐type HDAC4 were also grown in HPM to observe its effect on HDAC4 localization. Nuclei were counterstained with DAPI. High magnification representative images are shown, demonstrating that wild‐type HDAC4 was exclusively cytoplasmic in control and HPM media, and the 3SA and 3‐625 HDAC4 constructs are entirely nuclear. Scale bar = 10 μm.
VSMCs or control HeLa epithelial cells were transfected with the indicated HDAC4‐GFP constructs. DAPI staining was used to mark the nucleus. HDAC4 localization was scored automatically using CellProfiler analysis software as being exclusively cytoplasmic (white), exclusively nuclear (light gray), or as occupying both a cytoplasmic and nuclear localization (dark gray). Data are shown as means ± SD (n = 80 cells at least in each group). Chi‐square proportion test, *P < 0.001 between VSMCs and HeLa cells for each construct, †P < 0.001 between indicated construct distribution and wild‐type HDAC4 in VSMCs.
VSMCs were transfected with wild‐type HDAC4 or 3SA HDAC4 and grown in normal media for 7 days, or HPM as a positive control. qRT–PCR analysis of osteochondrogenic markers is shown. Data are shown as means ± SEM (n = 9), normalized to control. Two‐tailed unpaired Student's t‐test, *P < 0.05 vs. control, †P < 0.05 vs. 3SA HDAC4.
O‐cresolphthalein calcium colorimetric assay of VSMCs transfected with lacZ in control media (white) or HPM (light gray), or VSMCs transfected with 3SA HDAC4 in control media (dark gray). Data are shown as means ± SEM (n = 8), normalized to protein concentration. Two‐tailed unpaired Student's t‐test, *P < 0.05.
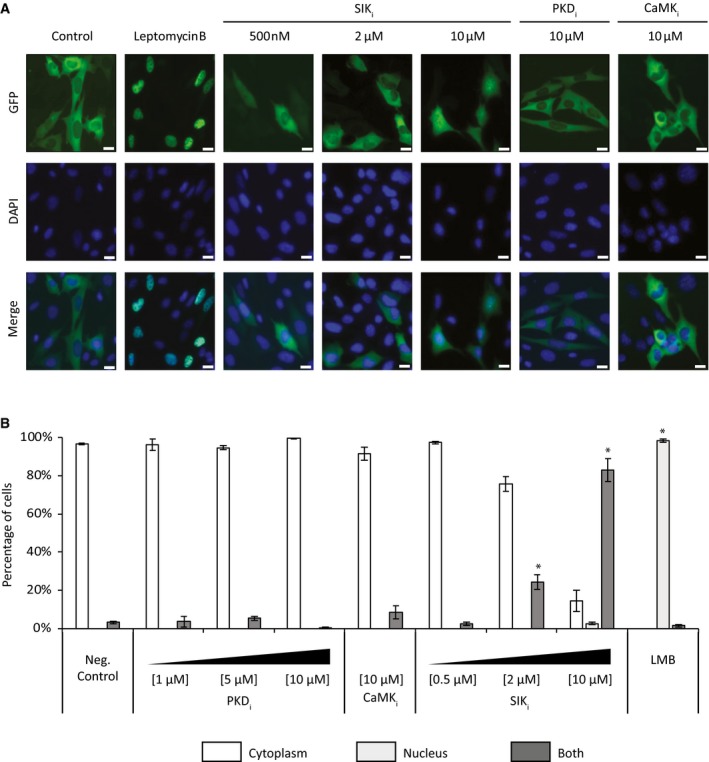
Representative images of VSMCs transfected with wild‐type GFP‐HDAC4 and treated with the indicated inhibitor and concentration: LMB, leptomycin B; PKDi, CID 2011756; CaMKi, KN‐93; SIKi, HG‐9‐91‐01. DAPI staining was used to mark the nucleus. The nuclear export inhibitor leptomycin B was used as a positive control and induced nuclear accumulation of GFP‐HDAC4. The pan‐SIK inhibitor induced dose‐dependent nuclear accumulation of GFP‐HDAC4. Scale bar = 10 μm.
HDAC4 localization was scored automatically as being exclusively cytoplasmic (white), exclusively nuclear (light gray) or as occupying both a cytoplasmic and nuclear localization (dark gray). Data are shown as means ± SD (n = 250 cells at least in each group). Chi‐square proportion test, *P < 0.001 vs. negative control.
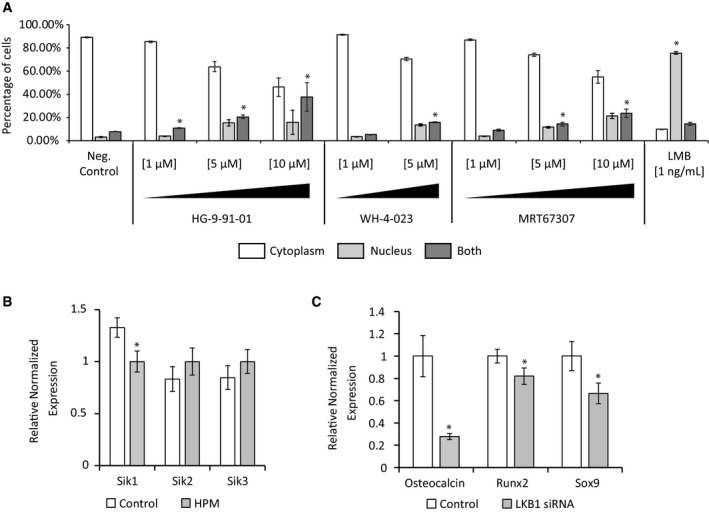
GFP‐HDAC4 localization after treatment with the indicated SIK inhibitors and concentration was scored automatically as being exclusively cytoplasmic (white), exclusively nuclear (light gray) or as occupying both a cytoplasmic and nuclear localization (dark gray) using CellProfiler cell image and analysis software 22. All three pan‐SIK inhibitors induced dose‐dependent nuclear accumulation of HDAC4. Data are shown as means ± SD (n = 275 cells at least in each group). Chi‐square proportion test, *P < 0.001.
Gene expression qRT–PCR analysis of the three SIK isoforms in VSMCs shows modest downregulation of SIK1 and modest upregulation of SIK2 and SIK3 following treatment with HPM (gray). Data are shown as means ± SEM (n = 4), relative to control. Two‐tailed unpaired Student's t‐test, *P < 0.05.
Gene expression qRT–PCR analysis of VSMCs transfected with control or LKB1 siRNA and grown in HPM for 7 days. Data are shown as means ± SEM (n = 4), normalized to control. Two‐tailed unpaired Student's t‐test, *P < 0.05.
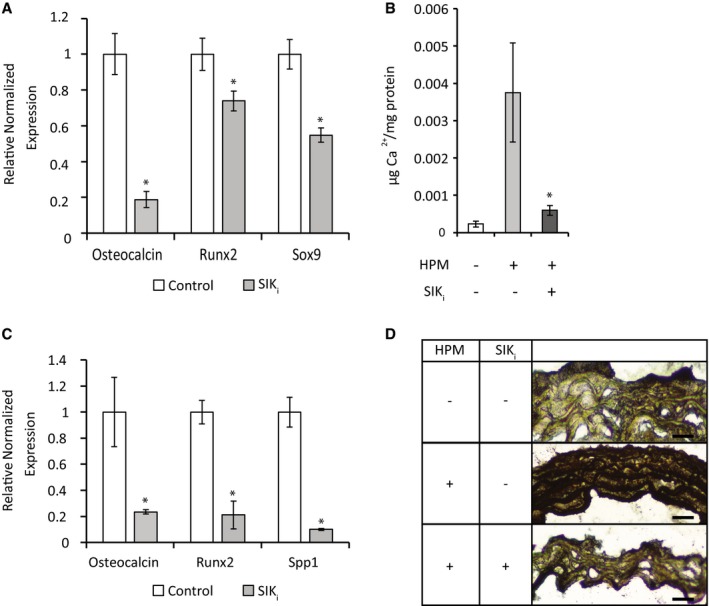
VSMCs were grown for 7 days in HPM with control (DMSO) or 1 μM HG‐9‐91‐01 (SIKi). Osteochondrogenic marker expression was analyzed using qRT–PCR. Data are shown as means ± SEM (n = 4), normalized to control. Two‐tailed unpaired Student's t‐test, *P < 0.05.
O‐cresolphthalein calcium colorimetric assay of VSMCs grown in HPM in the presence of HG‐9‐91‐01 for 14 days. Data are shown as means ± SEM (n = 7), normalized to protein concentration. Two‐tailed unpaired Student's t‐test, *P < 0.05 vs. HPM control treatment.
Aortic rings were grown for 14 days in HPM with control (DMSO) or 1 μM HG‐9‐91‐01 (SIKi). Osteochondrogenic marker expression was analyzed using qRT–PCR. Data are shown as means ± SEM (n = 6), normalized to control. Two‐tailed unpaired Student's t‐test, *P < 0.05.
Representative images of aortic rings histological sections in control, HPM and HPM with HG‐9‐91‐01 media, stained black for calcium with Von Kossa stain. Scale bar = 30 μm.
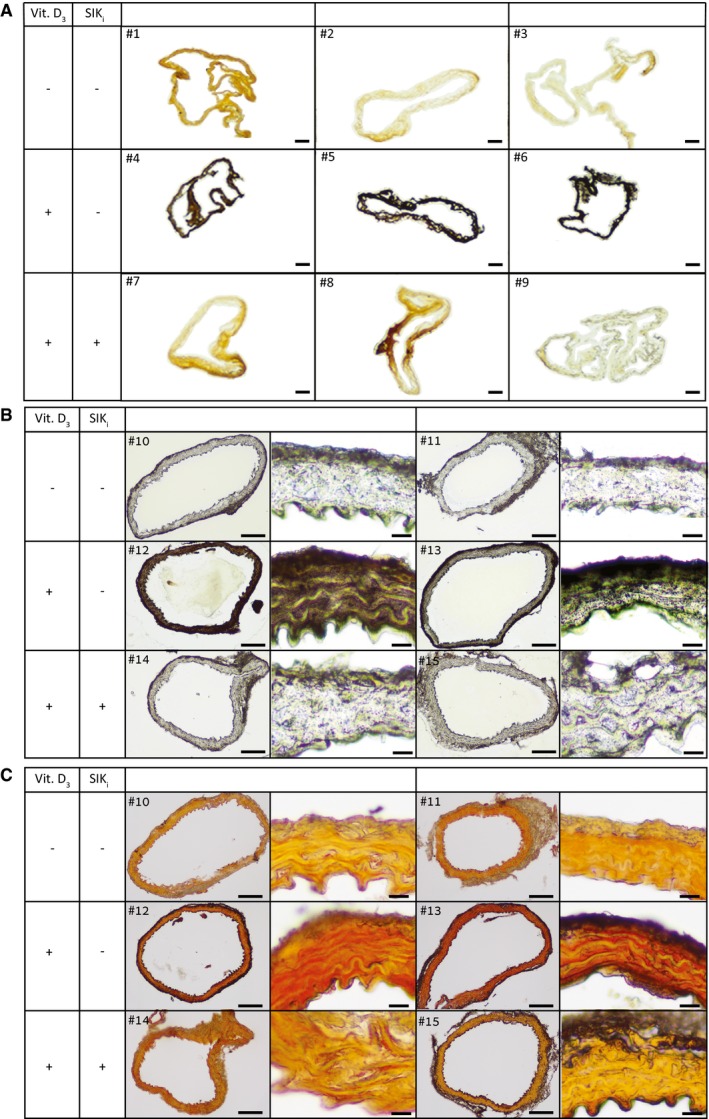
Mice aortic cryosections of three groups: (i) control (top, mice #1–3), (ii) vitamin D3 (middle, mice #4–6), and (iii) vitamin D3 and SIK inhibitor (bottom, mice #7–9), stained black for calcium with Von Kossa stain. Vitamin D3 causes excessive aortic calcification which is blunted by SIK inhibitor treatment. Scale bar = 100 μm.
Representative mice aortic paraffin thin sections of three groups: (i) control (top, mice #10–11), (ii) vitamin D3 (middle, mice #12–13), and (iii) vitamin D3 and SIK inhibitor (bottom, mice #14–15), stained black for calcium with Von Kossa stain in low and high magnifications. Scale bars are 100 and 10 μm, respectively.
Same mice aortic paraffin sections shown in (B) of three groups: (i) control (top, mice #10–11), (ii) vitamin D3 (middle, mice #12–13), and (iii) vitamin D3 and SIK inhibitor (bottom, mice #14–15), stained red for calcium with alizarin red calcium staining, in low and high magnifications. Scale bars are 100 and 10 μm, respectively.
- A
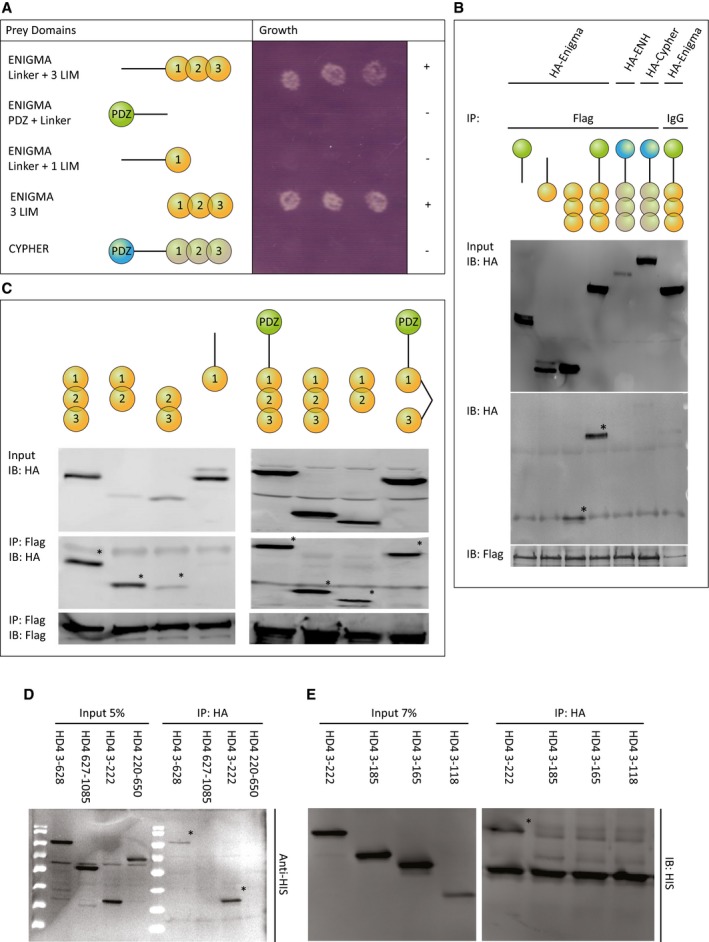
The yeast Ras recruitment system (RRS) was used to discover HDAC4‐binding partners. Interaction between the bait and prey proteins allows the Cdc25‐2 temperature‐sensitive yeast strain to grow at 36°C. Cdc25‐2 yeast cells were co‐transfected with HDAC4 N‐terminus (aa 3‐625) and the indicated myristoylated ENIGMA constructs or CYPHER and grown at 36°C. Only constructs containing the three LIM domains of ENIGMA conferred growth.
- B, C
Cells were co‐transfected with Flag‐HDAC4 and the indicated 3HA‐tagged ENIGMA constructs, 3HA‐tagged Enigma Homologue (ENH), or 3HA‐tagged CYPHER. Protein lysate was immunoprecipitated (IP) with an antibody recognizing Flag or IgG (negative control). Proteins were separated on SDS–PAGE gel and immunoblotted (IB) with an antibody recognizing HA or Flag. Total protein extract (input, 10% of lysate) is also shown. The analysis shows that any combinations of two of the three LIM domains of ENIGMA, or all three LIM domains are sufficient for the interaction (C). * marks the interacting fragments.
- D, E
Cells were co‐transfected with HA‐Enigma and the indicated 6xHIS‐tagged HDAC4 N‐terminal construct. Protein lysate was immunoprecipitated (IP) with an antibody recognizing HA. Proteins were separated on SDS–PAGE gel and immunoblotted (IB) with an antibody recognizing HIS. Total protein extract (input, 5% and 7% of lysate) is also shown. The analysis shows that ENIGMA binds the N‐terminus of HDAC4, specifically the interaction requires amino acids 185‐222. * marks the interacting fragments.
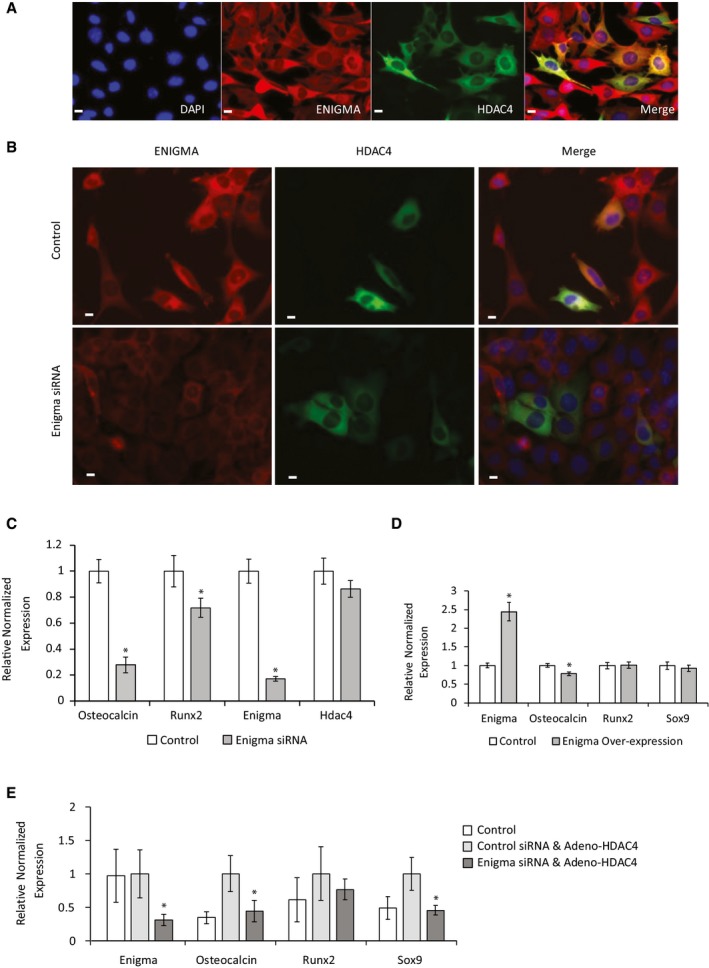
VSMCs were transfected with GFP‐HDAC4, cells were immunostained with an anti‐ENIGMA antibody (red), and nuclei were counterstained with DAPI (blue). Representative images show cytoplasmic co‐localization of ENIGMA and HDAC4. Scale bar = 10 μm.
VSMCs were transfected with GFP‐HDAC4 and ENIGMA siRNA or control scrambled siRNA and immunostained with an antibody recognizing ENIGMA. Nuclei were counterstained with DAPI. Knockdown of ENGIMA did not change the cytoplasmic localization of HDAC4. Scale bar = 10 μm.
VSMCs were transfected with ENIGMA siRNA or control scrambled siRNA, and osteochondrogenic markers were analyzed by qRT–PCR. Data are shown as means ± SEM (n = 8), normalized to control. Two‐tailed unpaired Student's t‐test, *P < 0.05.
VSMCs were transfected with an ENIGMA encoding plasmid or control lacZ plasmid and grown in control media. Osteochondrogenic markers were analyzed using qRT–PCR. Data are shown as means ± SEM (n = 4), normalized to control. Two‐tailed unpaired Student's t‐test, *P < 0.05.
VSMCs were transduced with adenoviral vector encoding for Flag‐tagged HDAC4 or control beta‐gal virus and then transfected with ENIGMA or control scrambled siRNA. Osteochondrogenic markers were analyzed using qRT–PCR. Data are shown as means ± SEM (n = 9), relative to control. Two‐tailed unpaired Student's t‐test, *P < 0.05 vs. control siRNA.
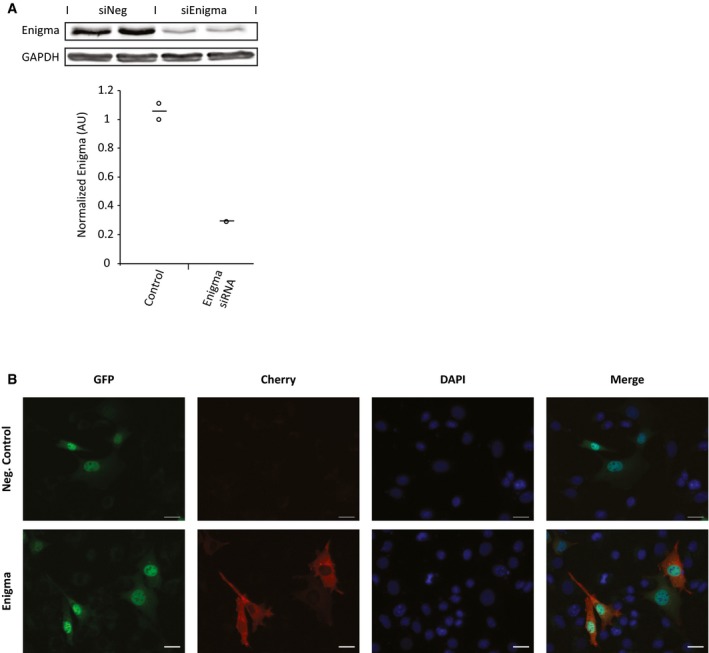
Western blot analysis and quantification showing the degree of ENIGMA protein knockdown in VSMCs in response to ENIGMA siRNA transfection. Data are shown as single data points and mean (n = 2).
VSMCs were co‐transfected with GFP‐3SA HDAC4 and Cherry‐ENIGMA plasmids to observe whether ENIGMA overexpression can force cytoplasmic localization of 3SA HDAC4. Representative images are shown. Scale bar = 10 μm.
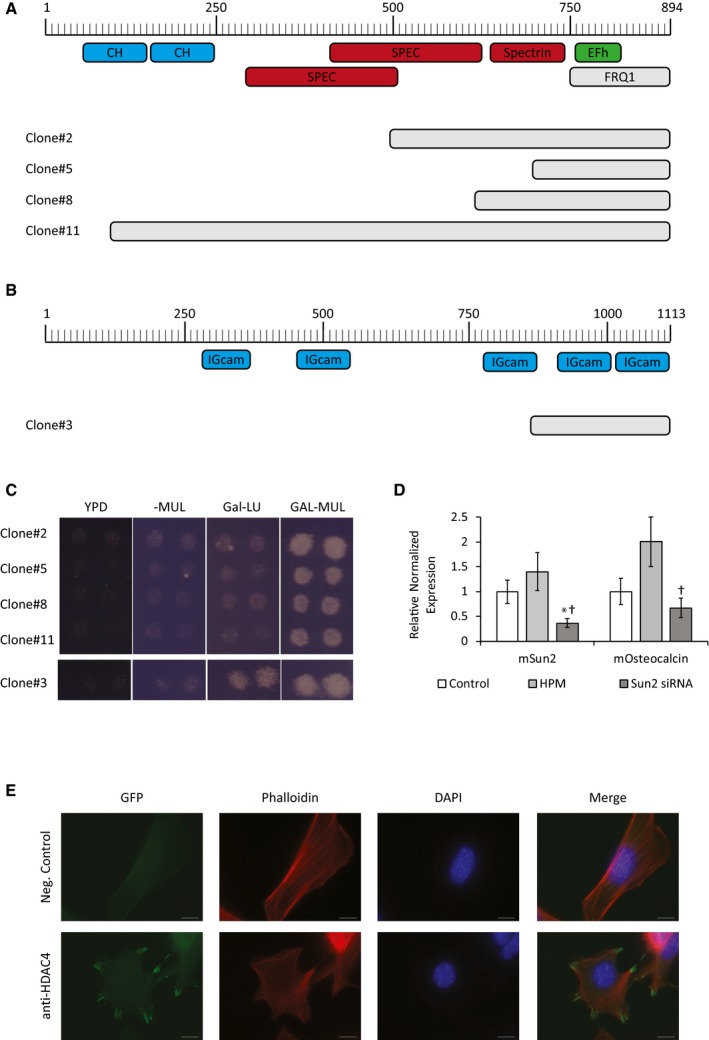
Cartoon of the α‐actinin protein with its known structural domains. Four independent α‐actinin clones, B1, B5, B8, and B11 (gray), were found to bind ENIGMA PDZ domain using the yeast Ras recruitment system (RRS). All clones contained the C‐terminal domain of α‐actinin.
Cartoon of the palladin protein with its known structural domains. One clone, B2 (gray), was found to bind ENIGMA through its C‐terminal domain, using the yeast Ras recruitment system (RRS).
Expression from the bait plasmid is induced in media without methionine (‐M), while expression from the prey plasmid is induced by galactose containing media (GAL). All five positive clones conferred growth at 36°C, only when the expression from both bait and prey plasmid was turned on (GAL‐MUL media), indicating true interaction.
VSMCs were transfected with SUN2 siRNA or control scrambled siRNA, and Osteocalcin levels were analyzed by qRT–PCR. Data are shown as means ± SEM (n = 4), normalized to control. Two‐tailed unpaired Student's t‐test, *P < 0.05 vs. control, †P < 0.05 vs. HPM.
Wild‐type VSMCs were fixed with formaldehyde, immunostained with an anti‐HDAC4 antibody (green), phalloidin (red), and nuclei were counterstained with DAPI (blue). Representative images are shown. Scale bar = 10 μm.
References
-
- Ho CY, Shanahan CM (2016) Medial arterial calcification highlights. Arterioscler Thromb Vasc Biol 36: 1475–1482 - PubMed
MeSH terms
Substances
LinkOut - more resources
Full Text Sources
Other Literature Sources
Molecular Biology Databases
Research Materials
Miscellaneous
