

Cross-sectional analysis of two social determinants of health in California cities: racial/ethnic and geographic disparities
- PMID: 28588108
- PMCID: PMC5730014
- DOI: 10.1136/bmjopen-2016-013975
Cross-sectional analysis of two social determinants of health in California cities: racial/ethnic and geographic disparities
Abstract
Objective: To study the magnitude and direction of city-level racial and ethnic differences in poverty and education to characterise health equity and social determinants of health in California cities.
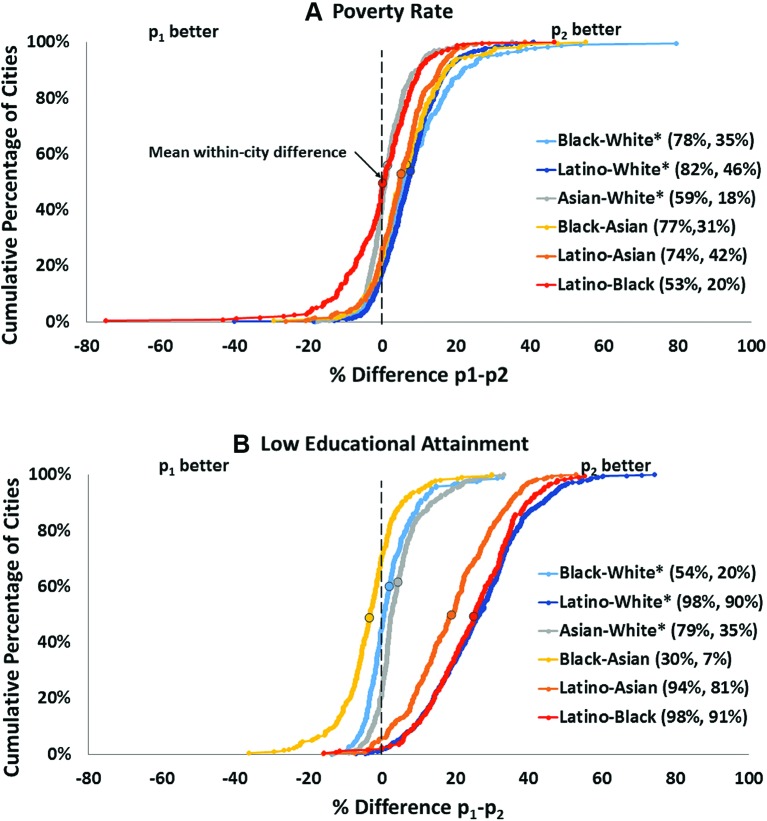
Design: We used data from the American Community Survey, United States Census Bureau, 2006-2010, and calculated differences in the prevalence of poverty and low educational attainment in adults by race/ethnicity and by census tracts within California cities. For race/ethnicity comparisons, when the referent group (p2) to calculate the difference (p1-p2) was the non-Hispanic White population (considered a historically advantaged group), a positive difference was considered a health inequity. Differences with a non-White reference group were considered health disparities.
Setting: Cities of the State of California, USA.
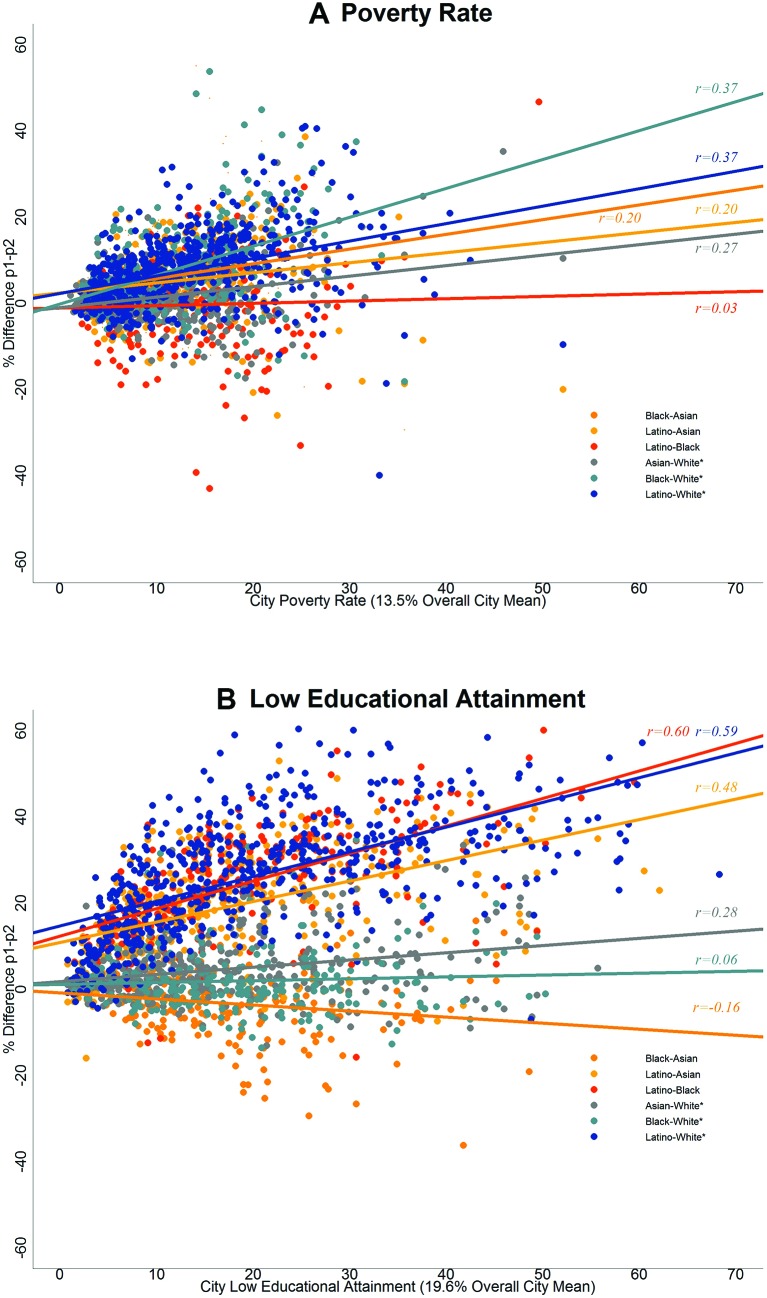
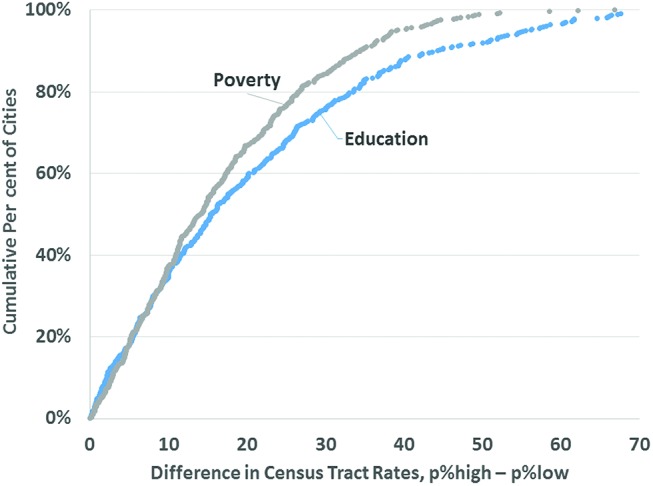
Results: Within-city differences in the prevalence of poverty and low educational attainment disfavoured Black and Latinos compared with Whites in over 78% of the cities. Compared with Whites, the median within-city poverty difference was 7.0% for Latinos and 6.2% for Blacks. For education, median within-city difference was 26.6% for Latinos compared with Whites. In a small, but not negligible proportion of cities, historically disadvantaged race/ethnicity groups had better social determinants of health outcomes than Whites. The median difference between the highest and lowest census tracts within cities was 14.3% for poverty and 15.7% for low educational attainment. Overall city poverty rate was weakly, but positively correlated with within-city racial/ethnic differences.
Conclusions: Disparities and inequities are widespread in California. Local health departments can use these findings to partner with cities in their jurisdiction and design strategies to reduce racial, ethnic and geographic differences in economic and educational outcomes. These analytic methods could be used in an ongoing surveillance system to monitor these determinants of health.
Keywords: Epidemiology; Health policy; Public health.
© Article author(s) (or their employer(s) unless otherwise stated in the text of the article) 2017. All rights reserved. No commercial use is permitted unless otherwise expressly granted.
Conflict of interest statement
Competing interests: None declared.
Figures
Similar articles
-
Racial-ethnic differences in prevalence of social determinants of health and social risks among middle-aged and older adults in a Northern California health plan.PLoS One. 2020 Nov 4;15(11):e0240822. doi: 10.1371/journal.pone.0240822. eCollection 2020. PLoS One. 2020. PMID: 33147232 Free PMC article.
-
Race/Ethnicity and Geographic Access to Urban Trauma Care.JAMA Netw Open. 2019 Mar 1;2(3):e190138. doi: 10.1001/jamanetworkopen.2019.0138. JAMA Netw Open. 2019. PMID: 30848804 Free PMC article.
-
The role of neighborhood characteristics in racial/ethnic disparities in type 2 diabetes: results from the Boston Area Community Health (BACH) Survey.Soc Sci Med. 2015 Apr;130:79-90. doi: 10.1016/j.socscimed.2015.01.041. Epub 2015 Feb 4. Soc Sci Med. 2015. PMID: 25687243 Free PMC article.
-
The role of social determinants in explaining racial/ethnic disparities in perinatal outcomes.Pediatr Res. 2016 Jan;79(1-2):141-7. doi: 10.1038/pr.2015.199. Epub 2015 Oct 14. Pediatr Res. 2016. PMID: 26466077 Free PMC article. Review.
-
Social and Structural Determinants of Health and Social Injustices Contributing to Obesity Disparities.Curr Obes Rep. 2024 Sep;13(3):617-625. doi: 10.1007/s13679-024-00578-9. Epub 2024 Jun 15. Curr Obes Rep. 2024. PMID: 38878122 Free PMC article. Review.
Cited by
-
Return to Work: Managing Employee Population Health During the COVID-19 Pandemic.Popul Health Manag. 2021 Feb;24(S1):S3-S15. doi: 10.1089/pop.2020.0261. Epub 2020 Dec 21. Popul Health Manag. 2021. PMID: 33347795 Free PMC article.
-
The impact of social determinants of health on obesity and diabetes disparities among Latino communities in Southern California.BMC Public Health. 2023 Jan 6;23(1):37. doi: 10.1186/s12889-022-14868-1. BMC Public Health. 2023. PMID: 36609302 Free PMC article.
-
Race, Discharge Disposition, and Readmissions After Elective Hip Replacement: Analysis of a Large Regional Dataset.Health Equity. 2019 Dec 16;3(1):628-636. doi: 10.1089/heq.2019.0083. eCollection 2019. Health Equity. 2019. PMID: 31872168 Free PMC article.
-
Socioeconomic risk markers of leprosy in high-burden countries: A systematic review and meta-analysis.PLoS Negl Trop Dis. 2018 Jul 9;12(7):e0006622. doi: 10.1371/journal.pntd.0006622. eCollection 2018 Jul. PLoS Negl Trop Dis. 2018. PMID: 29985930 Free PMC article.
References
-
- Agency for Healthcare Research and Quality. 2014 national healthcare quality and disparities report. AHRQ publication No. 15-0007. Rockville, MD: Agency for Healthcare Research and Quality, 2015.
-
- Centers for Disease Control and Prevention. CDC health disparities and inequalities report — United States, 2013. MMWR 2013;62(Suppl 3). - PubMed
-
- National Center for Health Statistics. Health, United States, 2014: with special feature on adults aged 55–64. Hyattsville, MD: US Department of Health and Human Services, 2015. - PubMed
-
- Rudolph L, Caplan J, Mitchell C, et al. . Health in all policies: improving health through intersectoral collaboration. Washington, DC: Institute of Medicine, 2013.
MeSH terms
LinkOut - more resources
Full Text Sources
Other Literature Sources