. 2017 Aug;174(4):2083-2097.
doi: 10.1104/pp.17.00491. Epub 2017 Jun 6.

Two Glycerol-3-Phosphate Dehydrogenases from Chlamydomonas Have Distinct Roles in Lipid Metabolism

Affiliations

Two Glycerol-3-Phosphate Dehydrogenases from Chlamydomonas Have Distinct Roles in Lipid Metabolism

Thomas Driver et al. Plant Physiol. 2017 Aug.

Abstract

The metabolism of glycerol-3-phosphate (G3P) is important for environmental stress responses by eukaryotic microalgae. G3P is an essential precursor for glycerolipid synthesis and the accumulation of triacylglycerol (TAG) in response to nutrient starvation. G3P dehydrogenase (GPDH) mediates G3P synthesis, but the roles of specific GPDH isoforms are currently poorly understood. Of the five GPDH enzymes in the model alga Chlamydomonas reinhardtii, GPD2 and GPD3 were shown to be induced by nutrient starvation and/or salt stress. Heterologous expression of GPD2, a putative chloroplastic GPDH, and GPD3, a putative cytosolic GPDH, in a yeast gpd1Δ mutant demonstrated the functionality of both enzymes. C. reinhardtii knockdown mutants for GPD2 and GPD3 showed no difference in growth but displayed significant reduction in TAG concentration compared with the wild type in response to phosphorus or nitrogen starvation. Overexpression of GPD2 and GPD3 in C. reinhardtii gave distinct phenotypes. GPD2 overexpression lines showed only subtle metabolic phenotypes and no significant alteration in growth. In contrast, GPD3 overexpression lines displayed significantly inhibited growth and chlorophyll concentration, reduced glycerol concentration, and changes to lipid composition compared with the wild type, including increased abundance of phosphatidic acids but reduced abundance of diglycerides, triglycerides, and phosphatidylglycerol lipids. This may indicate a block in the downstream glycerolipid metabolism pathway in GPD3 overexpression lines. Thus, lipid engineering by GPDH modification may depend on the activities of other downstream enzyme steps. These results also suggest that GPD2 and GPD3 GPDH isoforms are important for nutrient starvation-induced TAG accumulation but have distinct metabolic functions.


Figures

Figure 1.
Figure 1.
Simplified pathway of chloroplastic and nonchloroplastic G3P and lipid metabolism. DAG, Diacyglycerol; GL, galactoglycerolipids; Gly-3P, glyceraldehyde-3-phosphate; lyso-PA, lysophosphatidic acid; Lyso-PL, lysophospholipids; PA, phosphatidic acid; PE, phosphatidylethanolamine; PG, phosphatidylglycerol; PI, phosphatidylinositol; PL, phospholipids. Chloroplast and endoplasmic reticulum (ER) glycerolipid pathways are indicated by fatty acid transfer from acyl-ACP and acyl-CoA, respectively. Key metabolism genes are indicated by red italics: DGAT, DAG acyltransferase; GK, glycerol kinase; GPAT, G3P acyltransferase; GPD, G3P dehydrogenase; GPP, G3P phosphatase; LPAAT, lyso-PA acyltransferase; PAP, PA phosphatase; PDAT, phospholipid:DAG acyltransferase.
Figure 2.
Figure 2.
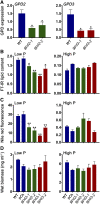
Expression of C. reinhardtii GPDH genes in response to stress. Gene expression is shown for GPD1 to GPD5 from wild-type cells grown under nonstressed conditions (TAP medium), P or N starvation conditions (Low P or Low N), and after a 2-h 200 mm NaCl stress. Expression of the mRNA transcripts as determined by qPCR was calculated relative to CBLP expression. Each data point represents the mean ± se calculated from biological triplicates each with technical triplicates. Asterisks indicate significant differences (*, P < 0.05 and **, P < 0.01) compared with control TAP medium as determined by one-way ANOVA.
Figure 3.
Figure 3.
Functional analysis of C. reinhardtii GPD1, GPD2, and GPD3 by heterologous expression in a yeast gpd1 mutant. A and B, Suppression of salt sensitivity of gpd1 yeast by heterologous expression of GPD1, GPD2, truncated GPD2 lacking the plastid transit peptide (GPD2-tp-trunc), and GPD3 cDNA in comparison with empty vector-transformed yeast (gpd1 vector) and wild-type yeast (WT). A, Saturated liquid cultures of yeast strains serially diluted to the indicated cell densities and then spotted onto yeast extract-peptone-dextrose (YPD) medium containing 0.7 m NaCl and synthetic defined medium minus His (SD-His). A representative experiment of yeast growth at 30°C after 2 d is shown. B, Yeast strains normalized to an identical starting cell density and then grown in liquid YPD medium without added NaCl or in medium containing 0.8 or 1 m NaCl for 24 h. Cell density was determined by OD600 measurement. In growth with three different concentrations of NaCl for 24 h, all four complementation lines grew better than the gpd1 knockout in 0.8 and 1 m NaCl, and all lines grew equally well in 0 m NaCl. Each data point represents the mean ± se. Strains indicated by different lowercase letters are significantly different within each salt concentration treatment (P < 0.05) as determined by one-way ANOVA. C and D, Glycerol content in yeast strains in response to 0.7 m NaCl addition after 4 h (C) and neutral lipid content determined by Nile Red fluorescence in yeast strains grown under N starvation (D). Each data point represents the mean ± se. Strains indicated by different lowercase letters are significantly different (P < 0.05) as determined by one-way ANOVA.
Figure 4.
Figure 4.
Lipid and biomass measurement of C. reinhardtii gpd2 and gpd3 knockdown lines. A, Gene expression of GPD2 and GPD3 in amiRNA gpd2 and gpd3 lines, respectively, compared with the CC-4351 cw15 wild type (WT) grown in low-P medium. Expression of mRNA transcripts by qPCR was calculated relative to CBLP expression. Each data point represents the mean ± se of biological triplicates each with technical triplicates. B, Lipid content measured from FT-IR spectra peak height measurement of the ʋCH2 lipid (2,920 cm−1) band and determined as a ratio with the amide I (1,655 cm−1) band. C, Neutral lipid quantified by Nile Red fluorescence normalized to cell density. D, Fresh weight biomass. In B to D, triplicate cultures of the CC-4351 cw15 wild type, the pChlamiRNA (pCh) empty vector-transformed CC-4351, and the gpd2 and gpd3 knockdown lines were grown under P-replete (High P) and P starvation (Low P) conditions and collected after 7 d of growth. Each data point represents the mean ± se. Asterisks indicate significant differences (*, P < 0.05 and **, P < 0.01) compared with the wild type as determined by one-way ANOVA.
Figure 5.
Figure 5.
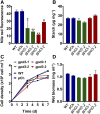
Lipid, starch, and growth phenotypes of C. reinhardtii gpd2 and gpd3 knockdown lines in response to N starvation. A, Neutral lipid content after 7 d quantified by Nile Red fluorescence normalized by cell density. B, Starch concentration after 7 d determined on the basis of fresh weight biomass. C, Cell density of cultures grown over time. D, Fresh weight biomass after 7 d. Triplicate cultures of the CC-4351 cw15 wild type (WT), the pChlamiRNA (pCh) empty vector-transformed CC-4351, and the gpd2 and gpd3 knockdown lines were grown under N starvation conditions. Each data point represents the mean ± se. Asterisks indicate significant differences (*, P < 0.05 and **, P < 0.01) compared with the wild type as determined by one-way ANOVA.
Figure 6.
Figure 6.
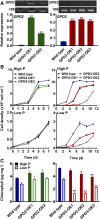
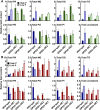
Effects of GPD2 and GPD3 overexpression on cell growth and chlorophyll. A, Gene expression of GPD2 and GPD3 in GPD2-OE and GPD3-OE lines, respectively, compared with the CC-48 wild type. The expression of mRNA transcripts was determined relative to 18S expression. Representative gel images of GPD2 and GPD3 expression are shown. B and C, Cell density over time (B) and total chlorophyll concentration after 7 d (for GPD2-OE lines) and 11 d (for GPD3-OE lines) and determined on the basis of fresh weight biomass (C) from triplicate cultures of the wild-type strain and GPD2-OE and GPD3-OE lines grown under P-replete (High P) and P starvation (Low P) conditions. Each data point represents the mean ± se. Asterisks indicate significant differences (*, P < 0.05 and **, P < 0.01) compared with the wild type within each treatment as determined by one-way ANOVA.
Figure 7.
Figure 7.
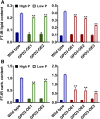
Lipid and carbohydrate measurement of GPD2 and GPD3 overexpression lines. A and B, Lipid content determined from triplicate FT-IR spectra peak height measurement of the ʋCH2 lipid (2,920 cm−1) band (A) and carbohydrate content determined from triplicate FT-IR spectra peak height measurement of the ʋC-O carbohydrate (1,160, 1,086, 1,050, and 1,036 cm−1) bands, both as a ratio with the amide I band (1,655 cm−1), from the CC-48 wild type and GPD2-OE and GPD3-OE lines grown under P-replete (High P) and P starvation (Low P) conditions. Samples were measured after 7 d (for GPD2-OE lines) and 11 d (for GPD3-OE lines). Each data point represents the mean ± se. Asterisks indicate significant differences (*, P < 0.05 and **, P < 0.01) compared with the wild type within each treatment as determined by one-way ANOVA.
Figure 8.
Figure 8.
Glycerol quantification of GPD2 and GPD3 overexpression lines. Glycerol content was normalized to fresh weight biomass and quantified from triplicate samples from the CC-48 wild type and GPD2-OE (A) and GPD3-OE (B) lines grown under P-replete (High P) and P starvation (Low P) conditions. Samples were measured after 7 d (for GPD2-OE lines) and 11 d (for GPD3-OE lines). Results are plotted relative to wild-type high-P samples. Each data point represents the mean ± se. Asterisks indicate significant differences (*, P < 0.05 and **, P < 0.01) compared with the wild type within each treatment as determined by one-way ANOVA.
Figure 9.
Figure 9.
Lipid composition of GPD2 and GPD3 overexpression lines. A and B, Relative changes in lipid classes determined from positive and negative ionization mode UHPLC-MS normalized to fresh weight biomass and quantified from triplicate samples from the CC-48 wild type and GPD2-OE (A) and GPD3-OE (B) lines grown under P-replete (High P) and P starvation (Low P) conditions. Samples were measured after 7 d (for GPD2-OE lines) and 11 d (for GPD3-OE lines). Results are plotted relative to wild-type high-P samples. The measured lipid classes are as follows: DG; PE, phosphatidylethanolamines; PI, phosphatidylinositols; MG, monoglycerides; TG, triglycerides; and unclassed lipids. Each data point represents the mean ± se. Asterisks indicate significant differences (*, P < 0.05 and **, P < 0.01) compared with the wild type within each treatment as determined by one-way ANOVA.

Similar articles

Cited by

References

    1. André L, Hemming A, Adler L (1991) Osmoregulation in Saccharomyces cerevisiae: studies on the osmotic induction of glycerol production and glycerol-3-phosphate dehydrogenase (NAD+). FEBS Lett 286: 13–17 - PubMed
    1. Ansell R, Granath K, Hohmann S, Thevelein JM, Adler L (1997) The two isoenzymes for yeast NAD+-dependent glycerol 3-phosphate dehydrogenase encoded by GPD1 and GPD2 have distinct roles in osmoadaptation and redox regulation. EMBO J 16: 2179–2187 - PMC - PubMed
    1. Bajhaiya AK, Dean AP, Driver T, Trivedi DK, Rattray NJW, Allwood JW, Goodacre R, Pittman JK (2016a) High-throughput metabolic screening of microalgae genetic variation in response to nutrient limitation. Metabolomics 12: 9. - PMC - PubMed
    1. Bajhaiya AK, Dean AP, Zeef LAH, Webster RE, Pittman JK (2016b) PSR1 is a global transcriptional regulator of phosphorus deficiency responses and carbon storage metabolism in Chlamydomonas reinhardtii. Plant Physiol 170: 1216–1234 - PMC - PubMed
    1. Bajhaiya AK, Ziehe Moreira J, Pittman JK (2017) Transcriptional engineering of microalgae: prospects for high-value chemicals. Trends Biotechnol 35: 95–99 - PubMed

MeSH terms

LinkOut - more resources