. 2017 Jun 6;8(3):e00511-17.
doi: 10.1128/mBio.00511-17.

Novel Chromosome Organization Pattern in Actinomycetales-Overlapping Replication Cycles Combined with Diploidy

Affiliations

Novel Chromosome Organization Pattern in Actinomycetales-Overlapping Replication Cycles Combined with Diploidy

Kati Böhm et al. mBio. .

Abstract

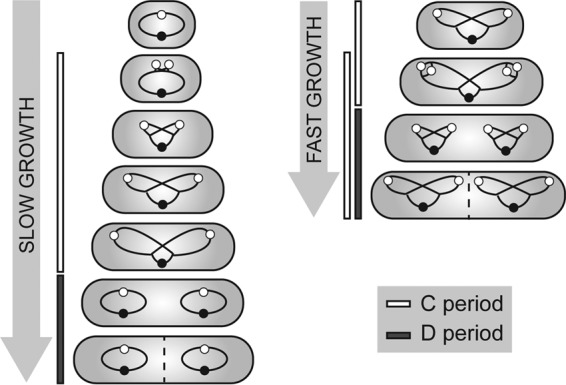
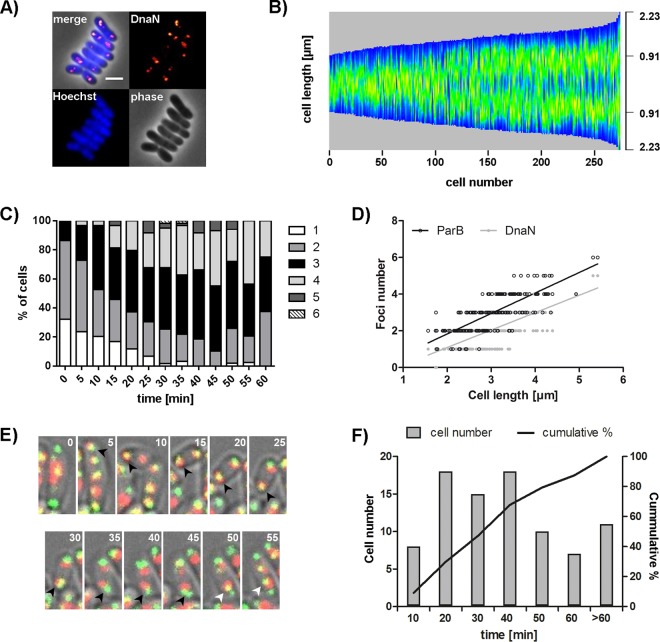
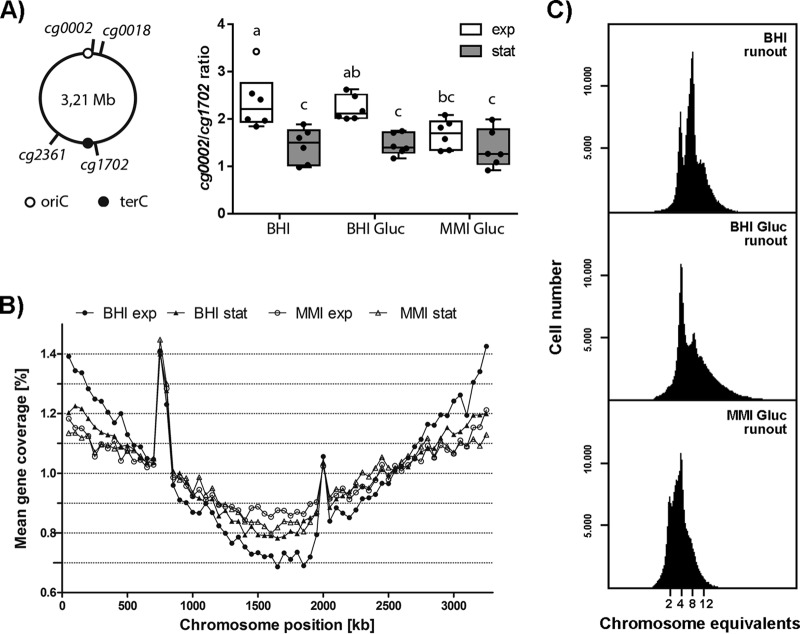
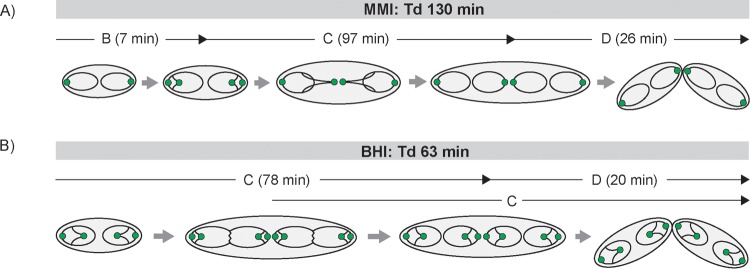
Bacteria regulate chromosome replication and segregation tightly with cell division to ensure faithful segregation of DNA to daughter generations. The underlying mechanisms have been addressed in several model species. It became apparent that bacteria have evolved quite different strategies to regulate DNA segregation and chromosomal organization. We have investigated here how the actinobacterium Corynebacterium glutamicum organizes chromosome segregation and DNA replication. Unexpectedly, we found that C. glutamicum cells are at least diploid under all of the conditions tested and that these organisms have overlapping C periods during replication, with both origins initiating replication simultaneously. On the basis of experimental data, we propose growth rate-dependent cell cycle models for C. glutamicumIMPORTANCE Bacterial cell cycles are known for few model organisms and can vary significantly between species. Here, we studied the cell cycle of Corynebacterium glutamicum, an emerging cell biological model organism for mycolic acid-containing bacteria, including mycobacteria. Our data suggest that C. glutamicum carries two pole-attached chromosomes that replicate with overlapping C periods, thus initiating a new round of DNA replication before the previous one is terminated. The newly replicated origins segregate to midcell positions, where cell division occurs between the two new origins. Even after long starvation or under extremely slow-growth conditions, C. glutamicum cells are at least diploid, likely as an adaptation to environmental stress that may cause DNA damage. The cell cycle of C. glutamicum combines features of slow-growing organisms, such as polar origin localization, and fast-growing organisms, such as overlapping C periods.

Keywords: Corynebacterium; ParA; ParB; cell cycle; diploidy; origin; replication.


Figures

FIG 1
FIG 1
Schematic representation of bacterial replication cycles under slow (left)- and fast (right)-growth conditions. Under slow-growth conditions, DNA replication (termed the C period) takes place within a single generation, followed by the interval between replication termination and completion of cell division (the D period). Fast-growing bacteria with generation times shorter than the C period, like B. subtilis and E. coli, undergo multifork replication; i.e., new rounds of replication are initiated before previous ones terminate. Chromosomes are indicated by black lines with oriCs and terCs as white and black circles.
FIG 2
FIG 2
Determination of the C. glutamicum oriC number and correlation with cell length. (A) Subcellular localization of ParB-eYFP in representative parB::parB-eYFP WT and ΔparA mutant cells. Shown are overlays of phase-contrast images and eYFP fluorescence (merge) and separate channels (phase, ParB). Scale bar, 2 µm. (B) ParB focus number depends on cell length in a ParA-independent way. In the WT strain, 1 to 5 foci were observed, and in a ΔparA mutant strain, 1 to 12 foci were observed (n = 400). Linear regression lines are shown. WT, r = 0.80; ΔparA mutant, r = 0.88; slopes are not equal (ANCOVA, F1,396 = 16.10, P < 0.0001). (C) Still image of C. glutamicum parB::parB-eYFP divIVA::divIVA-mCherry cells. Depicted are a phase-contrast image (lower right), DivIVA (lower left) and ParB-eYFP (upper right) fluorescence, and an overlay of all of the channels (upper left). Scale bar, 2 µm. (D) Time-lapse microscopy of a DivIVA-mCherry- and ParB-eYFP-coexpressing strain reveals distribution of cell length and ParB-eYFP cluster number at the beginning of septum formation and after cell division (n = 200). The microscopy images of a single cell exemplify the time-lapse analysis of septum formation (white arrowheads) tracked with a DivIVA-mCherry reporter. Scale bar, 2 µm.
FIG 3
FIG 3
oriC localization pattern during cell cycle progression. (A) Occurrence of newly formed ParB-eYFP clusters in the course of cell elongation. Still images show a time series of a typical C. glutamicum WT cell with initially two ParB spots. Three further foci appear over time (arrowheads); time points are indicated in minutes (top right corners). Scale bar, 2 µm. (B) Time-lapse single-cell analyses reveal oriC-ParB complex positions along the long cell axis at each moment in time when a new ParB-eYFP spot occurs. A third, a fourth, and eventually a fifth focus separate from the two initial ParB clusters located close to the cell poles and move toward midcell positions. Cells are aligned with the old pole facing upward; cell lengths are normalized to 1 (n = 46). Schemes shown to the left of the graphs illustrate average ParB-eYFP focus positions ± the standard deviations. (C) Time-dependent increase in the number of ParB clusters per cell. Percentages of cells with one to five spots are depicted for each time point (n = 30). (D) ParB-eYFP pattern along the cell axis depending on cell length in WT C. glutamicum. Automated image analysis of still microscopy images sorted by cell length with high fluorescence intensities displayed in green (n >200). (E) Counts of ParB-eYFP spots over time in C. glutamicum ΔparA. Percentages of cells with 1 to 12 ParB foci were determined for each time point (n = 30). (F) Random ParB-eYFP distribution along the longitudinal cell axis in relation to its length in a ΔparA mutant strain. Automated analysis of still images with high fluorescence intensities displayed in green (n >300). (G) The timing of replication initiation is similar at oriCs of old and young cell poles. Automated image analysis of the C. glutamicum parB::parB-eYFP divIVA::divIVA-mCherry fluorescence pattern sorted by cell length with the old cell pole (high polar DivIVA-mCherry signal level) facing downward. ParB-eYFP (green) and DivIVA-mCherry (red) fluorescence is illustrated in one demograph.
FIG 4
FIG 4
Subcellular terC positioning and cell length-dependent abundance. Microscopic analyses of terC were performed with C. glutamicum parB::parB-eYFP including a FROS in proximity to terC (int::lacO pCLTON1PamtR-lacI-CFP) grown in BHI medium. (A) Localization of oriCs and terCs in fast-growing cells. Shown are bright-field (BF), CFP and eYFP fluorescence (terC, ParB), and overlay (merge) images. terCs localize to midcell positions. Scale bar, 2 µm. (B) Numbers of ParB-eYFP and terC foci per cell depending on cell length (n = 250). Up to six ParB-oriC and up to five terC complexes were determined per cell. Linear regression lines are shown, terC, r = 0.40; ParB-eYFP, r = 0.64. (C) Increase in the number of terC foci with the rising number of ParB-eYFP spots per cell. Percentages of cells with one to five terC foci were determined, sorted by oriC complex numbers (n = 250). (D) The C. glutamicum chromosome is organized longitudinally throughout the cell cycle. Automated image analysis of still microscopy images sorted by cell length reveals the central terC (green) and polar ParB-eYFP (red) fluorescence patterns along the cell axis (n >200).
FIG 5
FIG 5
Dynamic localization of multiple replisomes in C. glutamicum. (A) Localization of replisomes in dnaN::dnaN-mCherry mutant cells. Shown are an overlay (merge) of DnaN fluorescence (red) and DNA stained with Hoechst (blue) with a phase-contrast image and separate channels (DnaN, Hoechst, and phase). Scale bar, 2 µm. (B) Timing of replication along the cell axis. Automated analysis of still images with DnaN-mCherry fluorescence. Cells are sorted by length, and DnaN-mCherry fluorescence is shown as a heat map (blue to orange) (n >250). (C) Replisome numbers per cell vary within one cell cycle. Percentages of cells with one to six DnaN spots were determined for each time point (n = 59). (D) ParB and DnaN focus numbers in relation to cell length in C. glutamicum parB::parB-eYFP dnaN::dnaN-mCherry (n = 200). Linear regression lines are shown. ParB-eYFP/DnaN-mCherry, r = 0.65. (E) Time frames of replication initiation until segregation of sister oriCs. Shown is a time series showing the movement of ParB-eYFP and DnaN-mCherry foci (green and red, overlay in yellow) in parB::parB-eYFP dnaN::dnaN-mCherry mutant cells. Images were taken at 5-min intervals, as indicated in the top right corners. At 5 min, a replisome forms at the polar oriC (black arrowheads); sister oriCs separate at 50 min (white arrowheads). (F) Variable cohesion periods of sister oriCs. Shown is the distribution of oriC colocalization times analyzed by time-lapse microscopy together with the cumulative skew of sample data (n = 88).
FIG 6
FIG 6
Timing of DNA replication initiation and determination of oriC numbers per cell. (A) Marker frequency analysis of oriC and terminus regions. (Left) Schematic representation of the chromosomal positions of the oriC- and terC-proximal marker genes used. (Right) oriC-to-terminus ratios of the WT strain grown under different conditions were determined by frequency analysis of markers cg0002 and cg1702 (see Fig. S6B for cg0018/cg2361 ratios). Cells were grown in BHI medium, BHI+Gluc, or MMI supplemented with glucose. Samples were taken in the exponential (exp, white boxes) and stationary (stat, gray boxes) growth phases. Results are shown as box plots with medians indicated as solid lines and whiskers of 1.5 times the interquartile range (n = 6); outliers are depicted as open circles. ANOVA yielded significant variation among growth phase (F1,30 = 28.00, P < 0.0001) and medium (F2,30 = 3.43, P < 0.05) conditions. Letters indicate significant differences between data sets determined by post-hoc Bonferroni analysis at P < 0.05. (B) Whole-genome sequencing. Genomic DNA of WT C. glutamicum grown in BHI or MMI medium supplemented with glucose was isolated in the exponential and stationary growth phases. Data were analyzed by Illumina MiSeq shotgun sequencing and mapped to the C. glutamicum ATCC 13032 genome sequence (GenBank accession no. BX927147.1). Data are displayed as the mean gene coverage of each 50-kb sliding window as a percentage of the total mean coverage per sample. Note that the RES167 strain used in this study lacks the phage island (cg1981-cg2034) and harbors an ISCg14-mediated 5-fold tandem amplification of the tus locus (peaks at approximately 750- and 2,000-kb positions); both loci were excluded from data analysis. Stable replication progression is evidenced by the frequency of genes between the oriC (located at 0 kb) and terminus regions (at approximately 1.6 Mb). (C) Numbers of chromosomes per cell determined by flow cytometry after replication runout in BHI medium, BHI+Gluc, or MMI medium supplemented with glucose. Depending on the growth conditions, between 2 and 12 chromosomes were detected.
FIG 7
FIG 7
Spatiotemporal chromosome organization of C. glutamicum. Chromosomes are depicted as black lines with oriCs as green circles. In newborn cells, two initial oriCs are located close to the poles. Upon initiation of a new round of replication, sister oriCs segregate nonsynchronously from polar ParB-eYFP clusters and move toward the midcell position, where a new septum is formed. Notably, stages with single chromosomes per cell are absent. (A) Cell cycle of slow-growing cells in MMI medium. A short B period is followed by C and D periods; replication takes place within one generation. (B) Chromosome organization during fast growth in BHI medium. Multifork replication allows for short doubling times (Tds), with a second round of replication starting after the first half of the cell cycle, around 15 min before the previous one terminates.

References

    1. Wang X, Montero Llopis PM, Rudner DZ. 2013. Organization and segregation of bacterial chromosomes. Nat Rev Genet 14:191–203. doi: 10.1038/nrg3375. - DOI - PMC - PubMed
    1. Quon KC, Yang B, Domian IJ, Shapiro L, Marczynski GT. 1998. Negative control of bacterial DNA replication by a cell cycle regulatory protein that binds at the chromosome origin. Proc Natl Acad Sci U S A 95:120–125. doi: 10.1073/pnas.95.1.120. - DOI - PMC - PubMed
    1. McGrath PT, Iniesta AA, Ryan KR, Shapiro L, McAdams HH. 2006. A dynamically localized protease complex and a polar specificity factor control a cell cycle master regulator. Cell 124:535–547. doi: 10.1016/j.cell.2005.12.033. - DOI - PubMed
    1. Gorbatyuk B, Marczynski GT. 2005. Regulated degradation of chromosome replication proteins DnaA and CtrA in Caulobacter crescentus. Mol Microbiol 55:1233–1245. doi: 10.1111/j.1365-2958.2004.04459.x. - DOI - PubMed
    1. Lu M, Campbell JL, Boye E, Kleckner N. 1994. SeqA: a negative modulator of replication initiation in E. coli. Cell 77:413–426. doi: 10.1016/0092-8674(94)90156-2. - DOI - PubMed

Publication types

MeSH terms

Substances

LinkOut - more resources