. 2017 Jun 20;114(25):6438-6443.
doi: 10.1073/pnas.1619598114. Epub 2017 Jun 6.

Effect of water flow and chemical environment on microbiota growth and composition in the human colon

Affiliations

Effect of water flow and chemical environment on microbiota growth and composition in the human colon

Jonas Cremer et al. Proc Natl Acad Sci U S A. .

Abstract

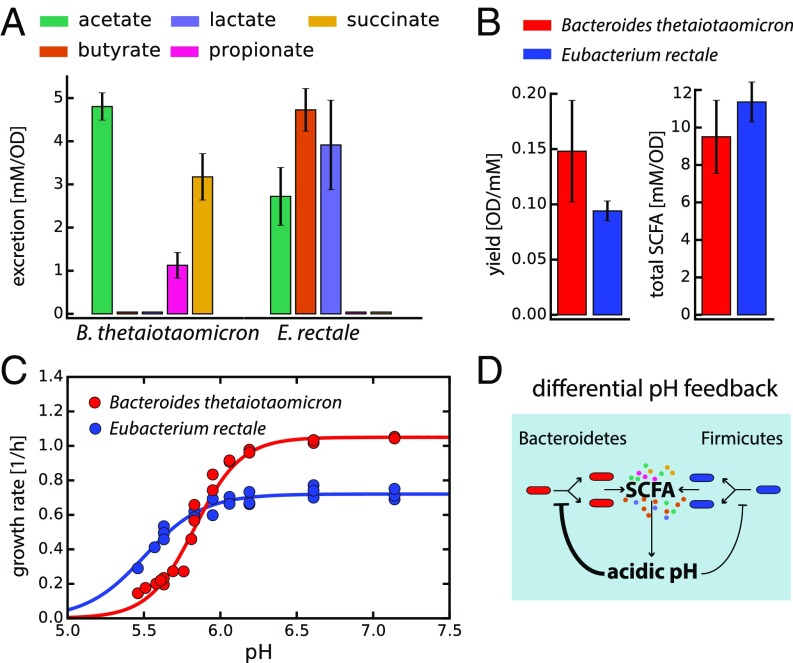
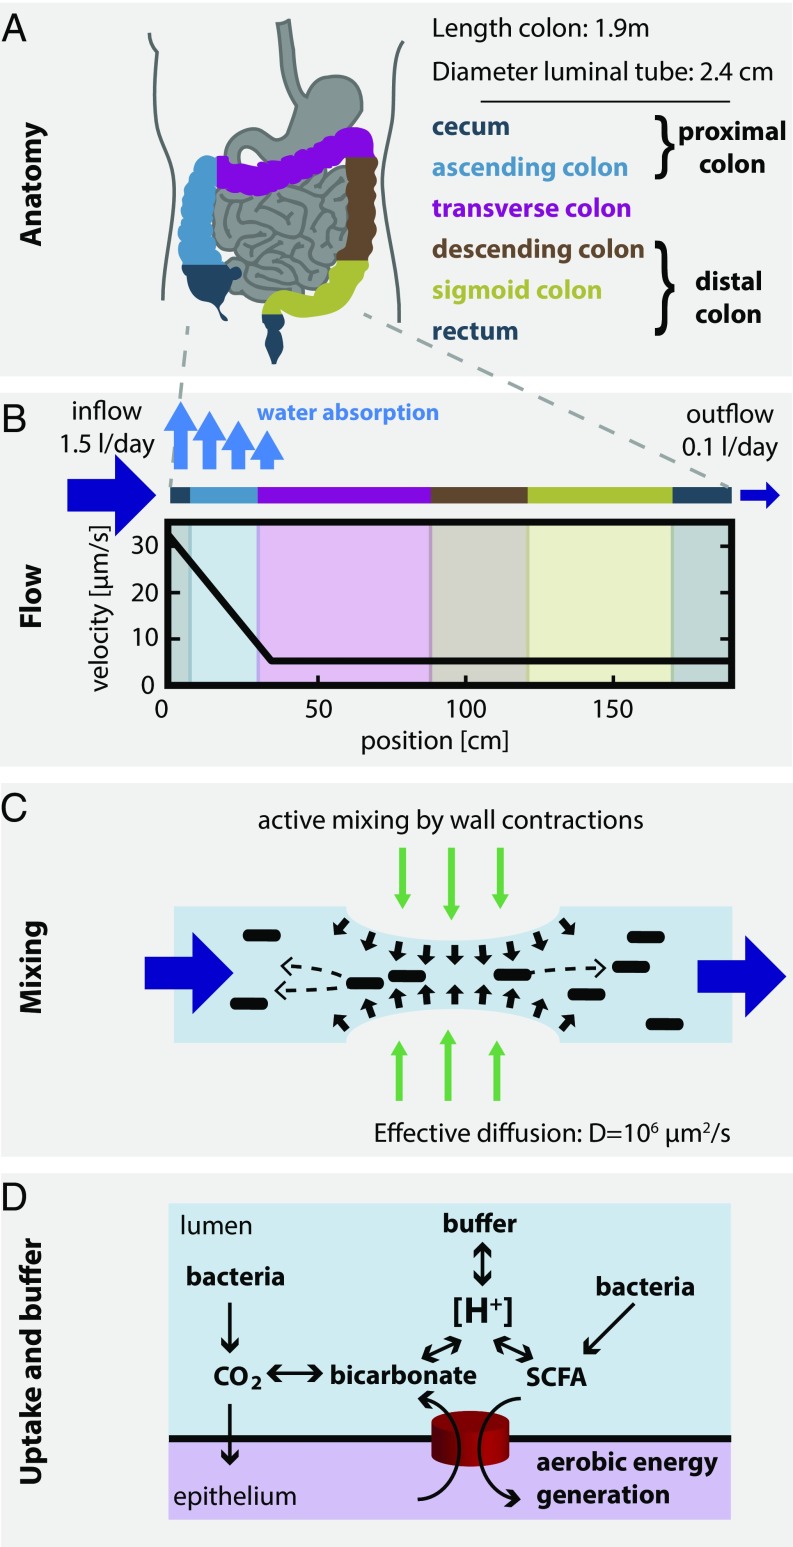
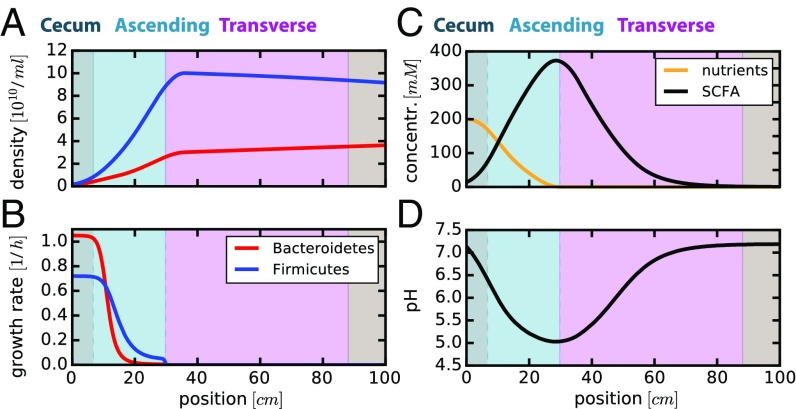
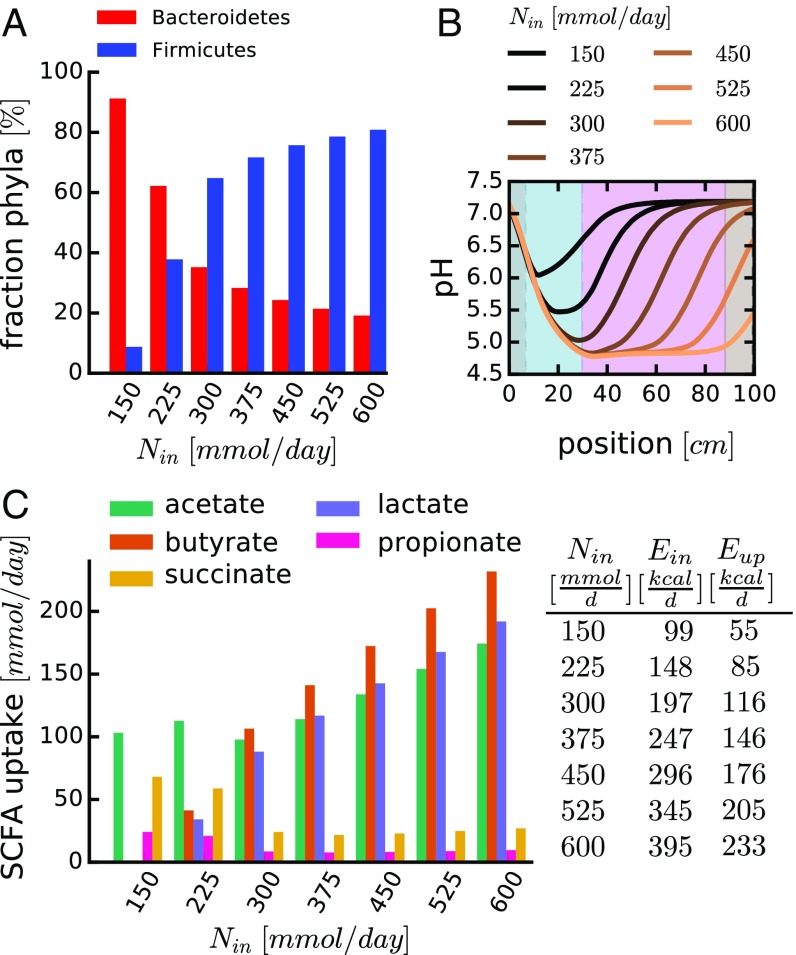
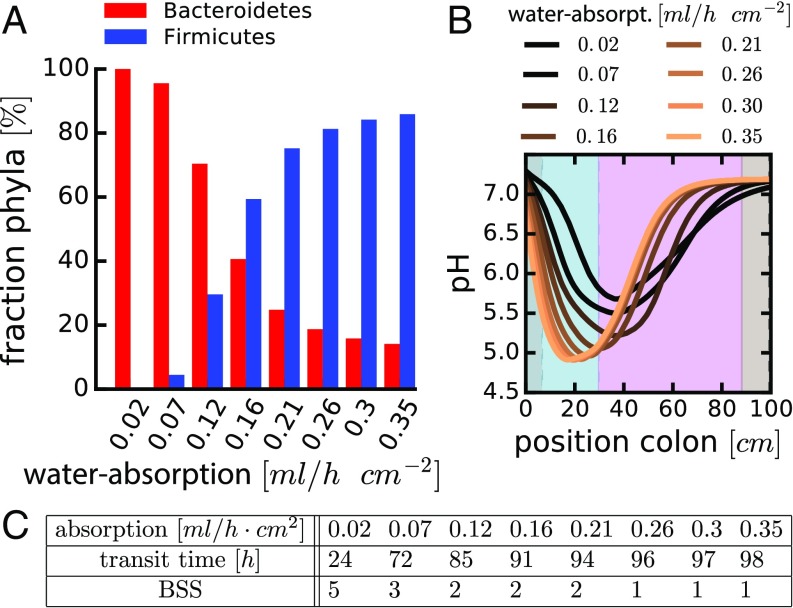
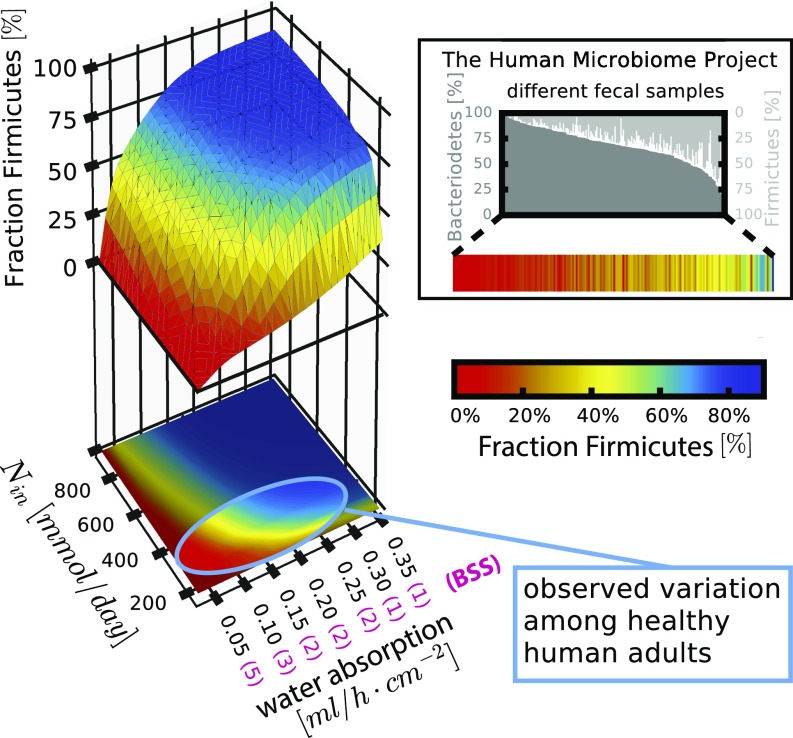
The human gut harbors a dynamic microbial community whose composition bears great importance for the health of the host. Here, we investigate how colonic physiology impacts bacterial growth, which ultimately dictates microbiota composition. Combining measurements of bacterial physiology with analysis of published data on human physiology into a quantitative, comprehensive modeling framework, we show how water flow in the colon, in concert with other physiological factors, determine the abundances of the major bacterial phyla. Mechanistically, our model shows that local pH values in the lumen, which differentially affect the growth of different bacteria, drive changes in microbiota composition. It identifies key factors influencing the delicate regulation of colonic pH, including epithelial water absorption, nutrient inflow, and luminal buffering capacity, and generates testable predictions on their effects. Our findings show that a predictive and mechanistic understanding of microbial ecology in the gut is possible. Such predictive understanding is needed for the rational design of intervention strategies to actively control the microbiota.

Keywords: colon physiology; colonic pH; gut microbiota; stool consistency; water absorption.


Conflict of interest statement

The authors declare no conflict of interest.

Figures

Fig. 1.
Fig. 1.
Characterizing the growth physiology of Bacteroidetes and Firmicutes. Measurements for axenic cultures of Bt and Er as representatives of their respective phyla. (A) Excretion of the main fermentation products (SCFAs), (B) the biomass [optical density (OD) reached per millimolar glucose] and total SCFAs (millimolar SCFA secreted per unit OD) yields. (C) pH dependences of the growth rate for both strains. Circles indicate measured values, and lines represent logistic fits to the data. (D) Illustration of the differential pH feedback effect: Both Bacteroidetes and Firmicutes produce SCFAs that contribute to the acidification of their local environment. This acidification in turn inhibits bacterial growth, more strongly for Bacteroidetes than for Firmicutes. Because Bacteroidetes grows faster than Firmicutes at neutral pH (C), it has a growth advantage over Firmicutes at higher pH, whereas the reverse is true at lower pH. The values shown in A and B were averaged over different pH values characterized; see SI Appendix, Fig. S1, for the full dataset of SCFA excretion at various pH values. Error bars denote SD.
Fig. 2.
Fig. 2.
Physiological parameters of the human colon. (A) Anatomical dimensions. Based on measurements of human colonic anatomy during autopsy (49, 50), X-ray and CT imaging using contrast media (51, 52), and magnetic resonance tomography imaging (53), we derived operational numbers for the lengths, surface areas, and luminal diameters of the different colonic segments (SI Appendix, section 2.1). (B) Luminal flow. About 1.5 L of fluid reaches the proximal colon every day (54, 55). The epithelium absorbs most of this volume (54, 56, 57), and only 100–200 mL per day exit the colon as feces (57). This continuous water uptake along the colon leads to a steep gradient in luminal flow rates. We calculated an average flow velocity of about 30 μm/s at the beginning of the colon that drops to about 5 μm/s by the end of the ascending colon (see SI Appendix, section 2.2, for details). (C) Mixing of luminal contents. Contractions of the intestinal walls can generate local mixing (11, 22, 58). Based on data on the mixing of radiolabeled dyes in the large intestine (40), we derive that the measured distributions can be approximated by an effective diffusion constant of D ∼ 106 μm2/s, a value orders of magnitude higher than molecular diffusion (see SI Appendix, Fig. S9 and section 2.4, for full analysis). (D) Epithelial SCFA uptake, bicarbonate excretion, and buffer chemistry. Bacterial fermentation leads to production of SCFAs, which are taken up by the gut epithelium and contribute to the host’s energy intake. SCFA uptake is coupled to the excretion of bicarbonate, which, in equilibrium with CO2 and other luminal components, buffer the luminal acidity (pH = −log[H+]). All calculations are based on the measured characteristics of epithelial transporters and buffer capacity of the lumen (59); see SI Appendix, sections 2.8, 2.9, and 4, for details.
Fig. 3.
Fig. 3.
Spatial profiles along the colon predicted for standard Western diet. Results of the model with a nutrient influx of 300 mmol glucose equivalents per day entering the colon. Spatial profiles for different variables are plotted: (A) local densities and (B) growth rates of Bacteroidetes (red) and Firmicutes (blue); (C) local nutrient (orange) and total SCFA (black) concentrations; (D) local pH values. The background colors correspond to the different sections of the colon as illustrated in Fig. 2A. Only the first 100 cm of the colon are shown here, as all observables remain effectively unchanged further downstream. Parameters are given in SI Appendix, Tables S1 and S2. Results shown here are for simulations after 120 h. Temporal dynamics along the length of the colon is shown in SI Appendix, Fig. S3, for recovery from a low initial bacterial density profile.
Fig. 4.
Fig. 4.
Changing nutrient intake affects microbiota composition and SCFA availability. The spatiotemporal dynamics of bacterial growth was analyzed for different rates of nutrient influx (Nin, in millimoles of glucose equivalents per day). (A) Relative abundance of Bacteroidetes and Firmicutes in the distal colon (mimicking “fecal” content), depending on nutrient influx. (B) pH profiles along the length of the colon; each colored line represents the result of a specific nutrient influx. (C) Epithelial uptake of different SCFAs (integrated along the length of the colon) for different nutrient influx. SCFA ratios are calculated based on measured excretion rates (Fig. 1A) and model results for phyla composition in A. Table provides the relationship between the nutrient influx (Nin), their corresponding energy content (Ein), and the amount of energy taken up by the epithelium in the form of SCFAs (Eup). The case of Nin = 300 mmol/d corresponds to the results shown in Fig. 3. Other parameters are as in SI Appendix, Tables S1 and S2. Values in A for position x = 1.89 m (end of colon). Values in C estimated by average excretion profiles of different strains (Fig. 1A and SI Appendix, section 5.7). Simulation for 120 h. Profiles of other variables are shown in SI Appendix, Fig. S7 A–C.
Fig. 5.
Fig. 5.
The effect of colonic water uptake on microbiota composition. (A) Relative abundances of Bacteroidetes and Firmicutes in the distal colon for different values of water uptake. (B) pH profiles along the length of the colon; each colored line represents the result for a specific level of water absorption (water-absorpt). (C) Table relates water uptake to colonic transit times (TT) and stool consistency (BSS); see SI Appendix, section 5.8 and Fig. S5, for how these relations were determined. Water uptake of 0.25 mL/h⋅cm2 corresponds to the results shown in Fig. 3. Other parameters are as in SI Appendix, Tables S1 and S2. Values in A for position x = 1.89 m (end of colon). Simulations for 120 h. Profiles of other variables are shown in SI Appendix, Fig. S7 D–F. Similar results are observed for changes in water inflow and outflow rates (SI Appendix, Fig. S8).
Fig. 6.
Fig. 6.
Variation in microbiota composition for typical physiological parameters of the human host. Summarized results of our model investigating how the interplay of human and bacterial physiology mediated by water flow, absorption, and active mixing shape microbiota composition. The 3D plot shows the fraction of Firmicutes depending on the nutrient influx rate and the rate of water uptake, as manifested by stool consistency (BSS). The bright area highlighted on the 2D projection indicates the parameter variations estimated for healthy adults consuming a Western diet (SI Appendix, sections 2.6 and 5.8). The bar plot in the Inset shows data on phyla composition in 242 healthy subjects from the Human Microbiome Project (6) (heat map corresponds to heat map in main panel). The observed variation in phyla can be readily accounted for by differences in nutrient intake and stool consistency. Corroborating this observation, BSS has been identified as the single most important determinant for microbiota composition among 69 covariates studied (44). Parameters are as in SI Appendix, Tables S1 and S2. Simulation for 120 h. Values for x = 1.89 m (end of colon).

Similar articles

Cited by

References

    1. Moore WE, Holdeman LV. Human fecal flora: The normal flora of 20 Japanese-Hawaiians. Appl Microbiol. 1974;27:961–979. - PMC - PubMed
    1. Langendijk PS, et al. Quantitative fluorescence in situ hybridization of Bifidobacterium spp. with genus-specific 16S rRNA-targeted probes and its application in fecal samples. Appl Environ Microbiol. 1995;61:3069–3075. - PMC - PubMed
    1. Suau A, et al. Direct analysis of genes encoding 16S rRNA from complex communities reveals many novel molecular species within the human gut. Appl Environ Microbiol. 1999;65:4799–4807. - PMC - PubMed
    1. Sender R, Fuchs S, Milo R. Are we really vastly outnumbered? Revisiting the ratio of bacterial to host cells in humans. Cell. 2016;164:337–340. - PubMed
    1. Bäckhed F, Ley RE, Sonnenburg JL, Peterson DA, Gordon JI. Host-bacterial mutualism in the human intestine. Science. 2005;307:1915–1920. - PubMed

Publication types

MeSH terms