

Functional Optical Imaging of Primary Human Tumor Organoids: Development of a Personalized Drug Screen
- PMID: 28588148
- PMCID: PMC12079173
- DOI: 10.2967/jnumed.117.192534
Functional Optical Imaging of Primary Human Tumor Organoids: Development of a Personalized Drug Screen
Abstract
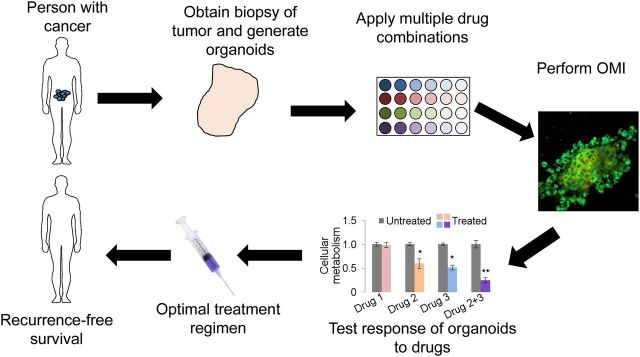
Primary tumor organoids are a robust model of individual human cancers and present a unique platform for patient-specific drug testing. Optical imaging is uniquely suited to assess organoid function and behavior because of its subcellular resolution, penetration depth through the entire organoid, and functional endpoints. Specifically, optical metabolic imaging (OMI) is highly sensitive to drug response in organoids, and OMI in tumor organoids correlates with primary tumor drug response. Therefore, an OMI organoid drug screen could enable accurate testing of drug response for individualized cancer treatment. The objective of this perspective is to introduce OMI and tumor organoids to a general audience in order to foster the adoption of these techniques in diverse clinical and laboratory settings.
Keywords: 3D culture; cancer drug screens; fluorescence imaging; multiphoton microscopy; optical; primary human spheroids.
© 2017 by the Society of Nuclear Medicine and Molecular Imaging.
Figures
Similar articles
-
Optical Imaging of Drug-Induced Metabolism Changes in Murine and Human Pancreatic Cancer Organoids Reveals Heterogeneous Drug Response.Pancreas. 2016 Jul;45(6):863-9. doi: 10.1097/MPA.0000000000000543. Pancreas. 2016. PMID: 26495796 Free PMC article.
-
Patient-Derived Cancer Organoid Cultures to Predict Sensitivity to Chemotherapy and Radiation.Clin Cancer Res. 2019 Sep 1;25(17):5376-5387. doi: 10.1158/1078-0432.CCR-18-3590. Epub 2019 Jun 7. Clin Cancer Res. 2019. PMID: 31175091 Free PMC article.
-
Application of Cancer Organoid Model for Drug Screening and Personalized Therapy.Cells. 2019 May 17;8(5):470. doi: 10.3390/cells8050470. Cells. 2019. PMID: 31108870 Free PMC article. Review.
-
Advances and Applications of Cancer Organoids in Drug Screening and Personalized Medicine.Stem Cell Rev Rep. 2024 Jul;20(5):1213-1226. doi: 10.1007/s12015-024-10714-6. Epub 2024 Mar 27. Stem Cell Rev Rep. 2024. PMID: 38532032 Review.
-
Tumor Organoid as a Drug Screening Platform for Cancer Research.Curr Stem Cell Res Ther. 2024;19(9):1210-1250. doi: 10.2174/011574888X268366230922080423. Curr Stem Cell Res Ther. 2024. PMID: 37855289 Review.
Cited by
-
Cancer organoids: A platform in basic and translational research.Genes Dis. 2023 Apr 12;11(2):614-632. doi: 10.1016/j.gendis.2023.02.052. eCollection 2024 Mar. Genes Dis. 2023. PMID: 37692477 Free PMC article. Review.
-
Coculture of tumor organoids with pathogenic microorganisms: a novel system to mimic in vivo pathogenic infection.Front Cell Infect Microbiol. 2025 Jun 30;15:1601688. doi: 10.3389/fcimb.2025.1601688. eCollection 2025. Front Cell Infect Microbiol. 2025. PMID: 40661971 Free PMC article. Review.
-
Kinetic Analysis of Lipid Metabolism in Breast Cancer Cells via Nonlinear Optical Microscopy.Biophys J. 2020 Jul 21;119(2):258-264. doi: 10.1016/j.bpj.2020.06.007. Epub 2020 Jun 12. Biophys J. 2020. PMID: 32610090 Free PMC article.
-
Establishment and characterization of a sigmoid colon cancer organoid with spinal metastasis.Front Cell Dev Biol. 2025 Jan 3;12:1510264. doi: 10.3389/fcell.2024.1510264. eCollection 2024. Front Cell Dev Biol. 2025. PMID: 39830210 Free PMC article.
-
Microphysiological model of renal cell carcinoma to inform anti-angiogenic therapy.Biomaterials. 2022 Apr;283:121454. doi: 10.1016/j.biomaterials.2022.121454. Epub 2022 Mar 11. Biomaterials. 2022. PMID: 35299086 Free PMC article.
References
Publication types
MeSH terms
Grants and funding
LinkOut - more resources
Full Text Sources
Other Literature Sources