. 2017 Jun 6;7(1):2861.
doi: 10.1038/s41598-017-01994-9.

Metabolic injury-induced NLRP3 inflammasome activation dampens phospholipid degradation

Affiliations

Metabolic injury-induced NLRP3 inflammasome activation dampens phospholipid degradation

Elena Rampanelli et al. Sci Rep. .

Abstract

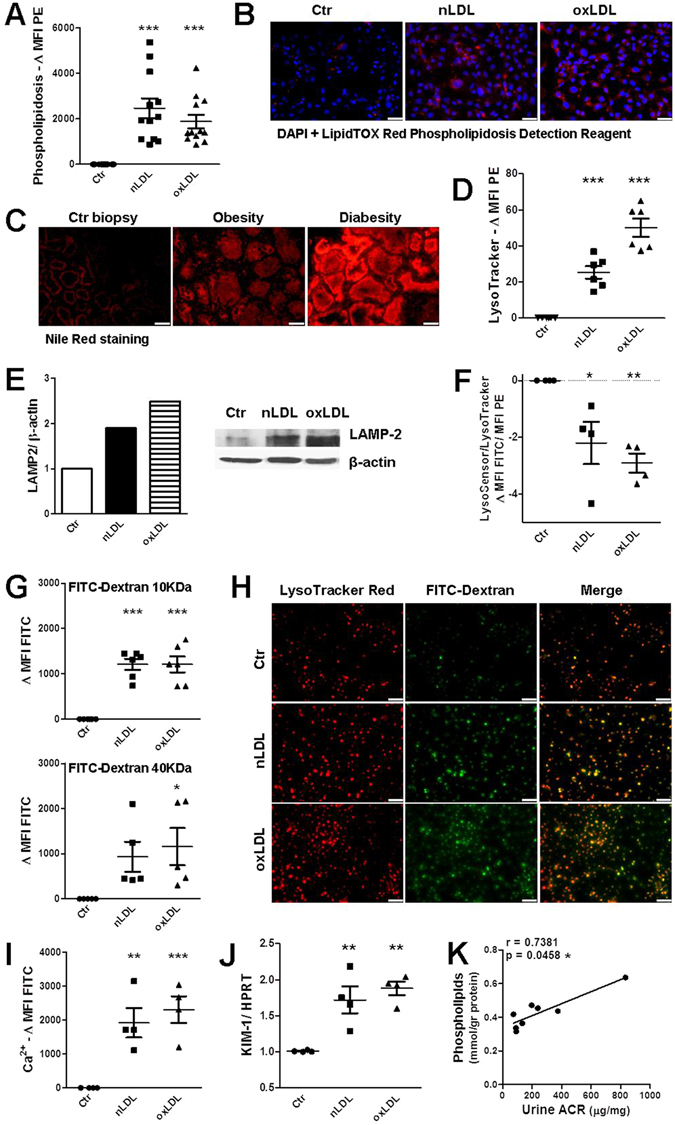
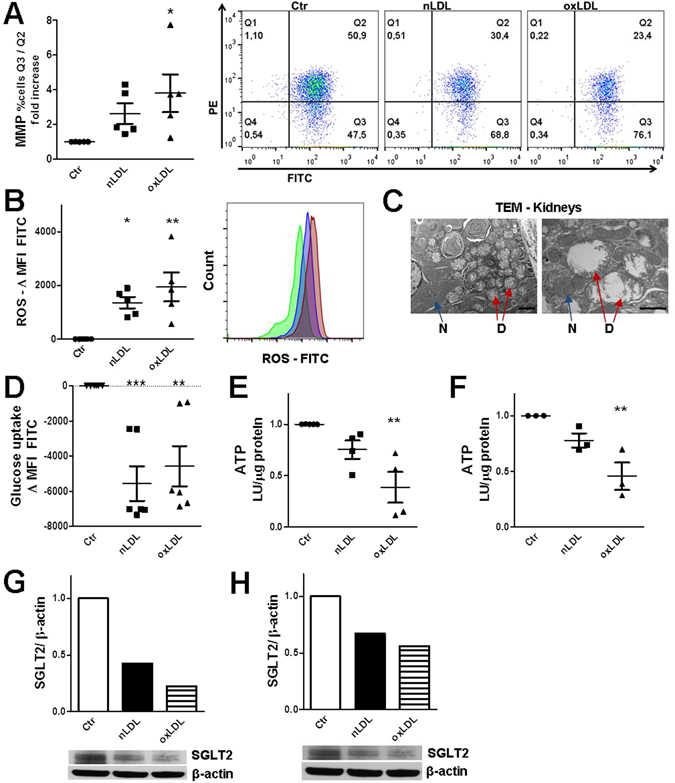
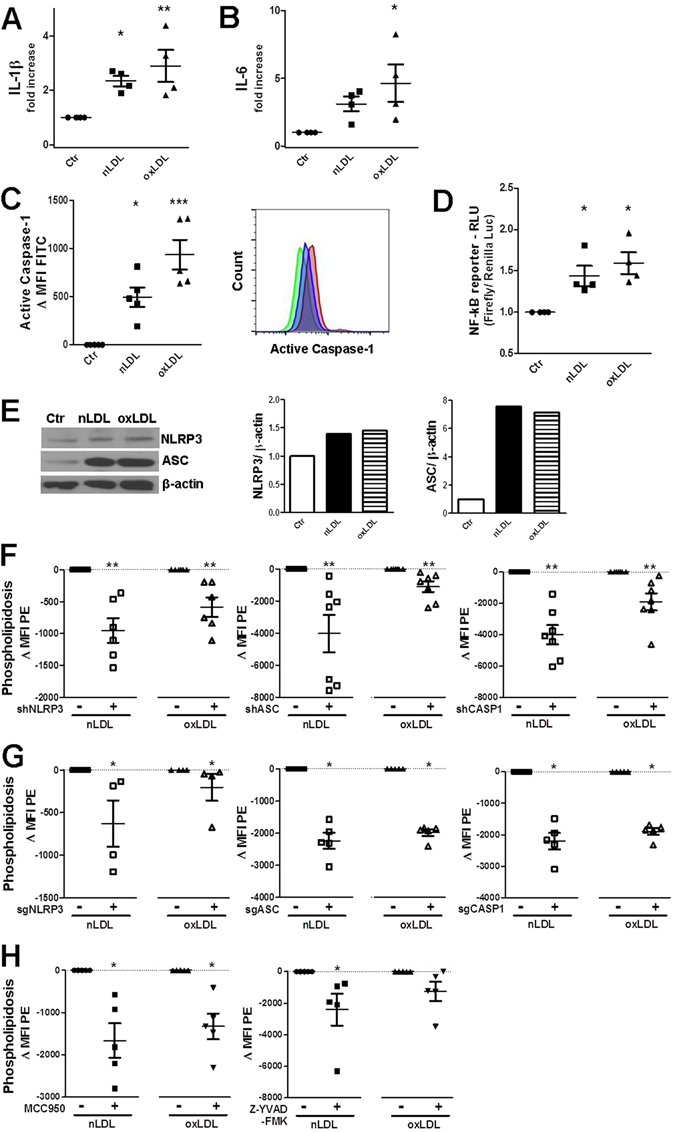
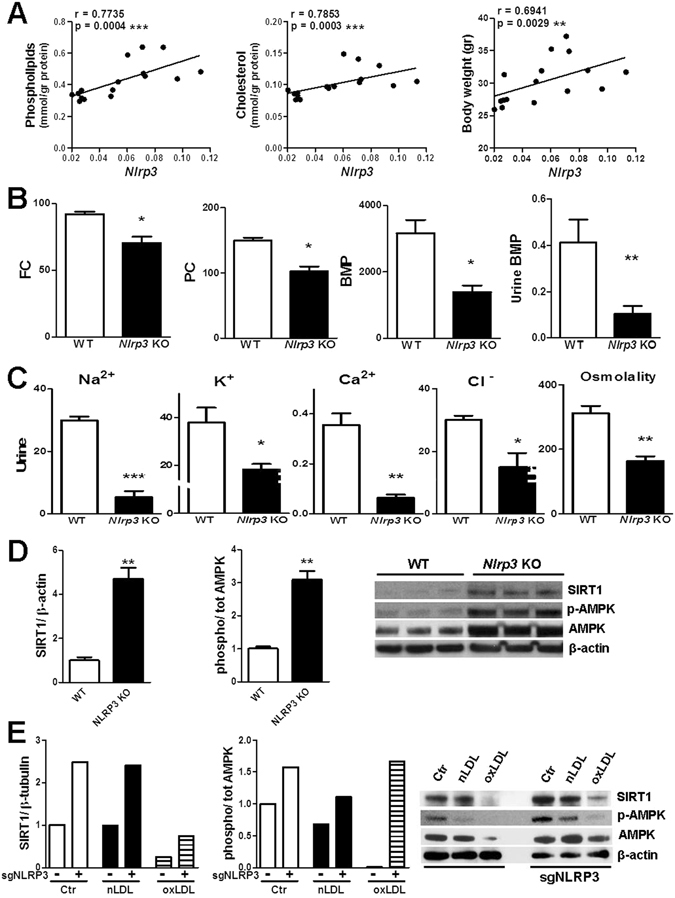
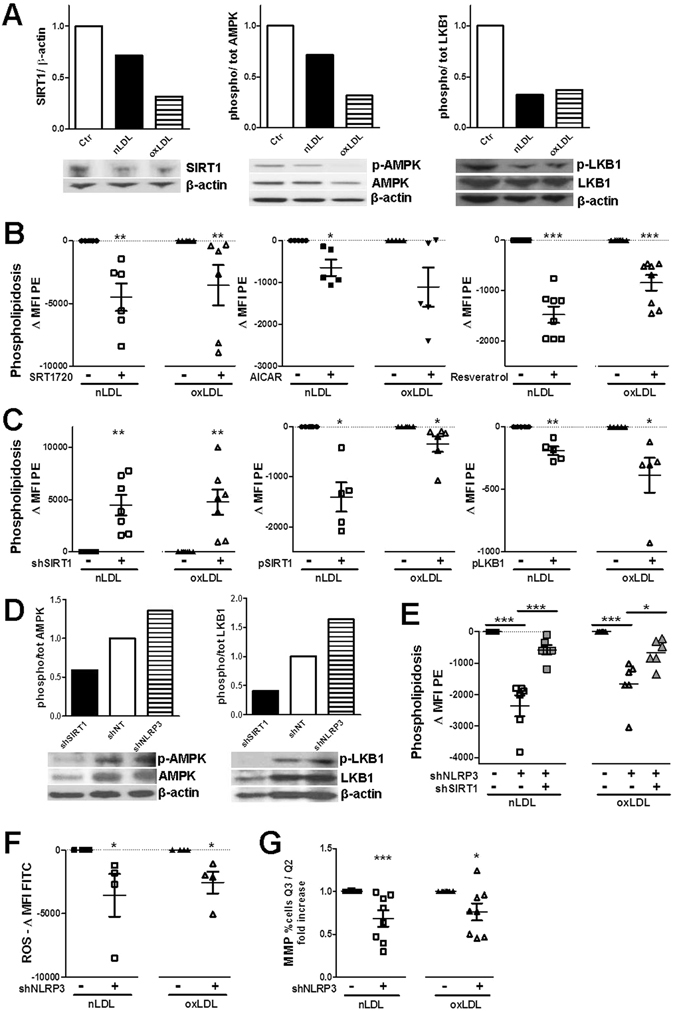
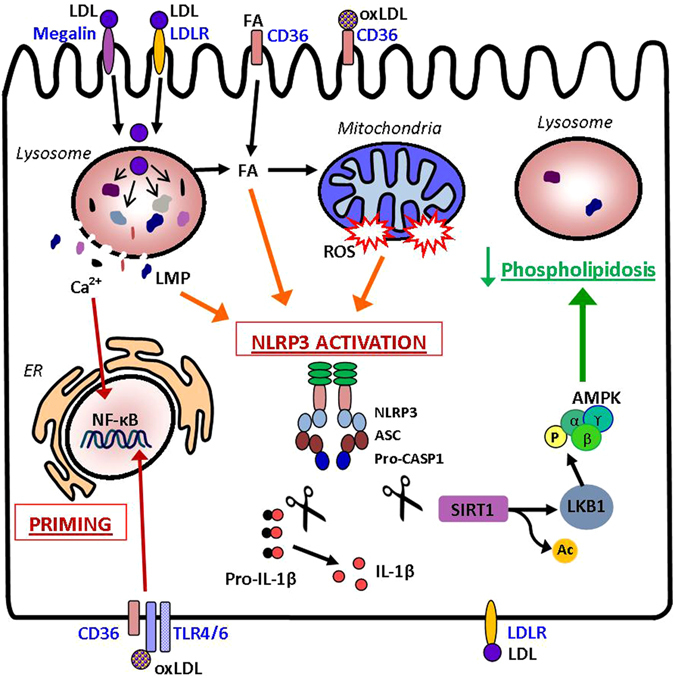
The collateral effects of obesity/metabolic syndrome include inflammation and renal function decline. As renal disease in obesity can occur independently of hypertension and diabetes, other yet undefined causal pathological pathways must be present. Our study elucidate novel pathological pathways of metabolic renal injury through LDL-induced lipotoxicity and metainflammation. Our in vitro and in vivo analysis revealed a direct lipotoxic effect of metabolic overloading on tubular renal cells through a multifaceted mechanism that includes intralysosomal lipid amassing, lysosomal dysfunction, oxidative stress, and tubular dysfunction. The combination of these endogenous metabolic injuries culminated in the activation of the innate immune NLRP3 inflammasome complex. By inhibiting the sirtuin-1/LKB1/AMPK pathway, NLRP3 inflammasome dampened lipid breakdown, thereby worsening the LDL-induced intratubular phospholipid accumulation. Consequently, the presence of NLRP3 exacerbated tubular oxidative stress, mitochondrial damage and malabsorption during overnutrition. Altogether, our data demonstrate a causal link between LDL and tubular damage and the creation of a vicious cycle of excessive nutrients-NLRP3 activation-catabolism inhibition during metabolic kidney injury. Hence, this study strongly highlights the importance of renal epithelium in lipid handling and recognizes the role of NLRP3 as a central hub in metainflammation and immunometabolism in parenchymal non-immune cells.


Conflict of interest statement

The authors declare that they have no competing interests.

Figures

Figure 1
Figure 1
Lysosomal alterations induced by n/oxLDL loading in tubular cells. (A,B) Endolysosomal phospholipid accumulation detected by HSC LipidTox Red Phospholipidosis Detection Reagent at day 3. (A) Rise in phospholipidosis in HK2 tubular cells as compared to control (Ctr) (FC). MFIs of controls subtracted from the MFIs of n/oxLDL-treated cells. (B) Fluorescence microscopy images of control and LDL-loaded HK2 tubular cells to visualize phospholipidosis (red) and nuclei (blue, DAPI). Scale bar, 50 µm. (C) Nile Red staining of human frozen renal sections from individuals with no metabolic disorders, obesity with hyperlipidemia or with diabetes. Background staining digitally subtracted. Scale bar, 50 µm. (DF) Lysosomal alterations upon n/oxLDL exposure for 3 days. (D) FC analysis of the PE fluorescence intensity emitted by LysoTracker Red-labelled endolysosomes in alive HK2 cells. MFIs normalized to controls by subtraction. (E) Western blot for LAMP-2 using HK2 cells lysates. Intensity normalized to β-actin loading control. Protein expression shown as fold increase compared to control equal to 1. (F) Changes in lysosomal acidity detected by pH-dependent LysoSensor Green probe. Dotplots showing FITC intensity in relation to the PE intensity of LysoTracker Red stained lysosomes (FC). (G) FC analysis of HK2 cells exposed to FITC-Dextran 10/40 KDa for 90 min after 3 days treatment with LPDS or n/oxLDL. Control group MFIs subtracted from MFIs of n/oxLDL groups. (H) 40 KDa FITC-Dextran (green) leakage from the lysosomes (red) of 3 days treated HK2 cells. Scale bar, 50 µm. (I) Cytoplasmic calcium detected by the Fluo-4-AM Ca2+ indicator (FC). Differences in FITC MFIs. (J) QPCR analysis for KIM-1 gene expression normalized for HPRT, relative to control. (K) Spearman rank correlation between urinary albumin to creatinine ratio (ACR, µg/mg) and renal phospholipid content (mmol/gr protein). WT mice fed a control or Western-diet; n = 8. (A,B,D–J) All assays performed after 3 days loading. Dots representing averages of independent experiments. Data shown as mean ± SEM; *P < 0.05, **P < 0.01, ***P < 0.001.
Figure 2
Figure 2
Mitochondrial damage and loss of tubular functional properties. (A) Mitochondria membrane permeabilization (MMP) assessed with MMP MITO-ID® Membrane Potential Detection cationic dye that fluoresces either green (as monomer in the cytosol) or orange (as aggregate in the mitochondria) depending upon membrane potential status. MMP indicated by increased ratio of %FITC + PE −/%FITC + PE + HK2 cells, quadrants Q3/Q2 of the scatterplot (FC). Data normalized to Ctr ( = 1). (B) Oxidative stress detected by Green fluorescent ROS Detection Reagent (FC). Data normalized by subtracting Ctr MFIs. Histogram plotting the FITC picks of HK2 cells exposed to LPDS (green), LDL (blue) and oxLDL (red). (C) Transmission electron microscope images of kidney sections derived from mice fed a Western-diet. Arrows indicate damaged (D) and normal (N) mitochondria. Scale bars, 2 and 1 µm. (D) Uptake of green fluorescent deoxyglucose analog (2-NBDG) by MDCK cells (FC). Control MFIs subtracted from n/oxLDL MFIs, negative values indicative of a reduction in 2-NBDG uptake. (E) Luminescent ATP Detection in MDCK and (F) HK2 cells. Data shown as ratio luminescence unit (LU)/µg protein of cell lysates divided by the Ctr values (Ctr = 1). (G,H) Westernblot for SGLT2 using protein lysates of HK2 cells after (G) 5 or (H) 3 days treatment. β-actin used as loading control. SGLT2 expression normalized to Ctr ( = 1). (A,B,H) Assays at day 3, (DG) day 5. In dotplot graphs, each dot represents the average of one independent experiment; mean ± SEM; *P < 0.05, **P < 0.01, ***P < 0.001.
Figure 3
Figure 3
Activation of NLRP3 inflammasome during metabolic stress and regulation of phospholipidosis by the NLRP3/ASC/CASP1 complex. (A) Secretion of IL-1β and (B) IL-6 by IM-PTEC (ELISA). Cytokine concentrations (pg/ml) relative to Ctr equal to 1. (C) FC-based detection of active caspase-1 in HK2 cells using the green fluorescent FAM-YVAD-FMK. FITC MFI Ctr values subtracted from all MFIs values. FITC peaks shown in the right histogramplot: green (Ctr), blue (nLDL), red (oxLDL). (D) Dual-luciferase assay measuring the activities of NF-κB-driven Firefly luciferase (NF-κB reporter vector) and Renilla luciferase (control construct) in cell lysates of transfected HK2 cells. Values show relative luminescence units (RLU):Firefly/Renilla LU normalized to Ctr. (E) Westernblot for detection of NLRP3 and ASC in HK2 cells. Intensity normalized to β-actin loading control. Protein expression shown as fold increase compared to control equal to 1. (F) Phospholipidosis detection by FC after n/oxLDL loading in HK2 cells stably expressing lentiviral constructs encoding shRNA or (G) sgRNA targeting NLRP3, ASC, or CASP1 expression. Graphs showing the reduction in lipid storage in cells lacking full expression of the target gene in comparison to cells expressing the non-targeting sequence/empty vector. (H) Decline in fluorescence intensity emitted by LipidTox Red stained HK2 cells treated with NLRP3 (MCC950) and CASP1 (Z-YVAD-FMK) inhibitors (FC). (A–D,F,G) Dots representing averages of independent experiments; mean ± SEM; *P < 0.05, **P < 0.01, ***P < 0.001.
Figure 4
Figure 4
Differential lipid and protein expression in kidneys and cultured tubular cells lacking NLRP3. (A) Spearman rank correlation between Nlrp3 renal gene expression and total renal phospholipid content, cholesterol (mmol/gr protein) and mice body weight (gr). WT mice fed a control or Western-diet; n = 16. (B) Mass spectrometry analysis of lipid content in kidney tissues and urine from WT and Nlrp3 knockout mice on a Western-cholesterol enriched diet. Renal lipid species normalized for mg proteins: free-cholesterol (FC, nmol/mg protein), phosphatidylcholine (PC, nmol/mg protein), bis(mono)acylglycerol phosphate (BMP, pmol/mg protein); n = 4. Urine BMP (µmol/l) normalized for urine levels of creatinine (µmol/l); n = 8. (C) Urinary electrolyte concentrations (mmol/l) and urine osmolality (mOsm/kg) normalised for creatinine content (mmol/l); urine samples from WT and Nlrp3 KO mice after 16 weeks of WD; n = 3. (D) Westernblot: SIRT1 expression and phosphorylation rate of AMPK in WT/Nlrp3 KO kidneys of mice on a Western-diet; β-actin used as loading control. Data normalized to the values of WT kidneys; n = 3. (E) Westernblot showing the differences in full-length SIRT1 and AMPK activation rate between HK2 cells stably expressing or not sgRNA targeting NLRP3 gene expression after 3 days treatment; β-actin used as loading control. Intensity values normalized to values of control cells transduced with empty vector. Data presented as mean ± SEM; *P < 0.05, **P < 0.01, ***P < 0.001.
Figure 5
Figure 5
Negative regulation of SIRT1/LKB1/AMPK pathway by NLRP3/ASC/CASP1 immunocomplex. (A) Westernblots showing the expression of SIRT1, phosphorylated and total AMPK and LKB1 in HK2 cell lysates. Control value equal to 1 after normalization; β-actin used as loading control. (B) Use of SIRT1 activator (SRT1720) and AMPK activators (AICAR and resveratrol) to reduce phospolipidosis in respect to untreated cells after LDL loading (FC). Data shown as differences in MFI values. (C) Effects of SIRT1 knockdown (shRNA), overexpression (expression plasmid) of SIRT1 and LKB1 on the rate of endolysosomal phospholipid content in HK2 TEC in respect to their respective controls (non-targeting shRNA, empty vector). Data shown as differences in MFI values (FC). (D) Westernblot showing the activation rate of AMPK and LKB1 in LDL-loaded HK2 cells stably expressing shRNA targeting SIRT1/NLRP3 or non-targeting shRNA (shNT); β-actin used as loading control. Controls (shNT = 1) used for normalization. (E) Phospholipid storage in HK2 TEC expressing shRNA for NLRP3/SIRT1 gene silencing (FC). MFI values of non-targeting shRNA expressing cells subtracted from all MFIs. (F) Oxidative stress detected by Green fluorescent ROS Detection Reagent (FC). Differences in MFI values of HK2 cells expressing shRNA targeting NLRP3 as compared to cells expressing shNT. (F) Mitochondria damage assessed with the MMP MITO-ID® assay; variations of MMP indicated by increased ratio of %FITC + PE-/%FITC + PE + HK2 cells (FC). Data normalized to values of cells expressing shNT ( = 1). (B,C,E,F,G) Dots representing averages of independent experiments. Mean ± SEM; *P < 0.05, **P < 0.01, ***P < 0.001.
Figure 6
Figure 6
Lipotoxicity-induced NLRP3 inflammasome activation in TEC. After uptake by TEC via LDLR and megalin, LDL particles are deliver to lysosomes for degradation releasing free-cholesterol and fatty acids (FA). FA can be directly uptaken by CD36 and boost mitochondria oxidation. oxLDL is recognized by CD36 and TLR4-TLR6 heterodimers. Excessive phagocytosis and impaired lysosomal hydrolysis of LDL particles cause phospholipidosis and lysosomal membrane permeabilization (LMP) allowing the release of lipase, cathepsins and Ca2+ into the cytoplasm. Lipoproteins and FA palmitate loading and calcium efflux can drive mitochondrial damage and ROS accumulation dropping ATP production and ATP-dependent functions. These effects occur in consequence to native and oxidized LDL uptake. NLRP3 inflammasome activation requires 2 signals: the 1st for priming and the 2nd for assembly. Priming is accomplished by NF-κB nuclear translocation induced by TLR4/6 and Ca2+ signaling. Lysosomal destabilization, mitochondrial damage, ROS, and saturated FA account for NLRP3 complex oligomerization and caspase-1 activation that in turn cleaves pro-IL-1β (maturation) and SIRT1 (inactivation). When activated, SIRT1 can deacetylate LKB1 allowing LKB1-mediated phosphorylation/activation of AMPK, an essential fuel gauge and promoter of mitochondrial β-oxidation and lipid catabolism. Thus, the metabolic stress-NLRP3/CASP1-SIRT1 cleavage pathway suppresses catabolic processes worsening the intralysosomal lipid deposition in TEC. Red arrows: priming; orange: NLRP3 activation; green: process counteracting lipotoxicity.

References

    1. Gluba A, et al. Metabolic syndrome and renal disease. Int J Cardiol. 2003;164(2):141–50. doi: 10.1016/j.ijcard.2012.01.013. - DOI - PubMed
    1. Chen J, et al. The metabolic syndrome and chronic kidney disease in U.S. adults. Ann Intern Med. 2004;140(3):167–74. doi: 10.7326/0003-4819-140-3-200402030-00007. - DOI - PubMed
    1. Iseki K, et al. Body mass index and the risk of development of end-stage renal disease in a screened cohort. Kidney Int. 2004;65(5):1870–6. doi: 10.1111/j.1523-1755.2004.00582.x. - DOI - PubMed
    1. Muntner P, Coresh J, Smith JC, Eckfeldt J, Klag MJ. Plasma lipids and risk of developing renal dysfunction: the atherosclerosis risk in communities study. Kidney Int. 2000;58(1):293–301. doi: 10.1046/j.1523-1755.2000.00165.x. - DOI - PubMed
    1. Skeldon AM, Faraj M, Saleh M. Caspases and inflammasomes in metabolic inflammation. Immunol Cell Biol. 2014;92(4):304–13. doi: 10.1038/icb.2014.5. - DOI - PubMed

Publication types

MeSH terms