. 2017 Jun 6;7(1):2822.
doi: 10.1038/s41598-017-02880-0.

Gut Dysbiosis and Neurobehavioral Alterations in Rats Exposed to Silver Nanoparticles

Affiliations

Gut Dysbiosis and Neurobehavioral Alterations in Rats Exposed to Silver Nanoparticles

Angela B Javurek et al. Sci Rep. .

Abstract

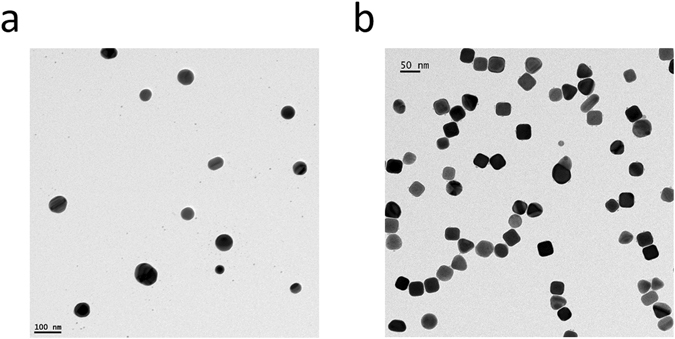
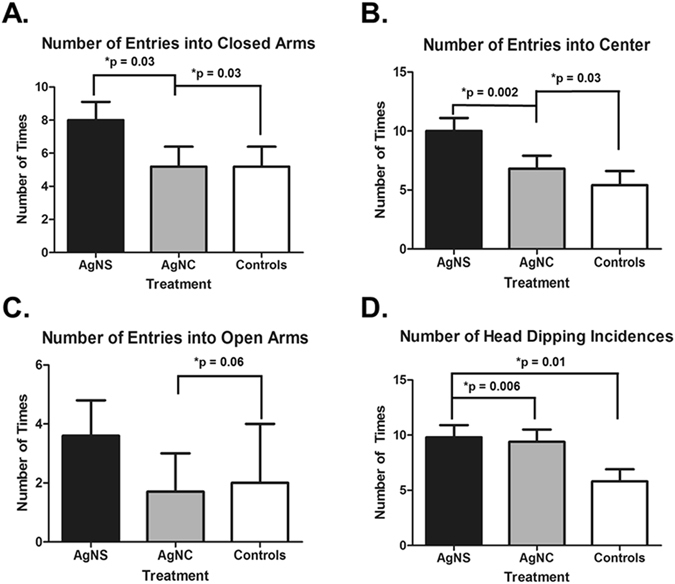
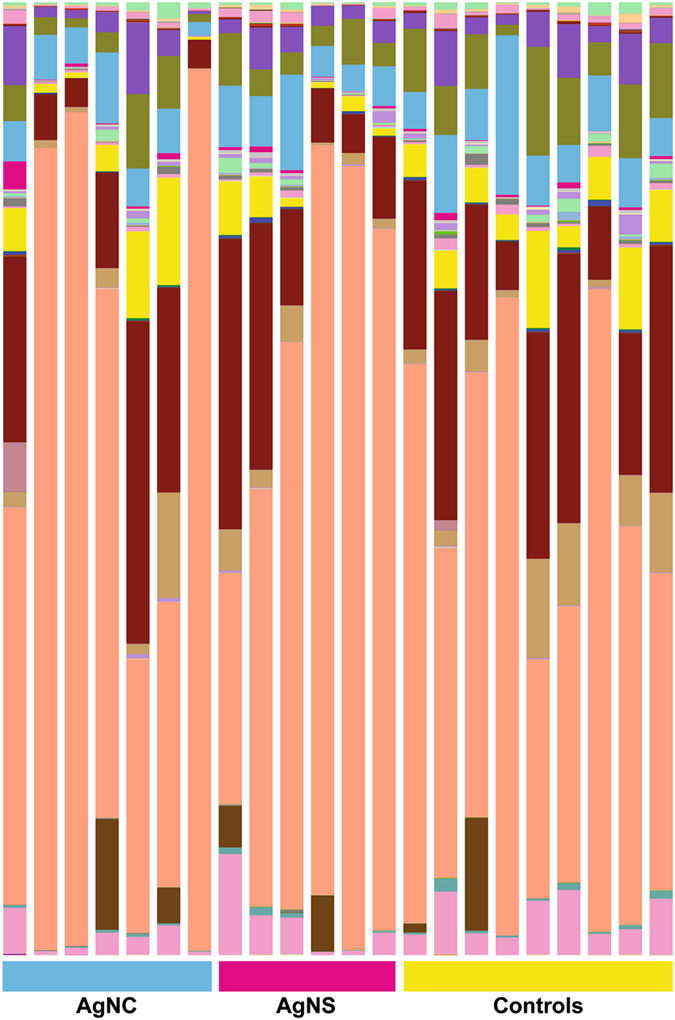
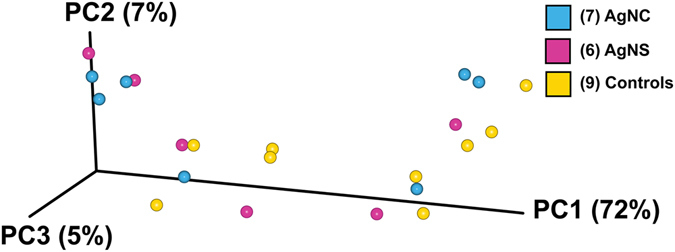
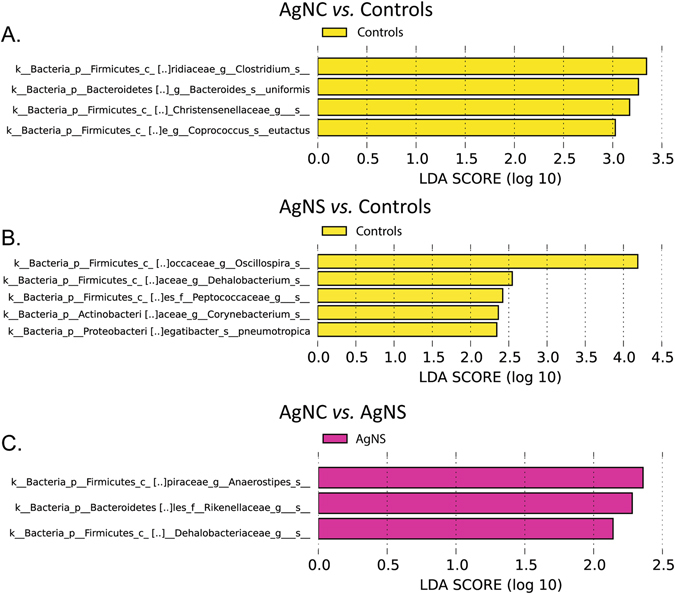
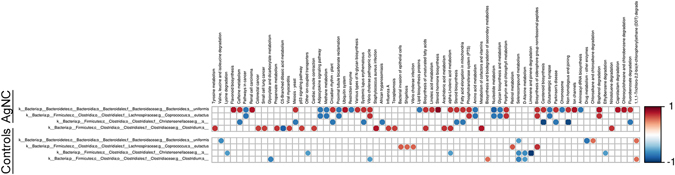
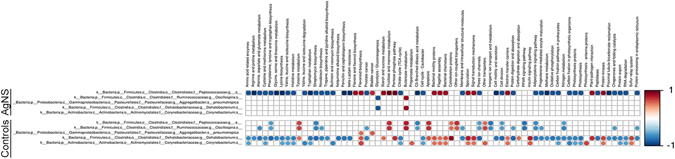
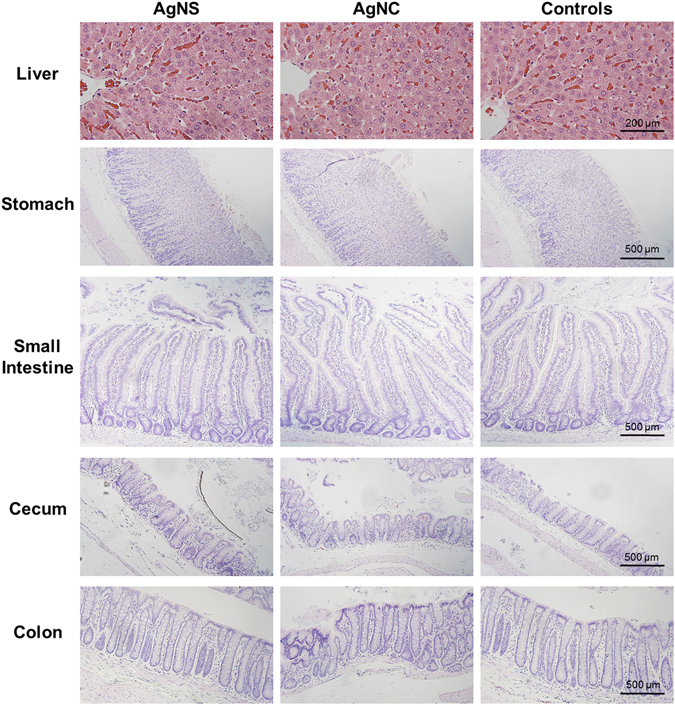
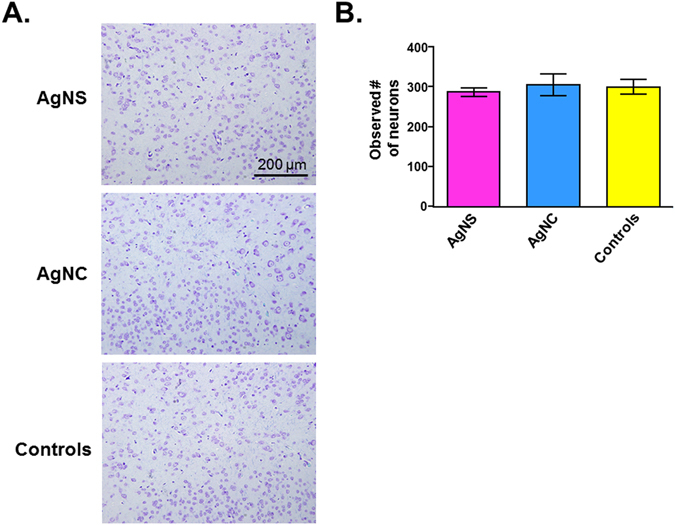
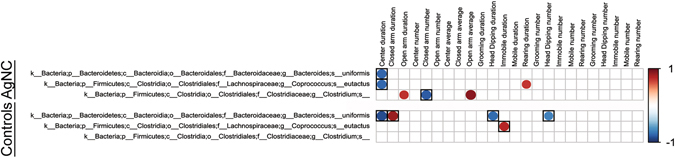
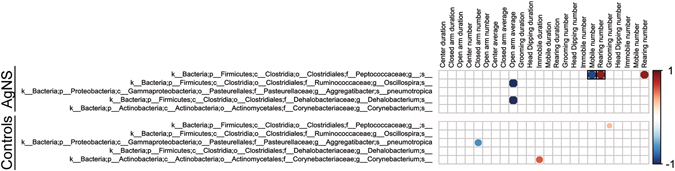
Due to their antimicrobial properties, silver nanoparticles (AgNPs) are being used in non-edible and edible consumer products. It is not clear though if exposure to these chemicals can exert toxic effects on the host and gut microbiome. Conflicting studies have been reported on whether AgNPs result in gut dysbiosis and other changes within the host. We sought to examine whether exposure of Sprague-Dawley male rats for two weeks to different shapes of AgNPs, cube (AgNC) and sphere (AgNS) affects gut microbiota, select behaviors, and induces histopathological changes in the gastrointestinal system and brain. In the elevated plus maze (EPM), AgNS-exposed rats showed greater number of entries into closed arms and center compared to controls and those exposed to AgNC. AgNS and AgNC treated groups had select reductions in gut microbiota relative to controls. Clostridium spp., Bacteroides uniformis, Christensenellaceae, and Coprococcus eutactus were decreased in AgNC exposed group, whereas, Oscillospira spp., Dehalobacterium spp., Peptococcaeceae, Corynebacterium spp., Aggregatibacter pneumotropica were reduced in AgNS exposed group. Bacterial reductions correlated with select behavioral changes measured in the EPM. No significant histopathological changes were evident in the gastrointestinal system or brain. Findings suggest short-term exposure to AgNS or AgNC can lead to behavioral and gut microbiome changes.


Conflict of interest statement

The authors declare that they have no competing interests.

Figures

Figure 1
Figure 1
TEM images silver nanoparticles (a) AgNS and (b) AgNC.
Figure 2
Figure 2
Hydrodynamic diameter changes for nanoparticles in different pH conditions: (a) AgNS and (b) AgNC.
Figure 3
Figure 3
Changes in surface charge (zeta potential) for nanoparticles in different pH conditions: (a) AgNS and (b) AgNC.
Figure 4
Figure 4
UV-visible spectral changes for nanoparticles in different pH conditions: (a,b) AgNS and (c,d) AgNC.
Figure 5
Figure 5
Elevated Plus Maze results. (A) Number of entries into the closed arms. (B) Number of entries into the center of the maze. (C) Number of entries into the open arms. (D) Number of head-dipping incidences. Significant results are indicated with bars and P values across the treatment comparisons.
Figure 6
Figure 6
Bar plot of fecal microbiome data from AgNC, AgNS, and control groups. Bar plot analysis of the most abundant bacterial classes in all three-treatment groups.
Figure 7
Figure 7
PCoA analysis of fecal microbiome data from AgNC, AgNS, and control groups. No clear distinctions are evident based on PCoA analysis. The PERMANOVA values for the three comparisons were: AgNC vs AgNS P = 0.18; AgNC vs Cont P = 0.50; P = AgNS vs Cont P = 0.26.
Figure 8
Figure 8
LEfSe analysis of fecal microbiome data from AgNC, AgNS, and control groups. (A) Comparison of AgNC to controls. The linear discriminant analysis (LDA) score revealed that Clostridium spp., Bacteroides uniformis, Christensenellaceae, and Coprococcus eutactus were greater in control rats than those treated with AgNC. No bacteria were greater in AgNC-exposed rats compared to controls. (B) Comparison of AgNS-treated rats to controls revealed that Oscillospira spp., Dehalobacterium spp., Peptococcaeceae, Corynebacterium spp., Aggregatibacter pneumotropica were greater in the latter group. No bacteria were greater in the AgNS group relative to controls. (C) Comparison of AgNS to AgNC groups showed that Anaerostipes spp., Rikenellaceae, and Dehalobacteriaeceae were greater in the former group. No bacteria were greater in the AgNC group relative to AgNS group.
Figure 9
Figure 9
Bacterial metabolic and other pathway differences in the fecal samples of AgNC-treated individuals vs. controls. As described in Fig. 7 of previously published article and in the Materials and Methods section, correlations between the PICRUSt-generated functional profile and QIIME-generated genus level bacterial abundance were calculated and plotted against treatment. Those genera with a LEfSe LDA score ≥2 between controls and BPA individuals are depicted. Metabolic pathway designations are delineated at the bottom of the figure. Shading intensity and size of the circles indicates the Kendall rank correlation coefficient between matrices. Orange/red indicates a positive correlation; whereas blue designates a negative correlationat a p value ≤ 0.05.
Figure 10
Figure 10
Bacterial metabolic and other pathway differences in the fecal samples of AgNS-treated individuals vs. controls. Data are presented as detailed in Fig. 9.
Figure 11
Figure 11
Comparison of liver and gastrointestinal tract following administration of silver nanoparticles (AgNC and AgNS). H&E stained representative tissue sections. Bar = 200 μm for liver and 500 μm for GI tract.
Figure 12
Figure 12
Comparison of neuronal density in the amygdala. (A) Cresyl violet-luxol fast blue staining of representative tissue sections. (B) Number of observed neurons per five 200x fields of view. Values are the mean ± SEM.
Figure 13
Figure 13
Correlations of fecal microbiota changes and EPM results in AgNC and control groups. This figure correlates the bacterial changes identified with LEfSe (Fig. 8) and the EPM results (Fig. 5). The correlations and data presented as detailed in Fig. 9. However, the values without a box only showed a statistical trend (P ≤ 0.1 for significance), whereas those with a black box were significant (P ≤ 0.05).
Figure 14
Figure 14
Correlations of fecal microbiota changes and EPM results in AgNS and control groups. This figure correlates the bacterial changes identified with LEfSe (Fig. 8) and the EPM results (Fig. 5). The correlations and data presented as detailed in Fig. 9. However, the values without a box only showed a statistical trend (P ≤ 0.1 for significance), whereas those with a black box were significant (P ≤ 0.05).

References

    1. Hadrup N, Lam HR. Oral toxicity of silver ions, silver nanoparticles and colloidal silver–a review. Regul Toxicol Pharmacol. 2014;68:1–7. doi: 10.1016/j.yrtph.2013.11.002. - DOI - PubMed
    1. Williams K, et al. Effects of subchronic exposure of silver nanoparticles on intestinal microbiota and gut-associated immune responses in the ileum of Sprague-Dawley rats. Nanotoxicology. 2015;9:279–289. doi: 10.3109/17435390.2014.921346. - DOI - PubMed
    1. Wilding, L. A. et al. Repeated dose (28-day) administration of silver nanoparticles of varied size and coating does not significantly alter the indigenous murine gut microbiome. Nanotoxicology 1–8, doi:10.3109/17435390.2015.1078854 (2015). - PMC - PubMed
    1. Merrifield DL, et al. Ingestion of metal-nanoparticle contaminated food disrupts endogenous microbiota in zebrafish (Danio rerio) Environ Pollut. 2013;174:157–163. doi: 10.1016/j.envpol.2012.11.017. - DOI - PubMed
    1. Song Y, et al. Assessment of the Biological Effects of a Multifunctional Nano-Drug-Carrier and Its Encapsulated Drugs. J Proteome Res. 2015;14:5193–5201. doi: 10.1021/acs.jproteome.5b00513. - DOI - PubMed

MeSH terms