. 2017 Aug;174(16):2758-2772.
doi: 10.1111/bph.13901. Epub 2017 Jul 7.

Characterization of functional μ opioid receptor turnover in rat locus coeruleus: an electrophysiological and immunocytochemical study

Affiliations

Characterization of functional μ opioid receptor turnover in rat locus coeruleus: an electrophysiological and immunocytochemical study

María Carmen Medrano et al. Br J Pharmacol. 2017 Aug.

Abstract

Background and purpose: Regulation of μ receptor dynamics such as its trafficking is a possible mechanism underlying opioid tolerance that contributes to inefficient recycling of opioid responses. We aimed to characterize the functional turnover of μ receptors in the noradrenergic nucleus locus coeruleus (LC).

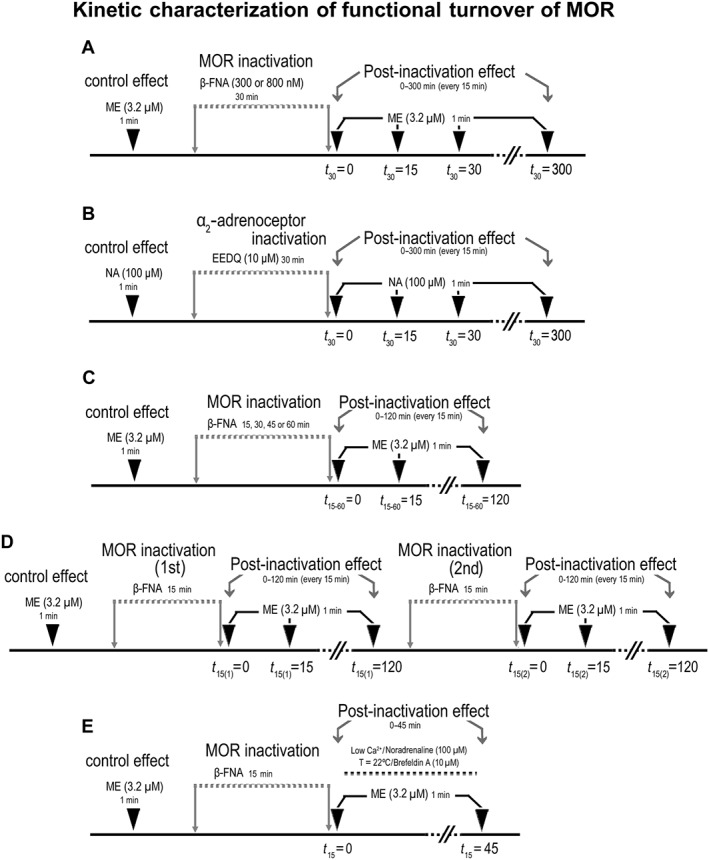
Experimental approach: We measured opioid effect by single-unit extracellular recordings of LC neurons from rat brain slices. Immunocytochemical techniques were used to evaluate μ receptor trafficking.

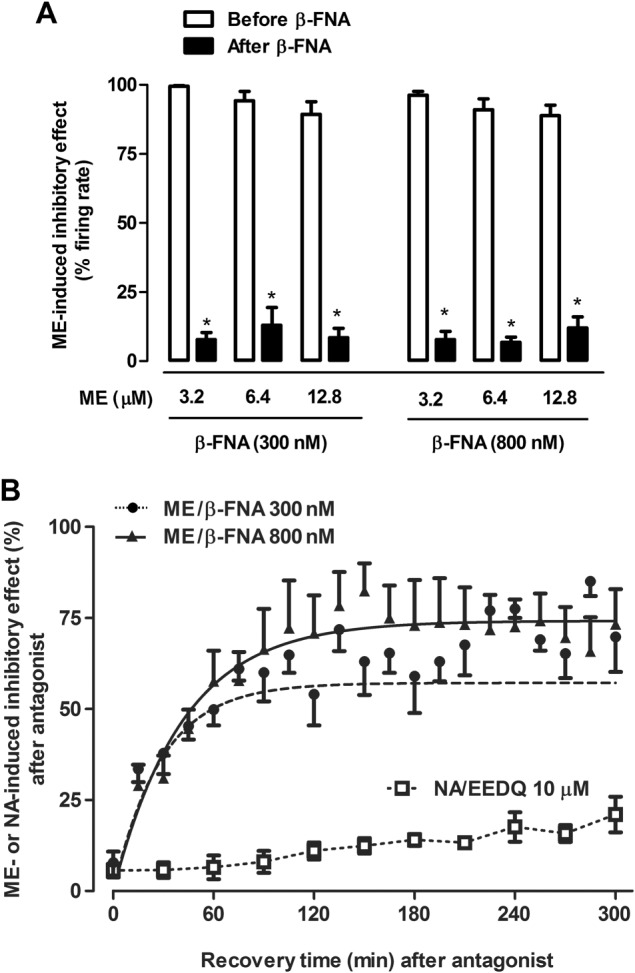
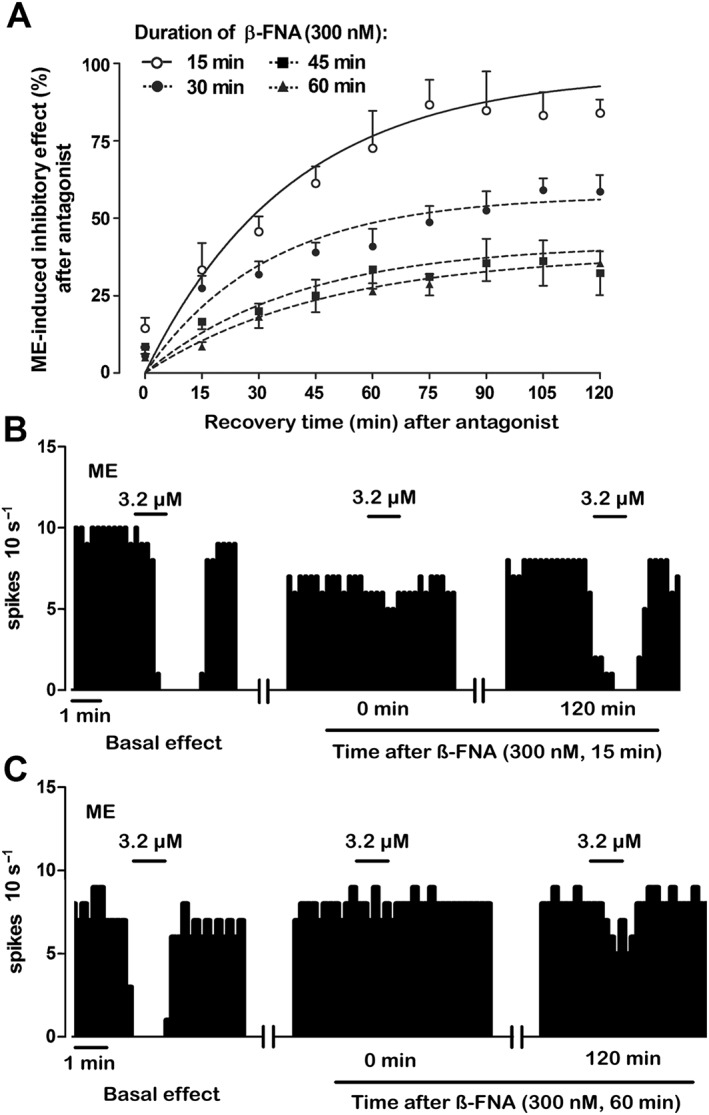
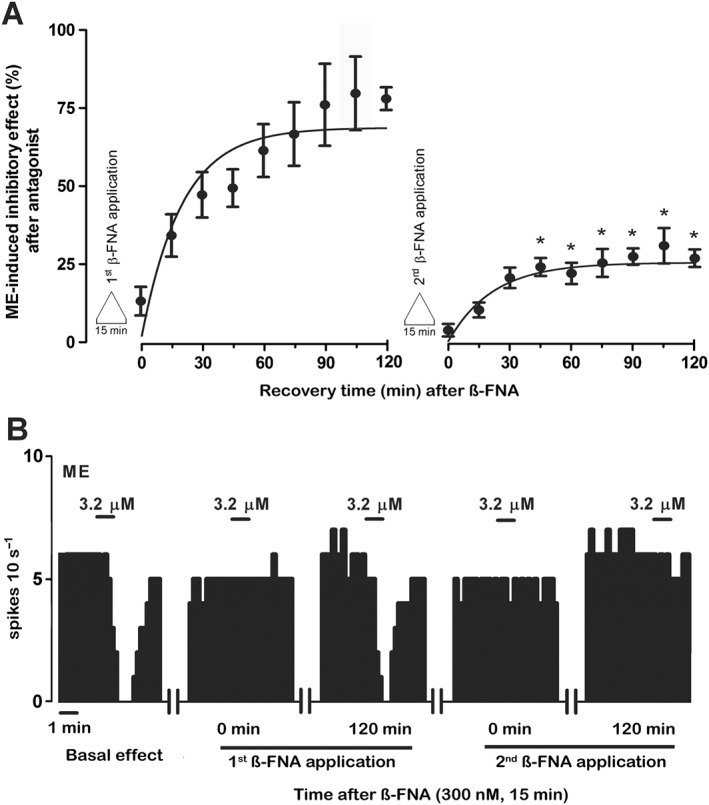
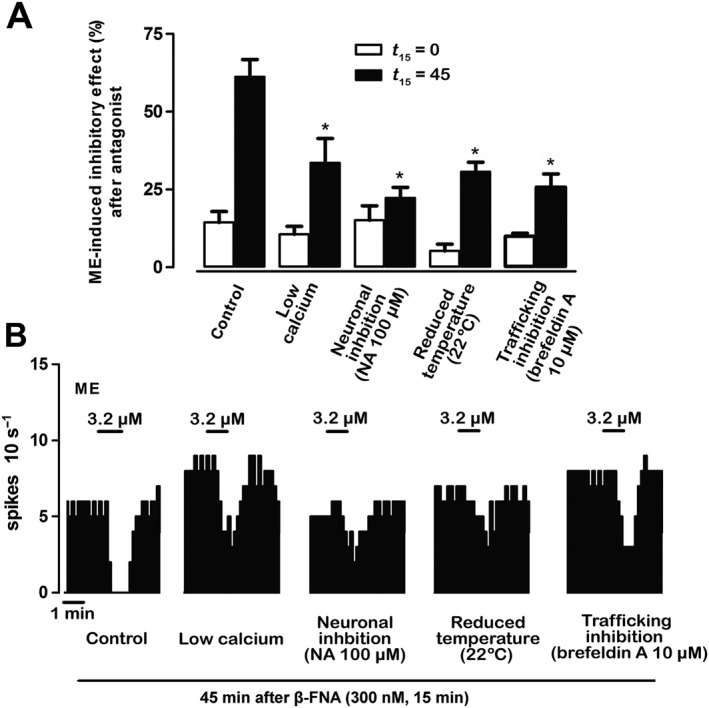
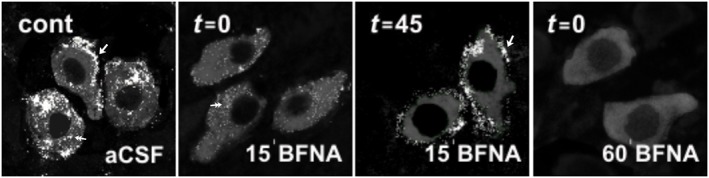
Key results: After near-complete, irreversible μ receptor inactivation with β-funaltrexamine (β-FNA), opioid effect spontaneously recovered in a rapid and efficacious manner. In contrast, α2 -adrenoceptor-mediated effect hardly recovered after receptor inactivation with the irreversible antagonist EEDQ. When the recovery of opioid effect was tested after various inactivating time schedules, we found that the longer the β-FNA pre-exposure, the less efficient and slower the functional μ receptor turnover became. Interestingly, μ receptor turnover was slower when β-FNA challenge was repeated in the same cell, indicating constitutive μ receptor recycling by trafficking from a depletable pool. Double immunocytochemistry confirmed the constitutive nature of μ receptor trafficking from a cytoplasmic compartment. The μ receptor turnover was slowed down when LC neuron calcium- or firing-dependent processes were prevented or vesicular protein trafficking was blocked by a low temperature or transport inhibitor.

Conclusions and implications: Constitutive trafficking of μ receptors from a depletable intracellular pool (endosome) may account for its rapid and efficient functional turnover in the LC. A finely-tuned regulation of μ receptor trafficking and endosomes could explain neuroadaptive plasticity to opioids in the LC.


Figures

Figure 1
Figure 1
Scheme summarizing the experimental design for functional characterization of μ receptor (MOR) turnover. (A) Functional turnover of μ receptor ‐mediated effect was evaluated by analysing the recovery of ME (3.2 μM, 1 min) effect after complete inactivation of μ receptors with the irreversible alkylating blocker β‐FNA (300–800 nM, 30 min); opioid effect recovery was measured before (control effect), immediately after inactivation (t 30 = 0) and, then, every 15 min over a period of 300 min (t 30 = 15–300). (B) For the μ receptor turnover to be compared with that of α2‐adrenoceptors, NA (100 μM, 1 min) effect was tested before (control effect), immediately after complete receptor inactivation with the irreversible antagonist EEDQ (10 μM, 30 min) (t 30 = 0) and, then, every 15 min over 300 min after inactivation (t 30 = 15–300). (C) Functional μ receptor turnover was further characterized by evaluating the recovery of ME (3.2 μM, 1 min) effect for 120 min after complete μ receptor inactivation with 15, 30, 45 or 60 min of β‐FNA administration (t 15, 30, 45, 60 = 0–120). (D) The recovery of ME (3.2 μM, 1 min) effect was also evaluated for 120 min after completion of a second 15 min perfusion with β‐FNA following the recovery of the first pre‐application (t 15(1) = 0–120 and t 15(2) = 0–120). (E) The possible mechanisms underlying μ receptor turnover were explored by perfusion with a low‐calcium (0.2 mM) aCSF (to block LC cell calcium‐dependent mechanisms), administration of the α2‐adrenoceptor agonist NA (100 μM) (to inhibit LC neuron firing‐dependent mechanisms), lowering the temperature of the chamber to 22°C (to evaluate vesicle movement mechanisms) or administration of the protein transport inhibitor brefeldin A (10 μM) (to test vesicle trafficking mechanisms); these manipulations were applied during the period of functional recovery after β‐FNA application, but regular conditions were restored 3–5 min before testing ME effect (45 min).
Figure 2
Figure 2
Effect of the opioid agonist ME before and after administration of the irreversible μ receptor antagonist β‐FNA in LC neurons in vitro. (A) Effect of β‐FNA (300 and 800 nM, 30 min) on the inhibition induced by supramaximal concentrations of ME (3.2, 6.4 and 12.8 μM, 1 min). Bars represent the mean ± SEM of ME effect before and after β‐FNA perfusion expressed as a percentage of the initial FR. Note that the inhibitory effect of all supramaximal ME concentrations is almost completely blocked after application of β‐FNA (300 and 800 nM; n = 5). *P < 0.05 compared with the control effect of ME before β‐FNA administration (Student's paired t‐test). (B) Recovery of ME (3.2 μM, 1 min) and NA (100 μM, 1 min)‐induced inhibitory effect following irreversible inactivation of μ receptors or α2‐adrenoceptors by β‐FNA (300 and 800 nM) and EEDQ (10 μM) respectively. Symbols represent the mean ± SEM of the percentage of ME or NA‐induced inhibitory effect after β‐FNA administration (n = 5 in all experimental groups). The horizontal axis represents the time after the end of β‐FNA (300 and 800 nM) or EEDQ (10 μM) application and the vertical axis the inhibitory effect of ME (3.2 μM, 1 min) or NA (100 μM, 1 min) expressed as a percentage of the initial FR. The lines of the figure represent the theoretical curves constructed from the average of the recovery kinetic parameters that were estimated individually by nonlinear regression (Table 1). Since the recovery of NA‐induced inhibitory effect was small, the kinetic parameters could not be calculated. Note that β‐FNA (300 and 800 nM) administration markedly blocks the inhibitory effect of ME (at t = 0), but the effect recovers to the same degree with both concentrations of the antagonist. The recovery of NA‐induced inhibitory effect (100 μM, 1 min) after perfusion with EEDQ (10 μM) was slower and less efficient.
Figure 3
Figure 3
Recovery of the inhibitory effect of ME (3.2 μM, 1 min) following perfusion with the irreversible μ receptor antagonist β‐FNA (300 nM) for different time periods. (A) Symbols represent the mean ± SEM of the percentage of ME‐induced inhibitory effect after β‐FNA perfusion. The horizontal axis represents the time after the end of antagonist application. The vertical axis indicates the inhibitory effect of ME (3.2 μM, 1 min) expressed as a percentage of the initial FR. The lines represent the theoretical curves constructed from the average of the recovery kinetic parameters that define the functional turnover of μ receptors (Table 2). Note that ME effect after 15 min of β‐FNA perfusion (n = 6) at t = 120 min is higher than that obtained after 30 min (n = 8), 45 min (n = 5) or 60 min (n = 5) of β‐FNA administration at t = 120 min. (B, C) Representative examples of FR recordings of LC neurons showing the recovery of ME‐induced inhibitory effect (3.2 μM, 1 min) after complete inactivation of μ receptors with β‐FNA (300 nM, 15 min) (B) and β‐FNA (300 nM, 60 min) (C). Vertical lines represent the number of spikes recorded every 10 s and the horizontal bars the period of drug application. Note that the inhibitory effect of ME is almost blocked 15 min after β‐FNA administration in both recordings in comparison with the control inhibitory effect. The inhibitory effect of ME completely recovers in the neuron receiving β‐FNA (300 nM, 15 min) but not in the neuron perfused with β‐FNA (300 nM, 60 min).
Figure 4
Figure 4
Recovery of the inhibitory effect of ME (3.2 μM, 1 min) following two successive administrations of β‐FNA (300 nM, 15 min). (A) Symbols represent the mean ± SEM of the percentage of ME‐induced inhibitory effect. The horizontal axis represents the time after the end of β‐FNA (300 nM, 15 min) application, whereas the vertical axis indicates the inhibitory effect of ME (3.2 μM, 1 min) expressed as a percentage of its initial FR. The lines of the figure represent the theoretical curve constructed from the average of the recovery kinetic parameters that define the functional turnover of μ receptors. Note that the recovery of the inhibitory effects of ME after the first β‐FNA application is significantly higher than that of the inhibitory effects of ME achieved after the second antagonist perfusion (n = 5; *P < 0.05; Student's paired t‐test). (B) Representative example of FR recording of LC neuron showing the recovery of the inhibitory effect of ME (3.2 μM, 1 min) after two successive administrations of β‐FNA (300 nM, 15 min). Vertical lines represent the number of spikes recorded every 10 s and the horizontal bars the period of drug application. Note that the inhibitory effect of ME is almost blocked 15 min after both β‐FNA administrations. The inhibitory effect of ME completely recovers to the control effect within 120 min after the first β‐FNA administration but not after the second β‐FNA application.
Figure 5
Figure 5
Intracellular mechanisms of the functional turnover of μ receptors. (A) Bar histograms show the mean ± SEM of the percentage of ME‐induced effect immediately (t 15 = 0) and 45 min after 15 min (t 15 = 45) of β‐FNA (300 nM, 15 min) perfusion in different experimental conditions: control (n = 6), in the presence of low‐calcium aCSF (n = 6), during neuronal inhibition by NA (100 μM) (n = 6), at low temperature (n = 5) or during trafficking inhibition by brefeldin A (10 μM) (n = 5). *P < 0.05, compared with the corresponding control by a one‐way ANOVA followed by Bonferroni's post hoc test. (B) Representative examples of FR recordings of five LC neurons showing the recovery of ME (3.2 μM, 1 min)‐induced inhibitory effect 45 min after β‐FNA (300 nM, 15 min) application in different experimental conditions. Vertical lines represent the number of spikes recorded every 10 s and the horizontal bars the period of drug application. Note that the inhibitory effect of ME recovers 45 min after β‐FNA administration only in the control group.
Figure 6
Figure 6
Confocal laser scanning microscopy imaging of μ receptor‐immunoreactivity (ir) in the LC before and after β‐FNA perfusion. In the absence of β‐FNA (control condition, cont), μ receptor‐ir (white) is identified as patches distributed both in the cytoplasm (double arrow) and in association with the plasma membrane (single arrow) in TH‐containing neurons (grey). Immediately after treatment with ß‐FNA (300 nM, 15 min, t 15 = 0), μ receptor‐ir is markedly depleted from the neuronal membrane, but μ receptor‐immunoreactive puncta are still observed within the cytoplasm (double arrow). Forty five min later (t 15 = 45), the μ receptor is present again in the cell membrane (single arrow). Immediately after ß‐FNA (300 nM, 60 min, t 60 = 0) application, μ receptor‐ir is not detected in the cell membrane or the cytoplasmic compartment. All images displayed were acquired with identical laser intensity and detector gain parameters.

References

    1. Adler CH, Meller E, Goldstein M (1985). Recovery of alpha 2‐adrenoceptor binding and function after irreversible inactivation by N‐ethoxycarbonyl‐2‐ethoxy‐1, 2‐dihydroquinoline (EEDQ). Eur J Pharmacol 116: 175–178. - PubMed
    1. Aghajanian GK, Wang YY (1987). Common alpha 2‐ and opiate effector mechanisms in the locus coeruleus: intracellular studies in brain slices. Neuropharmacology 26: 793–799. - PubMed
    1. Alexander SPH, Davenport AP, Kelly E, Marrion N, Peters JA, Benson HE et al. (2015a). The Concise Guide to PHARMACOLOGY 2015/16: G protein‐coupled receptors. Br J Pharmacol 172: 5744–5869. - PMC - PubMed
    1. Alexander SPH, Fabbro D, Kelly E, Marrion N, Peters JA, Benson HE et al. (2015b). The Concise Guide to PHARMACOLOGY 2015/16: Enzymes. Br J Pharmacol 172: 6024–6109. - PMC - PubMed
    1. Andrade R, Aghajanian GK (1984). Locus coeruleus activity in vitro: intrinsic regulation by a calcium‐dependent potassium conductance but not alpha 2‐adrenoceptors. J Neurosci 4: 161–170. - PMC - PubMed

MeSH terms