

Simultaneous Quantification of Bone Edema/Adiposity and Structure in Inflamed Bone Using Chemical Shift-Encoded MRI in Spondyloarthritis
- PMID: 28589660
- PMCID: PMC5811922
- DOI: 10.1002/mrm.26729
Simultaneous Quantification of Bone Edema/Adiposity and Structure in Inflamed Bone Using Chemical Shift-Encoded MRI in Spondyloarthritis
Abstract
Purpose: To evaluate proton density fat fraction (PDFF) and R2* as markers of bone marrow composition and structure in inflamed bone in patients with spondyloarthritis.
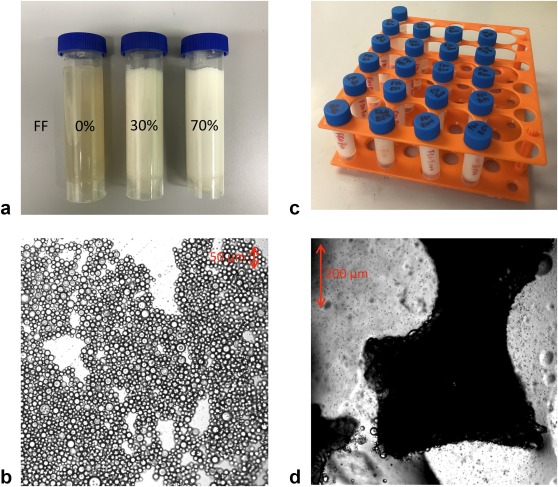
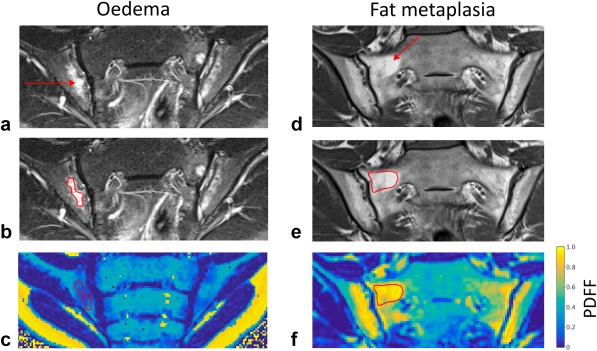
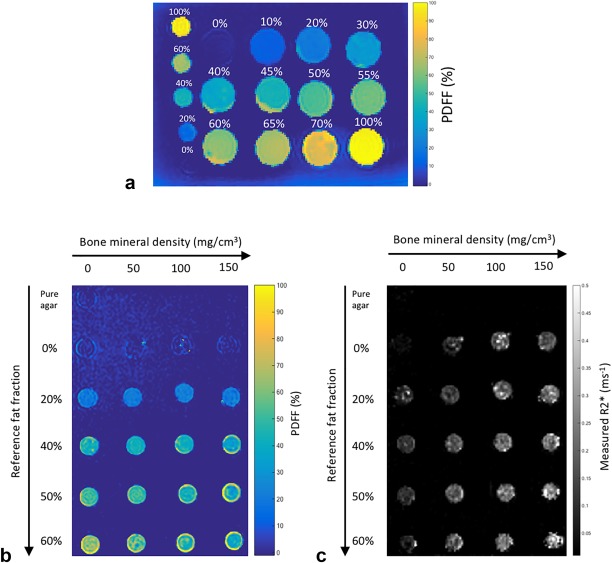
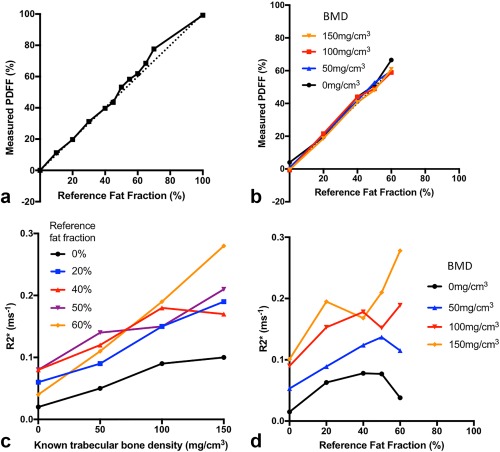
Methods: Phantoms containing fat, water, and trabecular bone were constructed with proton density fat fraction (PDFF) and bone mineral density (BMD) values matching those expected in healthy bone marrow and disease states, and scanned using chemical shift-encoded MRI (CSE-MRI) at 3T. Measured PDFF and R2* values in phantoms were compared with reference FF and BMD values. Eight spondyloarthritis patients and 10 controls underwent CSE-MRI of the sacroiliac joints. PDFF and R2* in areas of inflamed bone and fat metaplasia in patients were compared with normal bone marrow in controls.
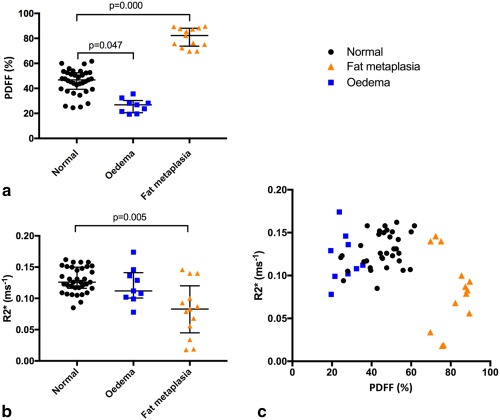
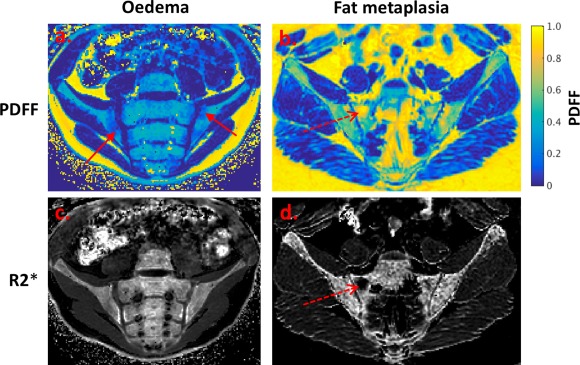
Results: In phantoms, PDFF measurements were accurate over the full range of PDFF and BMD values. R2* measurements were positively associated with BMD but also were influenced by variations in PDFF. In patients, PDFF was reduced in areas of inflammation and increased in fat metaplasia compared to normal marrow. R2* measurements were significantly reduced in areas of fat metaplasia.
Conclusion: PDFF measurements reflect changes in marrow composition in areas of active inflammation and structural damage and could be used for disease monitoring in spondyloarthritis. R2* measurements may provide additional information bone mineral density but also are influenced by fat content. Magn Reson Med 79:1031-1042, 2018. © 2017 The Authors Magnetic Resonance in Medicine published by Wiley Periodicals, Inc. on behalf of International Society for Magnetic Resonance in Medicine. This is an open access article under the terms of the Creative Commons Attribution License, which permits use, distribution and reproduction in any medium, provided the original work is properly cited.
Keywords: bone marrow; chemical shift-encoded MRI; inflammation; spondyloarthritis.
© 2017 The Authors Magnetic Resonance in Medicine published by Wiley Periodicals, Inc. on behalf of International Society for Magnetic Resonance in Medicine.
Figures
Similar articles
-
Association of bone mineral density and fat fraction with magnetic susceptibility in inflamed trabecular bone.Magn Reson Med. 2019 May;81(5):3094-3107. doi: 10.1002/mrm.27634. Epub 2019 Jan 7. Magn Reson Med. 2019. PMID: 30615213 Free PMC article.
-
Histographic analysis of oedema and fat in inflamed bone marrow based on quantitative MRI.Eur Radiol. 2020 Sep;30(9):5099-5109. doi: 10.1007/s00330-020-06785-x. Epub 2020 Apr 14. Eur Radiol. 2020. PMID: 32291499 Free PMC article.
-
Quantification of Fat Metaplasia in the Sacroiliac Joints of Patients With Axial Spondyloarthritis by Chemical Shift-Encoded MRI: A Diagnostic Trial.Front Immunol. 2022 Jan 18;12:811672. doi: 10.3389/fimmu.2021.811672. eCollection 2021. Front Immunol. 2022. PMID: 35116037 Free PMC article.
-
Chemical Shift-Encoded MRI of the Lumbar Vertebral Bone Marrow for Detecting Osteoporosis With Low Trabecular Bone Quality in Patients With Breast Cancer Receiving Aromatase Inhibitors.J Magn Reson Imaging. 2024 Oct;60(4):1379-1389. doi: 10.1002/jmri.29219. Epub 2024 Jan 4. J Magn Reson Imaging. 2024. PMID: 38174771
-
Quantitative MRI and spectroscopy of bone marrow.J Magn Reson Imaging. 2018 Feb;47(2):332-353. doi: 10.1002/jmri.25769. Epub 2017 Jun 1. J Magn Reson Imaging. 2018. PMID: 28570033 Free PMC article. Review.
Cited by
-
Chemical Shift-Encoded MRI of Bone Metabolic Markers in Ankylosing Spondylitis.Dis Markers. 2022 Oct 13;2022:1846667. doi: 10.1155/2022/1846667. eCollection 2022. Dis Markers. 2022. PMID: 36277974 Free PMC article.
-
Fat fraction mapping using magnetic resonance imaging: insight into pathophysiology.Br J Radiol. 2018 Sep;91(1089):20170344. doi: 10.1259/bjr.20170344. Epub 2017 Nov 21. Br J Radiol. 2018. PMID: 28936896 Free PMC article.
-
Proton density fat fraction: magnetic resonance imaging applications beyond the liver.Diagn Interv Radiol. 2022 Jan;28(1):83-91. doi: 10.5152/dir.2021.21845. Diagn Interv Radiol. 2022. PMID: 35142615 Free PMC article. Review.
-
Association of bone mineral density and fat fraction with magnetic susceptibility in inflamed trabecular bone.Magn Reson Med. 2019 May;81(5):3094-3107. doi: 10.1002/mrm.27634. Epub 2019 Jan 7. Magn Reson Med. 2019. PMID: 30615213 Free PMC article.
-
Proton Density Fat Fraction Spine MRI for Differentiation of Erosive Vertebral Endplate Degeneration and Infectious Spondylitis.Diagnostics (Basel). 2021 Dec 30;12(1):78. doi: 10.3390/diagnostics12010078. Diagnostics (Basel). 2021. PMID: 35054245 Free PMC article.
References
-
- Braun J, Sieper J. Ankylosing spondylitis. Lancet 2007;369:1379–1390. - PubMed
-
- Wanders A, Landewé R, Dougados M, Mielants H, van der Linden S, van der Heijde D. Association between radiographic damage of the spine and spinal mobility for individual patients with ankylosing spondylitis: can assessment of spinal mobility be a proxy for radiographic evaluation? Ann Rheum Dis 2005;64:988–994. - PMC - PubMed
-
- Dougados M, Baeten D. Spondyloarthritis. Lancet 2011;377:2127–2137. - PubMed
-
- Neidhart M, Baraliakos X, Seemayer C, et al. Expression of cathepsin K and matrix metalloproteinase 1 indicate persistent osteodestructive activity in long‐standing ankylosing spondylitis. Ann Rheum Dis 2009;68:1334–1339. - PubMed
-
- Karberg K, Zochling J, Sieper J, Felsenberg D, Braun J. Bone loss is detected more frequently in patients with ankylosing spondylitis with syndesmophytes. J Rheumatol 2005;32:1290–1298. - PubMed
Publication types
MeSH terms
Grants and funding
LinkOut - more resources
Full Text Sources
Other Literature Sources
Medical
