. 2017 Jun 7:8:15472.
doi: 10.1038/ncomms15472.

Mycelium-mediated transfer of water and nutrients stimulates bacterial activity in dry and oligotrophic environments

Affiliations

Mycelium-mediated transfer of water and nutrients stimulates bacterial activity in dry and oligotrophic environments

Anja Worrich et al. Nat Commun. .

Abstract

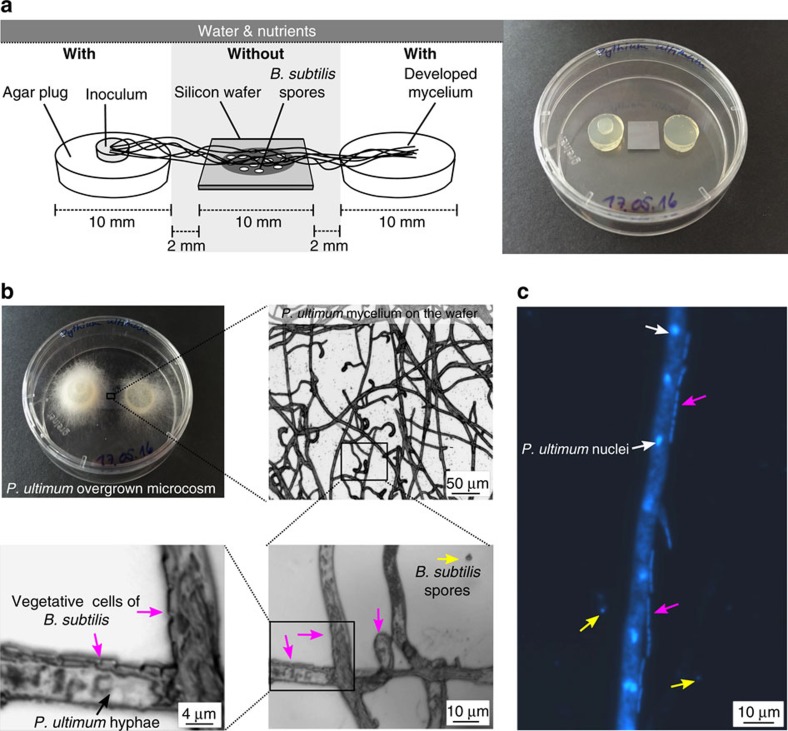
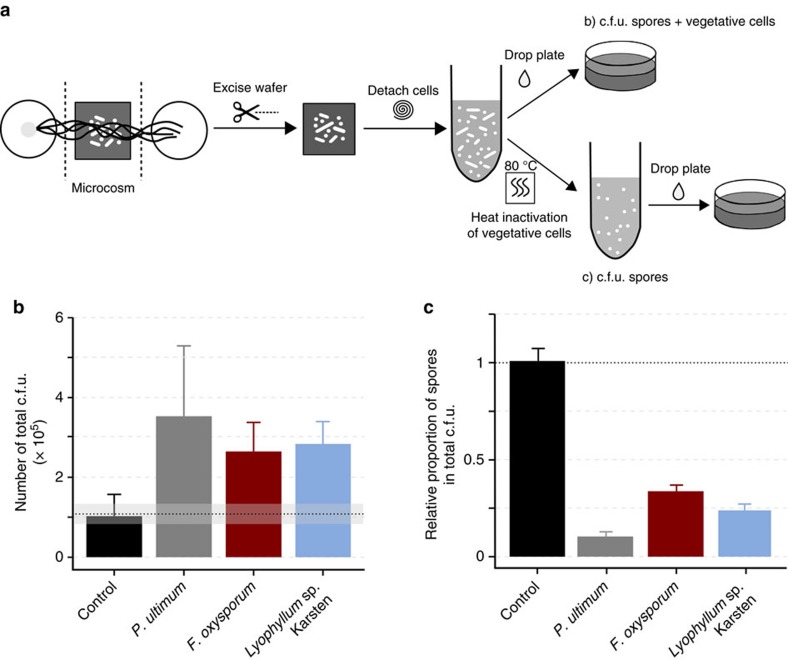
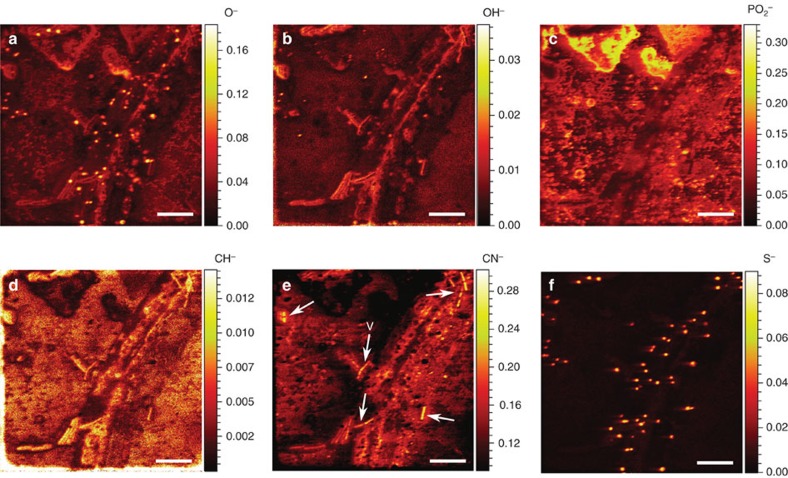
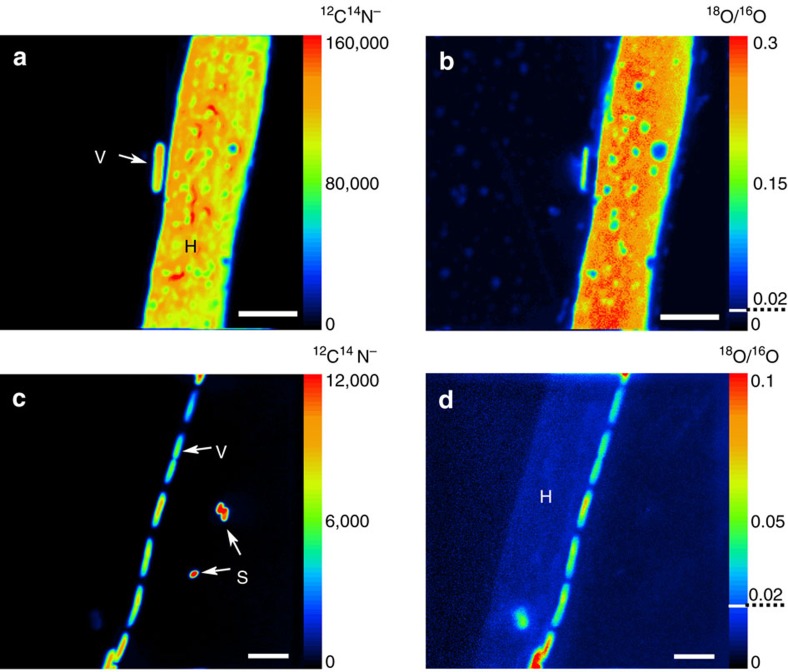
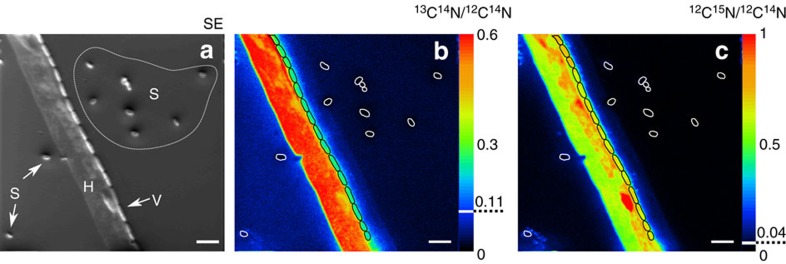
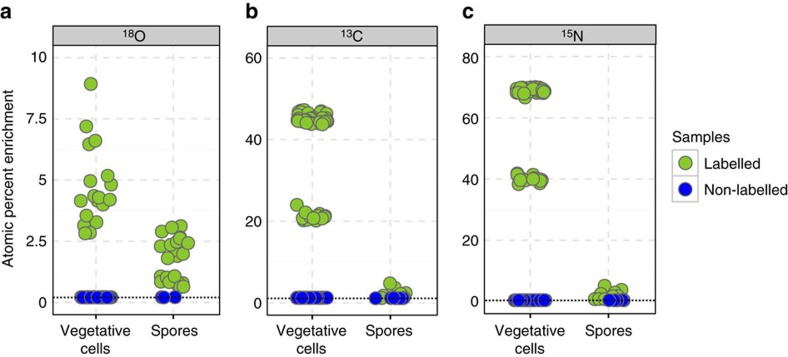
Fungal-bacterial interactions are highly diverse and contribute to many ecosystem processes. Their emergence under common environmental stress scenarios however, remains elusive. Here we use a synthetic microbial ecosystem based on the germination of Bacillus subtilis spores to examine whether fungal and fungal-like (oomycete) mycelia reduce bacterial water and nutrient stress in an otherwise dry and nutrient-poor microhabitat. We find that the presence of mycelia enables the germination and subsequent growth of bacterial spores near the hyphae. Using a combination of time of flight- and nanoscale secondary ion mass spectrometry (ToF- and nanoSIMS) coupled with stable isotope labelling, we link spore germination to hyphal transfer of water, carbon and nitrogen. Our study provides direct experimental evidence for the stimulation of bacterial activity by mycelial supply of scarce resources in dry and nutrient-free environments. We propose that mycelia may stimulate bacterial activity and thus contribute to sustaining ecosystem functioning in stressed habitats.


Conflict of interest statement

The authors declare no competing financial interests.

Figures

Figure 1
Figure 1. Synthetic microbial ecosystem reveals spore germination in presence of mycelia in dry and oligotrophic environments.
(a) Scheme and photographs of the setup employed to carry out the germination, growth and labelling experiments. The synthetic ecosystem is comprised of two agar plugs serving as water and nutrient sources (‘with') for the fungi or the oomycete inoculated on top of one of the agar plugs. A silicon wafer free of water and nutrients (‘without') placed in the middle between the two ‘with' zones served as carrier for spores of B. subtilis. An air gap between the ‘with' and ‘without' zone prevented the diffusion of water or substrates to the spore region. (b) Gradual enlargement of bright-field micrographs of the silicon wafer overgrown by mycelium of P. ultimum. In close vicinity to the hyphae (black arrow) rod-shaped, vegetative bacterial cells (magenta arrows) were found, whereas smaller, round-shaped spores (yellow arrows) were located more distantly. (c) Fluorescence micrograph of the 4′,6-diamidine-2-phenylindol (DAPI)-stained wafer showing P. ultimum hyphae containing nuclei (white arrows) and vegetative cells as well as spores of B. subtilis.
Figure 2
Figure 2. The presence of mycelium enables bacterial growth and spore germination.
(a) Scheme of the experimental procedure providing information about vegetative growth and germination in presence of mycelium. Total cell number was determined as c.f.u. after cell detachment from the wafer and plating on agar. Spores were obtained by counting c.f.u. after heat-inactivation of the vegetative cells. (b) c.f.u. of B. subtilis after detachment from the control wafer (no contact to mycelium) and wafers overgrown by P. ultimum, F. oxysporum or Lyophyllum sp. Karsten. The dashed line shows the number of c.f.u. applied to the wafer with the inoculum. In presence of mycelium, the number of total c.f.u. increased compared with the control. Bars show the average number of c.f.u. and error bars indicate the s.d. (c) Respective proportions of B. subtilis spores, calculated by dividing the number of spore c.f.u. by the total cell c.f.u. determined in b. The bars show the mean of the quotients for the three replicates and the s.d. The number of spores was different from the number of total cells for the respective strain but did not differ for the control.
Figure 3
Figure 3. ToF–SIMS reveals sample composition via yield of secondary ion species.
Mass-resolved chemical map of P. ultimum hyphae as well as vegetative cells and spores of B. subtilis on top of the silicon wafer. Six negative secondary ion species were detected (af) in a 56 × 56 μm sample area. ToF–SIMS images produced were normalized by the total ion counts. The colour scale indicates the relative ion counts for each secondary ion species with warmer colours representing higher relative ion counts and cooler colours representing lower relative ion counts. Arrows in e point to vegetative cells (V). Scale bars, 10 μm.
Figure 4
Figure 4. Water is transferred from hyphae to bacterial cells in dependence of the spatial organization.
NanoSIMS images of P. ultimum hyphae (H), B. subtilis spores (S) and vegetative cells (V) identified in the total biomass (12C14N) images (a,c) of 18O-enriched samples. The ratio images of 18O/16O show the incorporation of label from water from the nutrient-rich zones into the biomass of P. ultimum and B. subtilis (b,d). The colour scale indicates the intensities of 12C14N (a,c) and enrichment in 18O (b,d) with warmer colours representing higher secondary ion counts (a,c) or enrichment (b,d) levels and cooler colours representing lower values. Dashed lines indicate natural abundance of 18O. Images represent different fields of analysis corresponding to sample areas of 20 × 20 (a,b) and 30 × 30 μm (c,d). Scale bars, 4 μm.
Figure 5
Figure 5. Bacterial cells in close proximity to the hyphae receive carbon and nitrogen.
NanoSIMS images of P. ultimum hyphae (H), B. subtilis spores (S) and vegetative cells (V) identified in the secondary electron (SE) image (a) of 13C and 15N -enriched samples. The ratio images of 13C14N/12C14N (b) and 12C15N/12C14N (c) show the incorporation of label into the biomass of P. ultimum and B. subtilis. The colour scale indicates the relative enrichment in 13C and 15N (b,c) with warmer colours representing higher enrichment levels and cooler colours indicating lower values. The higher background signal for 13C on the left side of the hyphae (b) results from the topography-dependent re-deposition of sputtered sample material. Dashed lines indicate natural abundances of 13C and 15N. Vegetative cells and spores are framed in black and white, respectively. Images represent a field of analysis corresponding to a sample area of 40 × 40 μm. Scale bars, 4 μm.
Figure 6
Figure 6. Vegetative cells are higher enriched in 13C, 15N and 18O compared with spores of B. subtilis.
Atom percent enrichment (APE) for (a) 18O, (b) 13C and (c) 15N by single cells and spores of B. subtilis measured with nanoSIMS in labelled (green) and non-labelled (blue) samples. Data are derived from different fields of analysis and from replicate wafers (for details see Supplementary Table 1). Dashed lines represent literature values for the stable isotope natural abundance.

References

    1. Wargo M. J. & Hogan D. A. Fungal—bacterial interactions: a mixed bag of mingling microbes. Curr. Opin. Microbiol. 9, 359–364 (2006). - PubMed
    1. Pion M. et al.. Bacterial farming by the fungus Morchella crassipes. Proc. Biol. Sci. 280, 20132242 (2013). - PMC - PubMed
    1. Boer W. d., Folman L. B., Summerbell R. C. & Boddy L. Living in a fungal world: impact of fungi on soil bacterial niche development. FEMS Microbiol. Rev. 29, 795–811 (2005). - PubMed
    1. Pande S. et al.. Metabolic cross-feeding via intercellular nanotubes among bacteria. Nat. Commun. 6, 6238 (2015). - PubMed
    1. Lennon J. T. & Jones S. E. Microbial seed banks: the ecological and evolutionary implications of dormancy. Nat. Rev. Microbiol. 9, 119–130 (2011). - PubMed

Publication types