. 2017 Jun 7:8:15611.
doi: 10.1038/ncomms15611.

River plastic emissions to the world's oceans

Affiliations

River plastic emissions to the world's oceans

Laurent C M Lebreton et al. Nat Commun. .

Abstract

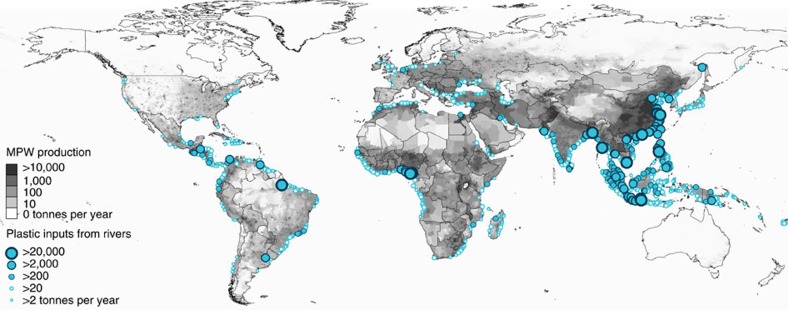
Plastics in the marine environment have become a major concern because of their persistence at sea, and adverse consequences to marine life and potentially human health. Implementing mitigation strategies requires an understanding and quantification of marine plastic sources, taking spatial and temporal variability into account. Here we present a global model of plastic inputs from rivers into oceans based on waste management, population density and hydrological information. Our model is calibrated against measurements available in the literature. We estimate that between 1.15 and 2.41 million tonnes of plastic waste currently enters the ocean every year from rivers, with over 74% of emissions occurring between May and October. The top 20 polluting rivers, mostly located in Asia, account for 67% of the global total. The findings of this study provide baseline data for ocean plastic mass balance exercises, and assist in prioritizing future plastic debris monitoring and mitigation strategies.


Conflict of interest statement

The authors declare no competing financial interests.

Figures

Figure 1
Figure 1. Mass of river plastic flowing into oceans in tonnes per year.
River contributions are derived from individual watershed characteristics such as population density (in inhab km−2), mismanaged plastic waste (MPW) production per country (in kg inhab−1 d−1) and monthly averaged runoff (in mm d−1). The model is calibrated against river plastic concentration measurements from Europe, Asia, North and South America.
Figure 2
Figure 2. Comparison between river input model and measurements.
Circles indicate midpoint estimates of daily inputs of plastics from river to oceans in kg d−1. Whiskers extend from lower to upper estimates based on a range of average particle mass and ratio between numerical concentrations of macro-plastics and micro-plastics. The regression analysis was carried out with 30 records from 13 rivers reported in seven studies. The locations of the 13 rivers are provided in the map.
Figure 3
Figure 3. Seasonality of regional inputs of river plastic to oceans.
(a) River outflow locations are indicated by trimestral period when respective peak input occurs. Peak seasons for precipitation rates from GLDAS are mapped on the continental landmass, showing a clear correlation with our predicted inputs. (b) Relative seasonality of plastic inputs from rivers into the ocean by continents. Continental contributions are expressed in percentage of respective annual mass inputs.
Figure 4
Figure 4. Model framework.
Plastic mass production per river catchment (Mmpw; n=40,760 rivers) is computed from data on MPW production rates per country, population density, topographic elevation and location of artificial barriers. Seasonality of inputs is derived from monthly averaged runoff (R). A parametric equation with parameters k and a is used to fit model predictions (Mout) against results from observational studies. For our mid-point estimate, best fit was found for k=1.85 10−3 and a=1.52 (r2=0.93, n=30).
Figure 5
Figure 5. Modelled data flow illustration for Western Java, Indonesia.
(a) Estimated MPW production rates in t yr−1. (b) Accumulated MPW production in rivers and location of artificial barriers. (c) Predicted plastic mass input into the ocean at river mouths in t d−1.

References

    1. Plastics Europe. Plastics–the facts 2016: an analysis of European plastics production, demand and waste data. http://www.plasticseurope.org (2016).
    1. Barnes K. A., Galgani F., Thompson R. C. & Barlaz M. Accumulation and fragmentation of plastic debris in global environments. Philos. Trans. R. Soc. B 364, 1985–1998 (2009). - PMC - PubMed
    1. Derraik J. G. The pollution of the marine environment by plastic debris: a review. Mar. Pollut. Bull. 44, 842–852 (2002). - PubMed
    1. GESAMP. Sources, fate and effects of microplastics in the marine environment: part two of a global assessment (eds Kershaw, P. J. & Rochman, C. M.). (IMO/FAO/UNESCO-IOC/UNIDO/WMO/IAEA/UN/UNEP/UNDP Joint Group of Experts on the Scientific Aspects of Marine Environmental Protection). Rep. Stud. GESAMP 93, 220 (2016).
    1. Jambeck J. R. et al. Plastic waste inputs from land into the ocean. Science 347, 768–771 (2015). - PubMed