

doi: 10.1039/c7an00471k.
Monitoring focal adhesion kinase phosphorylation dynamics in live cells
Affiliations
- PMID: 28589989
- PMCID: PMC5531600
- DOI: 10.1039/c7an00471k
Item in Clipboard
Monitoring focal adhesion kinase phosphorylation dynamics in live cells
Analyst.
.
Abstract
Focal adhesion kinase (FAK) is a cytoplasmic non-receptor tyrosine kinase essential for a diverse set of cellular functions. Current methods for monitoring FAK activity in response to an extracellular stimulus lack spatiotemporal resolution and/or the ability to perform multiplex detection. Here we report on a novel approach to monitor the real-time kinase phosphorylation activity of FAK in live single cells by fluorescence lifetime imaging.
Conflict of interest statement
The authors declare no competing financial interest.
Figures

Schematic for FAK phosphorylation monitoring in live cells with a peptide biosensor by FLIM
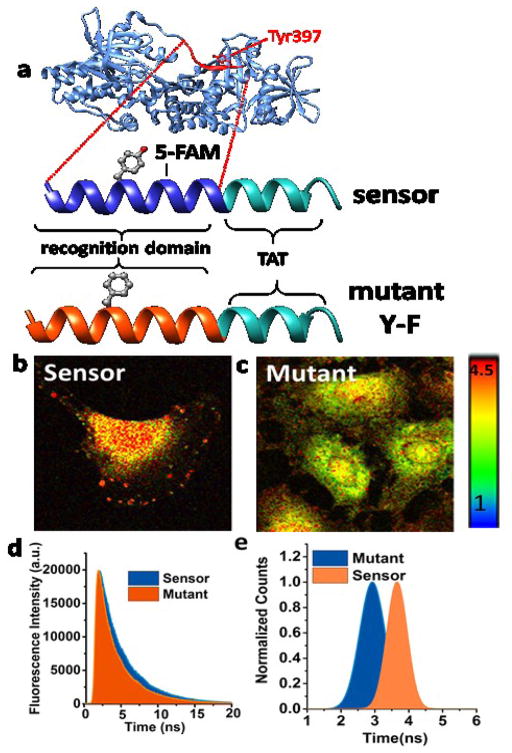
Sensor design and evaluation. (a) Schematic depicts FAK FERM (Four-point- one-Ezrin-Radixin-Moesin)-Kinase domain (blue) including the Tyr-397 auto-phosphorylation site (red). Our putative peptide sensor was designed by including Tyr-397 and its adjacent amino acids as the sensor recognition sequence (dark blue) conjugated with a TAT sequence, which enables live cell imaging and monitoring of phosphorylation. Fluorophore reporter, 5-FAM (Ex/Em, 492/518), was placed +2 amino acids from the Tyr-397 site. Mutant sensor was designed by replacing the tyrosine site with a phenylalanine (Y-F) (orange). (b) When FAKSOR is phosphorylated it exhibits a longer fluorescence decay (red) than the control mutant FAKSOR (orange) (c). Fluorescence lifetime images (d, e) of FAKSOR in 2D-cultured ECFC after treatment with Angiotensin II (1 μM, 30 min) (d) demonstrates a higher average fluorescence lifetime (3.82 ns) compared to (e) non-phopshorylatable FAKSOR mutant (2.91 ns).
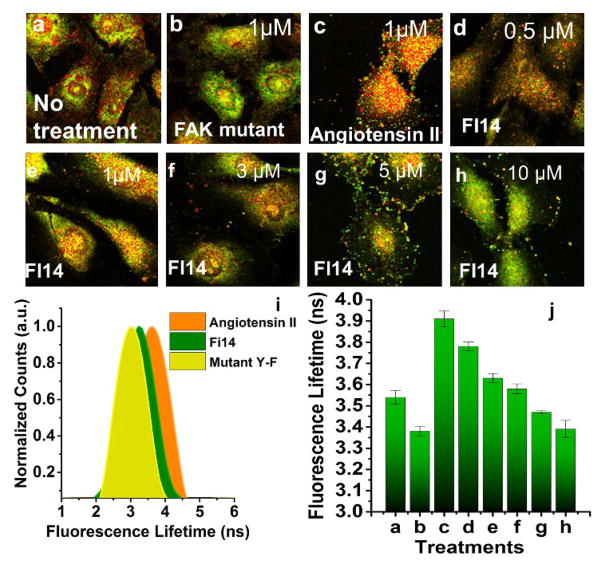
FAKSOR fluorescence lifetime depends on FAK phosphorylation. (a–h) Fluorescence lifetime images for different treatments; For FAKSOR positive controls, Angiotensin II (1 μM) was added to the medium (c) resulting in a higher average fluorescence lifetime (3.91 ns) compared to control (a,3.54 ns) as well as the negative control mutant FAKSOR (b, 3.38 ns). (d–h) Treatment with FI-14 (90 minutes), a Tyr397 inhibitor, decreased the average fluorescence lifetime of FAKSOR in a dose-dependent manner (d) 0.5 μM (3.78 ns), (e) 1 μM (3.63 ns), (f) 3 μM (3.58 ns), (g) 5 μM (3.47 ns), (h) 10 μM (3.39 ns) (I,j) Quantitative analysis; (i) Fluorophore lifetime per cell calculated based on the average from at least 50 cells in 3 replicates and, for each condition, and plotted as a distribution of observed lifetimes, (j) Quantitative analysis shows average fluorescence lifetime for different treatments (n=50).
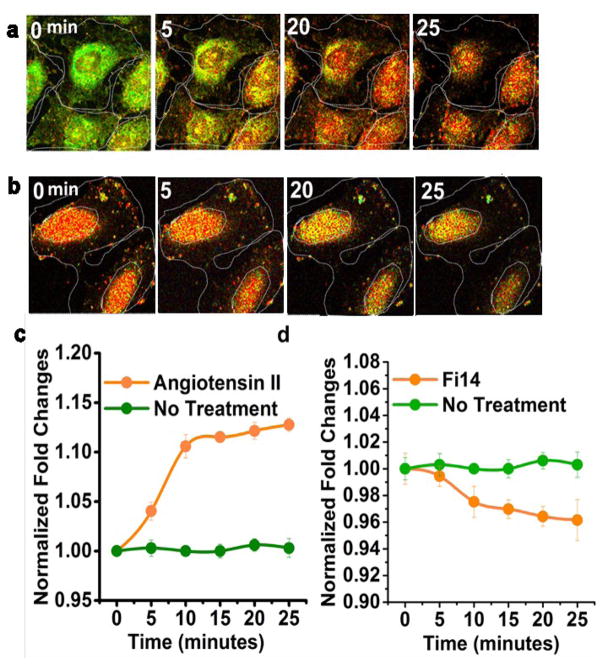
Real Time Fluorescence Lifetime Imaging of FAKSOR activity. (a), (b) Real time measurement of FAKSOR fluorescence lifetime in ECFC shows an increase (a) and decrease (b) of average florescence lifetime in (a) Angiotensin II- and (b) FI14-treated cells over a 25-minute observation. (c) quantitative analysis reveals that treating ECFC with Angiotensin II (1μM) (orange line and dot) increases average fluorescence lifetime (3.92 ns from 3.10 ns) over 25 minutes, while controls do not show a change in average lifetime (green line and dot). (d) When ECFC are treated with FI14, FAKSOR average lifetime decreases over 25 minutes (orange line and dot), while controls, again, did not experience a change in average fluorescence lifetime (green line with dot). Our observation is representative of three technical and three independent biological replicates.
References
-
- Kritikou E. Nature reviews. Molecular cell biology. 2009;10:3–3.
-
- Farge E. Current topics in developmental biology. 2011;95:243–265. - PubMed
MeSH terms
Substances
Grants and funding
LinkOut - more resources
Full Text Sources
Other Literature Sources
Miscellaneous