. 2017 Jun 6:6:e24133.
doi: 10.7554/eLife.24133.

Repeated losses of PRDM9-directed recombination despite the conservation of PRDM9 across vertebrates

Affiliations

Repeated losses of PRDM9-directed recombination despite the conservation of PRDM9 across vertebrates

Zachary Baker et al. Elife. .

Abstract

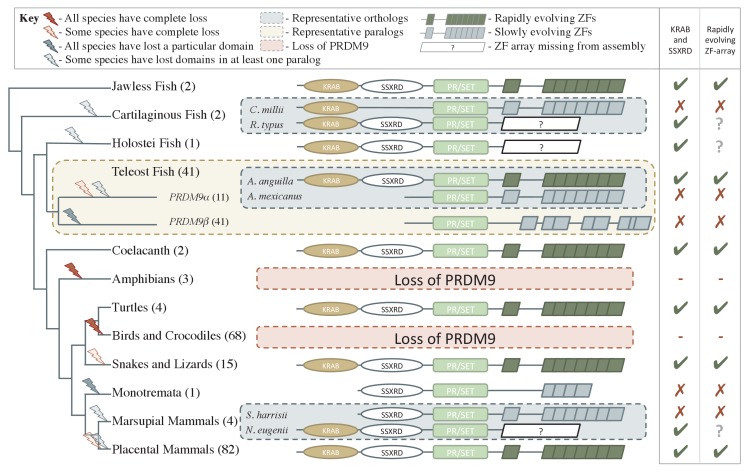
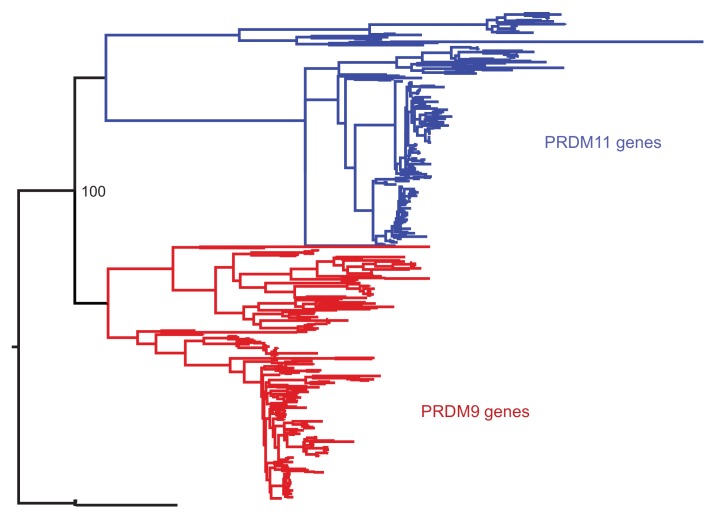
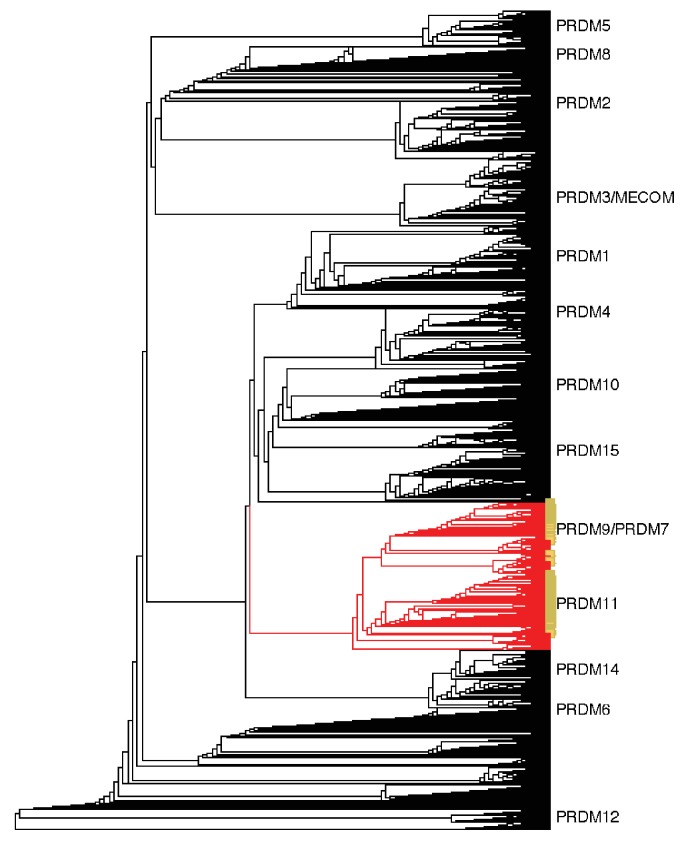
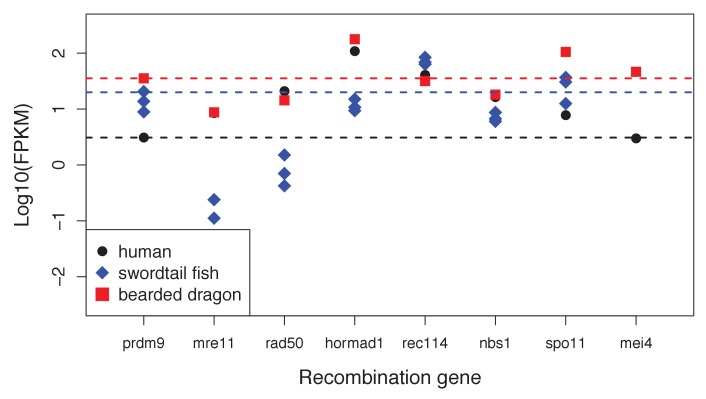
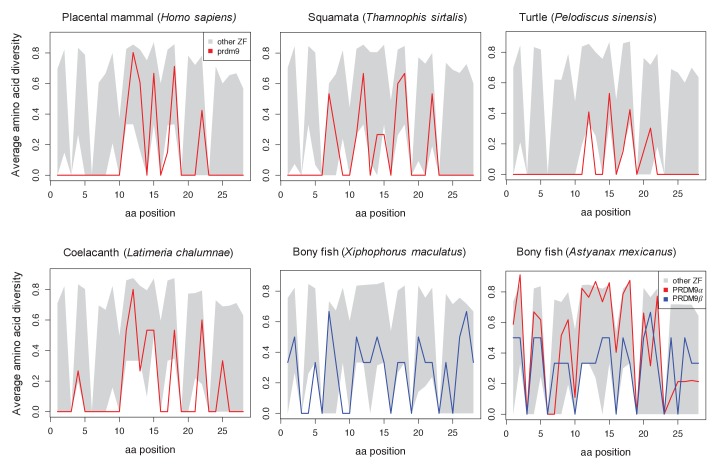
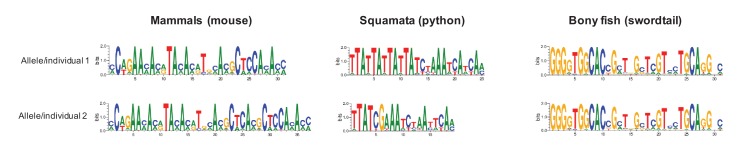
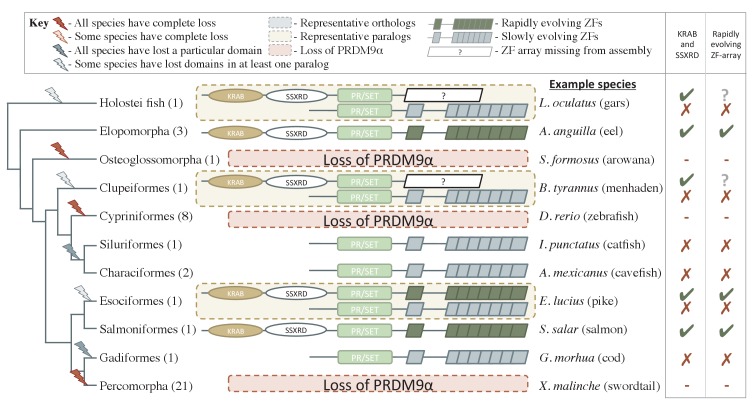
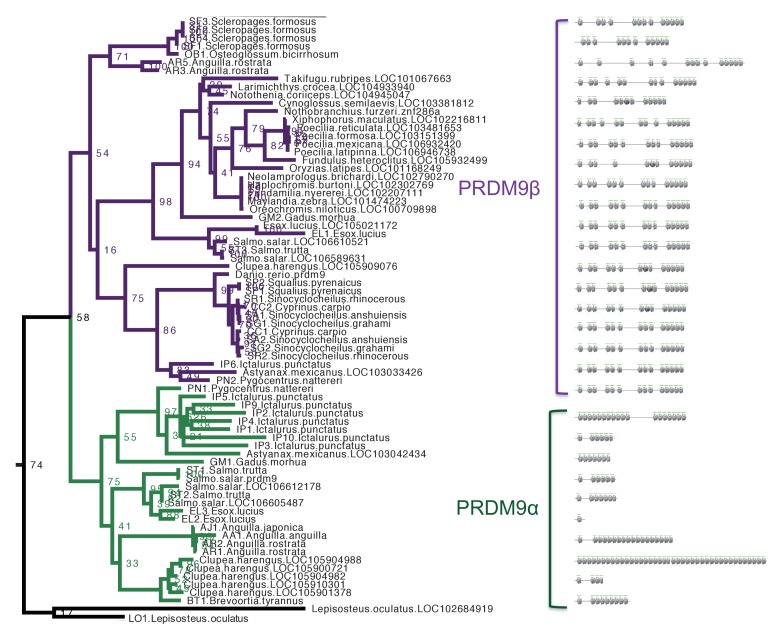
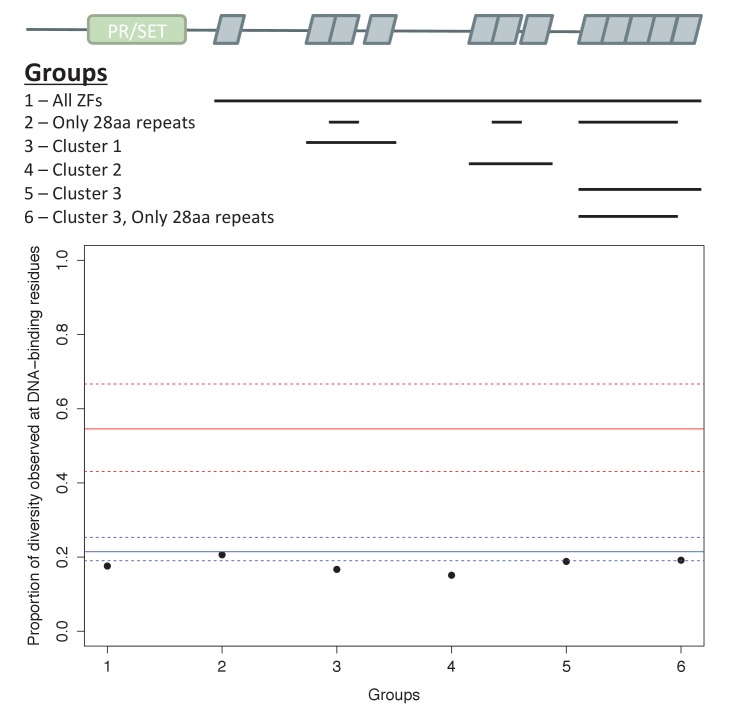
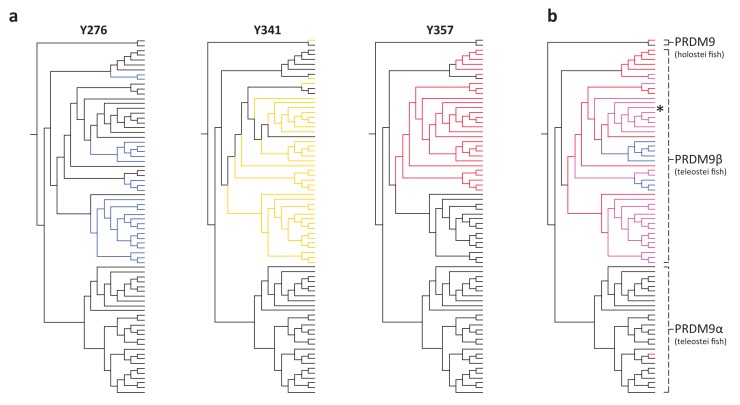
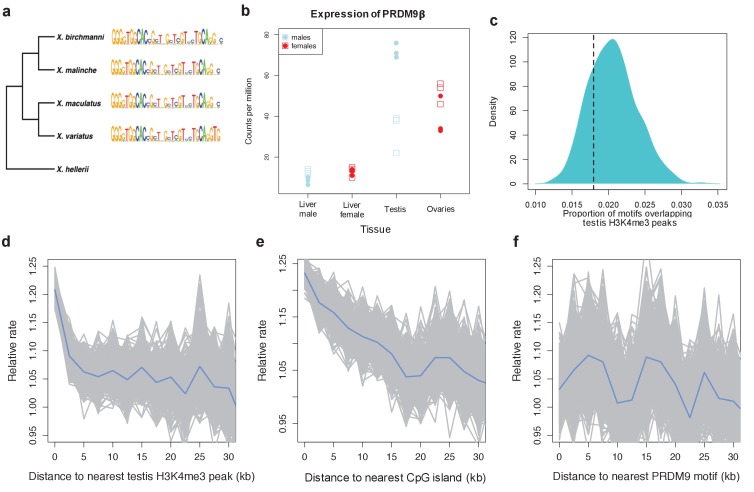
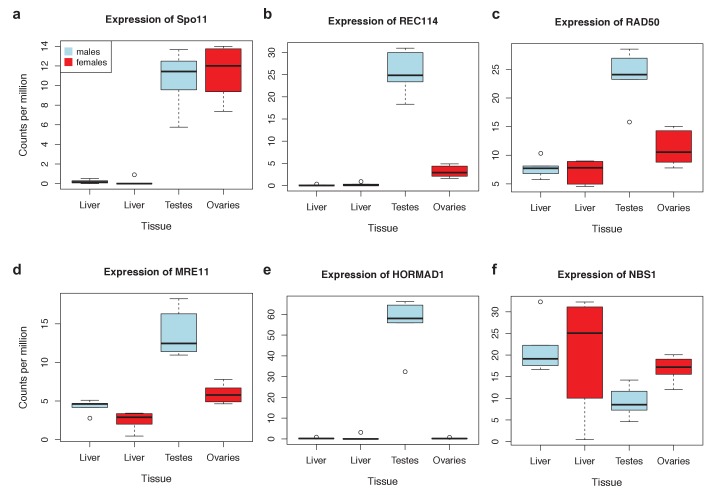
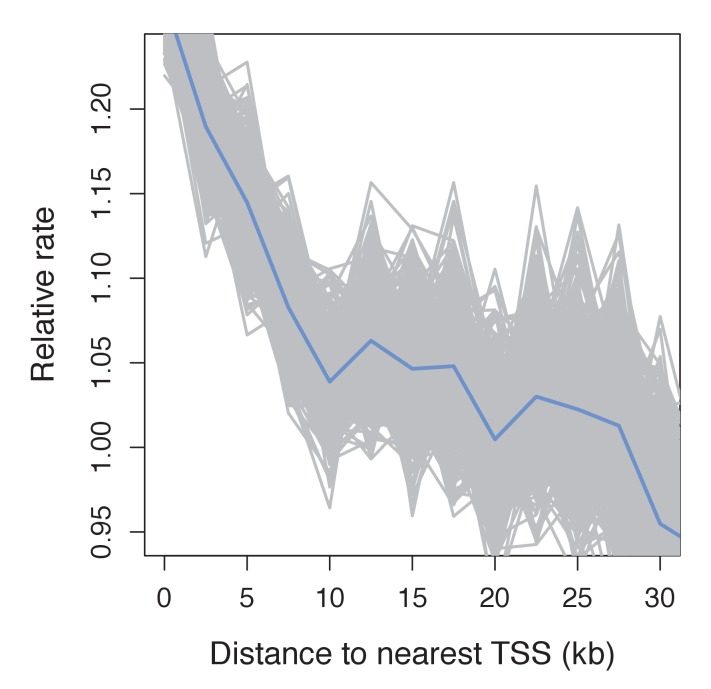
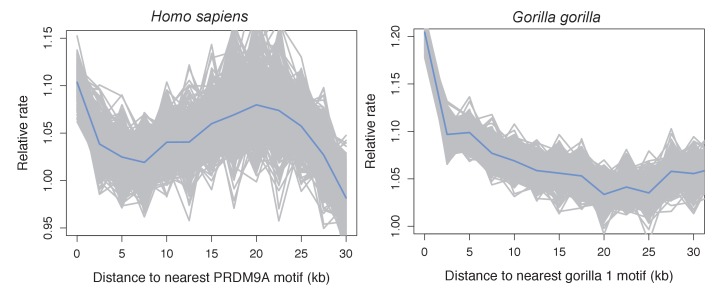
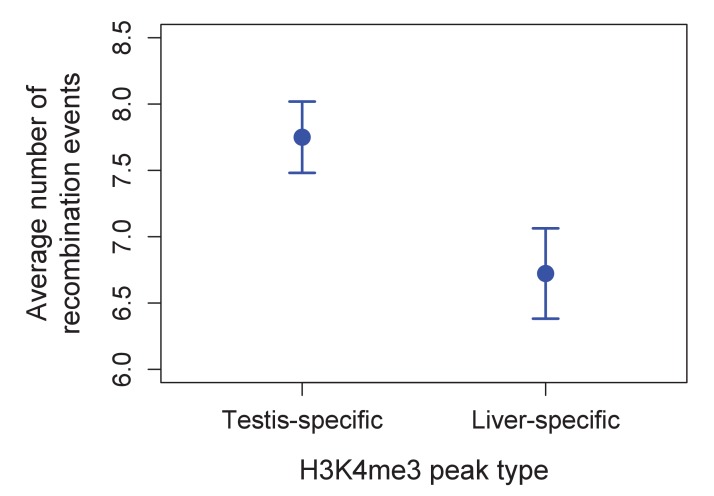
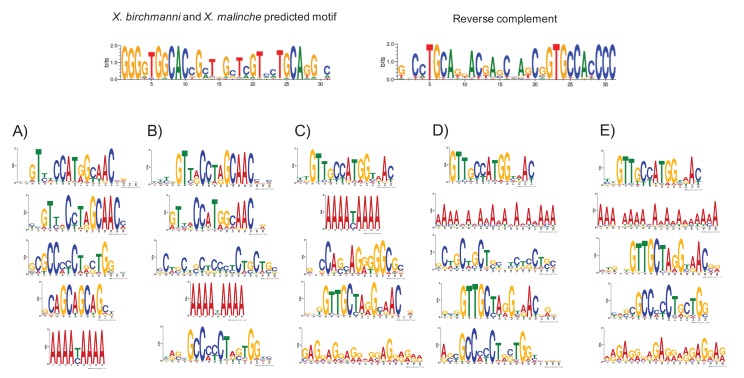
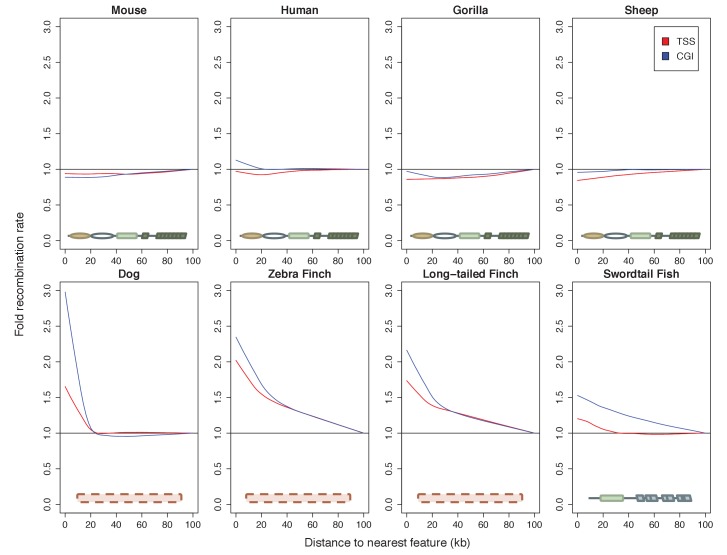
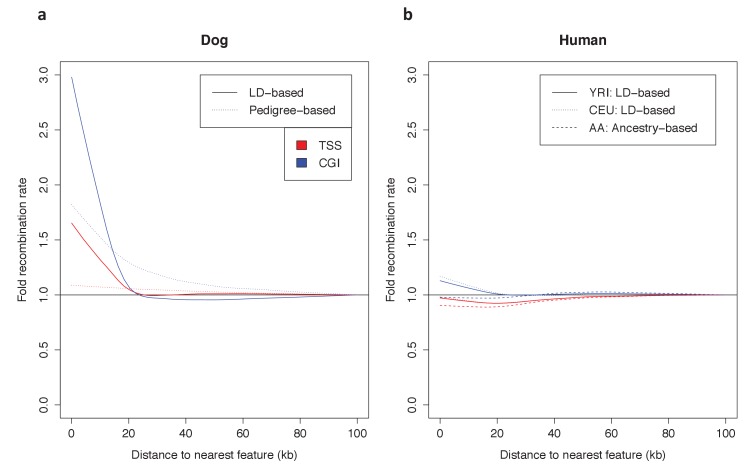
Studies of highly diverged species have revealed two mechanisms by which meiotic recombination is directed to the genome-through PRDM9 binding or by targeting promoter-like features-that lead to dramatically different evolutionary dynamics of hotspots. Here, we identify PRDM9 orthologs from genome and transcriptome data in 225 species. We find the complete PRDM9 ortholog across distantly related vertebrates but, despite this broad conservation, infer a minimum of six partial and three complete losses. Strikingly, taxa carrying the complete ortholog of PRDM9 are precisely those with rapid evolution of its predicted binding affinity, suggesting that all domains are necessary for directing recombination. Indeed, as we show, swordtail fish carrying only a partial but conserved ortholog share recombination properties with PRDM9 knock-outs.

Keywords: Hotspot; Meiosis; PRDM9; Recombination; Vertebrates; Xiphophorus; evolutionary biology; genomics.


Conflict of interest statement

MP: Reviewing editor, eLife.

The other authors declare that no competing interests exist.

Figures

Figure 1.
Figure 1.. Phylogenetic distribution and evolution of PRDM9 orthologs in vertebrates.
Shown are the four domains: KRAB domain (in tan), SSXRD (in white), PR/SET (in light green) and ZF (in gray/dark green; the approximate structure of identified ZFs is also shown). The number of unique species included from each taxon is shown in parenthesis. Complete losses are indicated on the phylogeny by red lightning bolts and partial losses by gray lightning bolts. Lightning bolts are shaded dark when all species in the indicated lineage have experienced the entire loss or same partial loss. Lightning bolts are shaded light when it is only true of a subset of species in the taxon. ZF arrays in dark green denote those taxa in which the ZF shows evidence of rapid evolution. White rectangles indicate cases where we could not determine whether the ZF was present, because of the genome assembly quality. For select taxa, we present the most complete PRDM9 gene found in two examplar species. Within teleost fish, we additionally show a PRDM9 paralog that likely arose before the common ancestor of this taxon; in this case, the number of species observed to have each paralog is in paranthesis. Although the monotremata ZF is shaded gray, it was not included in our analysis of rapid evolution because of its small number of ZFs. DOI: http://dx.doi.org/10.7554/eLife.24133.003
Figure 1—figure supplement 1.
Figure 1—figure supplement 1.. Phylogenetic approach to identifying PRDM9 orthologs and related gene families.
A maximum likelihood phylogeny built with RAxML, using an alignment of SET domains, distinguishes between genes that cluster with mammalian PRDM9 and PRDM11 with 100% bootstrap support. Genes shown in black, which are orthologous to both PRDM9 and PRDM11, are only found in jawless fish. DOI: http://dx.doi.org/10.7554/eLife.24133.004
Figure 1—figure supplement 2.
Figure 1—figure supplement 2.. Neighbor-joining (NJ) guide tree based on the SET domain.
A NJ guide tree analysis on SET domains identified in our RefSeq, whole genome assembly, and transcriptome datasets was used as an initial step to identify sequences clustering with human PRDM9/7 or PRDM11. These sequences (in red) were selected for phylogenetic analysis with RAxML; they included all RefSeq genes in our dataset that have been previously annotated as PRDM9/7 or PRDM11 (in yellow). Genes more closely related to known PRDM genes other than PRDM9 or PRDM11 (in black) were excluded from further analysis. DOI: http://dx.doi.org/10.7554/eLife.24133.005
Figure 1—figure supplement 3.
Figure 1—figure supplement 3.. Expression levels of genes with a known role in meiotic recombination in testes of three exemplar species: human, swordtail fish and bearded dragon (a lizard).
For three swordtails (X. malinche) and one bearded dragon, the FPKM per individual is plotted for each transcript. For humans, the point represents the average expression of 122 individuals from the gene expression atlas (see Materials and methods). For bearded dragons, PRDM9 and RAD50 were represented by multiple transcripts (two and three respectively), and the average expression level is shown. Dashed lines show the point estimate or average expression level of PRDM9 to highlight that several genes in each species have expression levels comparable to or lower than PRDM9 in testes. DOI: http://dx.doi.org/10.7554/eLife.24133.006
Figure 1—figure supplement 4.
Figure 1—figure supplement 4.. Amino acid diversity as a function of amino acid position in the ZF alignment for six examplar species.
Each plot shows the 95% range of diversity levels at that site for all C2H2 ZFs from a species of that taxon (gray); the values at PRDM9 are show in red or blue. Turtles, snakes and coelacanth show a pattern of diversity that is similar to those in mammalian species with a complete PRDM9 ortholog, with higher diversity at DNA-binding sites (residues 11, 12, 15 and 18) and reduced diversity at most other sites. In bony fish, this pattern is not observed in PRDM9β genes (blue) or in partial PRDM9α genes (shown for A. mexicanus), where PRDM9 ZF diversity is more typical of other C2H2 ZFs. DOI: http://dx.doi.org/10.7554/eLife.24133.007
Figure 1—figure supplement 5.
Figure 1—figure supplement 5.. Examples of differences in computationally predicted PRDM9 binding motifs for species from three taxa.
Shown are two mouse from the same species (Mus musculus subspecies; Genbank: AB844114.1; FJ899852.1), two pythons from the same species (Python bivittatus; the genome sequence and a Sanger resequenced individual; see Materials and methods), and two species of swordtail fish (X. birchmanni and X. malinche; genome sequences). The position weight matrix was obtained using C2H2 prediction tools available at http://zf.princeton.edu. DOI: http://dx.doi.org/10.7554/eLife.24133.008
Figure 2.
Figure 2.. Phylogenetic distribution and functional domains of PRDM9α orthologs in teleost fish and in holostean fish that are outgroups to the PRDM9α/PRDM9β duplication event.
Shown are the four domains: KRAB domain (in tan), SSXRD (in white), PR/SET (in light green) and ZF (in gray/dark green; the approximate structure of identified ZFs is also shown). The number of unique species included from each taxon is shown in parenthesis. Complete losses are indicated on the phylogeny by red lightning bolts and partial losses by gray lightning bolts. Lightning bolts are shaded dark when all species in the indicated lineage have experienced the loss. Lightning bolts are shaded light when it is only true of a subset of species in the taxon. ZF arrays in dark green denote those taxa in which the ZF shows evidence of rapid evolution. White rectangles indicate cases where we could not determine whether the ZF was present, because of the genome assembly quality. While many taxa shown have more than one PRDM9α ortholog, the genes identified from each species generally have similar domain architectures. Exceptions include Clupeiformes, Esociformes, and Holostean fish, for which two alternative forms of PRDM9α paralogs are shown. Based on this distribution, we infer that the common ancestor of ray-finned fish likely had a rapidly evolving and complete PRDM9α ortholog. DOI: http://dx.doi.org/10.7554/eLife.24133.009
Figure 2—figure supplement 1.
Figure 2—figure supplement 1.. Section of maximum-likelihood phylogeny of the SET domain showing bony fish PRDM9 orthologs α and β.
The reciprocal monophyly of PRDM9 orthologs α and β is reasonably well supported and in particular bootstrap support for the monophyly of PRDM9α genes is 75%. The ZF domains for representative PRDM9 orthologs of each type are shown to the right, with each gray pentagon indicating the location of a ZF. In swordtail fish, the complete ZF array is found within a single exon, and the last tandem array of six ZFs forms a minisatellite structure. DOI: http://dx.doi.org/10.7554/eLife.24133.010
Figure 2—figure supplement 2.
Figure 2—figure supplement 2.. Analysis of ZF evolution in PRDM9β.
Red lines show the median (solid) and first and third quantiles (dashed lines) for all 48 complete PRDM9 orthologs identified in vertebrates that have four or more ZFs. Blue lines show the median (solid) and first and third quantiles (dashed lines) for all other C2H2 ZF genes from X. maculatus (157 genes). Results about the rate of ZF evolution in the PRDM9β gene from X. maculatus are qualitatively similar regardless of our choice of which cluster of individual ZF domains to include in our analysis, indicating that our ability to detect evidence of positive selection at DNA-binding residues in these arrays, or lack thereof, is unlikely to be influenced by this choice. DOI: http://dx.doi.org/10.7554/eLife.24133.011
Figure 3.
Figure 3.. Substitutions at SET domain catalytic residues in bony fish PRDM9 genes.
(a) Lineages within bony fish carrying substitutions at each of three tyrosine residues involved in H3K4me3 catalysis in human PRDM9 are shown in blue, yellow and red. (b) Lineages carrying substitutions at one, two or three of these residues are shown in red, pink and blue respectively. All PRDM9β genes as well as a partial PRDM9 ortholog from holostean fish carry one or more substitutions at these residues. The PRDM9β gene from Xiphophorus is indicated by the presence of asterisk. DOI: http://dx.doi.org/10.7554/eLife.24133.013
Figure 4.
Figure 4.. Patterns of recombination and PRDM9 evolution in swordtail fish.
(a) The ZF array of PRDM9 appears to be evolving slowly in Xiphophorus, with few changes over 1 million years of divergence (Cui et al., 2013; Jones et al., 2013). (b) PRDM9 is upregulated in the germline relative to the liver in X. birchmanni (circles) and X. malinche (squares; panel shows three biological replicates for each species). (c) The computationally-predicted PRDM9 binding sites is not unusually associated with H3K4me3 peaks in testes (d) Crossover rates increase near H3K4me3 peaks in testis (e) Crossover rates increase near CGIs (f) Crossover rates do not increase near computationally-predicted PRDM9 binding sites (see Figure 4—figure supplement 3 for comparison). Crossover rates were estimated from ancestry switchpoints in naturally occurring hybrids between X. birchmanni and X. malinche (see Materials and methods). DOI: http://dx.doi.org/10.7554/eLife.24133.014
Figure 4—figure supplement 1.
Figure 4—figure supplement 1.. Expression levels of meiosis-related genes in swordtail fish tissues.
In general, the seven meiosis-related genes surveyed had higher expression in tissues containing germline cells than liver tissue, but this pattern was much more pronounced in testis tissue (compared to ovary tissue). As a result, we focused our analysis of meiosis related genes on RNAseq data generated from testis. Results shown are based on analysis of three male and female biological replicates from each swordtail species (X. birchmanni and X. malinche). DOI: http://dx.doi.org/10.7554/eLife.24133.015
Figure 4—figure supplement 2.
Figure 4—figure supplement 2.. Recombination frequency in swordtails as a function of distance to the TSS.
Partial correlation analyses suggest that the association between the TSS and recombination rate in swordtails is explained by H3K4me3 peaks and CGIs. DOI: http://dx.doi.org/10.7554/eLife.24133.016
Figure 4—figure supplement 3.
Figure 4—figure supplement 3.. Recombination rates show a peak near the computationally predicted PRDM9A binding motif in humans and gor-1 allele in gorillas.
Most work investigating relationships between PRDM9 motifs and recombination rates have focused on the PRDM9 motif empirically inferred from recombination hotspots, but the empirical motif is unknown for many species. To generate results comparable to those we present for swordtails in Figure 4F, we therefore determined recombination rate (using the map based on LD patterns in the CEU; Frazer et al., 2007) as a function of distance to computationally predicted binding sites for the PRDM9A motif in humans and as a function of distance to computationally predicted binding sites for the gor-1 PRDM9 allele (Schwartz et al., 2014) in gorillas (using the LD-based map from Great Ape Genome Project et al., 2016). DOI: http://dx.doi.org/10.7554/eLife.24133.017
Figure 4—figure supplement 4.
Figure 4—figure supplement 4.. Higher observed recombination rate at testis-specific H3K4me3 peaks than liver-specific H3K4me3 peaks.
H3K4me3 peaks found only in the testis and not in the liver of X. birchmanni have higher observed recombination rates in X. birchmanni – X. malinche hybrids. This pattern supports the conclusion that H3K4me3 peaks are associated with recombination in swordtails. DOI: http://dx.doi.org/10.7554/eLife.24133.018
Figure 4—figure supplement 5.
Figure 4—figure supplement 5.. MEME prediction of sequences enriched in testis-H3K4me3 peaks relative to liver-specific H3K4me3 peaks.
Results shown in A-E are from five replicate runs of 2000 testis-specific sequences using liver-specific sequences as a background comparison set. The swordtail computationally-predicted PRDM9 binding motif is shown for comparison. DOI: http://dx.doi.org/10.7554/eLife.24133.019
Figure 5.
Figure 5.. Patterns of recombination near TSSs and CGIs in species with and without complete PRDM9 orthologs.
For each species, recombination rates were binned in 10 kb windows along the genome; curves were fit using gaussian loess smoothing. The fold change in recombination rates shown on the y-axis is relative to recombination rates at the last point shown. Species shown in the top row have complete PRDM9 orthologs (mouse, human, gorilla and sheep), whereas species in the bottom row have no PRDM9 ortholog (dog, zebra finch, long-tailed finch), or a partial PRDM9 ortholog (swordtail fish). DOI: http://dx.doi.org/10.7554/eLife.24133.020
Figure 5—figure supplement 1.
Figure 5—figure supplement 1.. Dependence of patterns of recombination near TSSs and CGIs in dog and human on the type of genetic map.
(a) Recombination rates near the TSS and CGI in dogs are shown using recombination maps inferred either from LD patterns or pedigree data. The magnitude of the peak near these features is lower in the map with lower resolution. This observation raises the possibility that a higher resolution map in swordtail fish would result in a higher peak near these features. (b) Recombination rates near the TSS and CGI in humans are shown using recombination maps inferred either from LD patterns or ancestry switches in African-American samples. Recombination rates near the TSS and CGI in human do not seem to be strongly influenced by the choice of genetic map, though peaks at these features are slightly reduced in admixture- and pedigree-based methods. DOI: http://dx.doi.org/10.7554/eLife.24133.021

Comment in

  • Birth and death of a protein.
    Clément J, de Massy B. Clément J, et al. Elife. 2017 Jul 20;6:e29502. doi: 10.7554/eLife.29502. Elife. 2017. PMID: 28726634 Free PMC article.

References

    1. Altschul SF, Gish W, Miller W, Myers EW, Lipman DJ. Basic local alignment search tool. Journal of Molecular Biology. 1990;215:403–410. doi: 10.1016/S0022-2836(05)80360-2. - DOI - PubMed
    1. Amores A, Catchen J, Nanda I, Warren W, Walter R, Schartl M, Postlethwait JH. A RAD-tag genetic map for the platyfish (Xiphophorus maculatus) reveals mechanisms of karyotype evolution among teleost fish. Genetics. 2014;197:625–641. doi: 10.1534/genetics.114.164293. - DOI - PMC - PubMed
    1. Andolfatto P, Davison D, Erezyilmaz D, Hu TT, Mast J, Sunayama-Morita T, Stern DL. Multiplexed shotgun genotyping for rapid and efficient genetic mapping. Genome Research. 2011;21:610–617. doi: 10.1101/gr.115402.110. - DOI - PMC - PubMed
    1. Auton A, Fledel-Alon A, Pfeifer S, Venn O, Ségurel L, Street T, Leffler EM, Bowden R, Aneas I, Broxholme J, Humburg P, Iqbal Z, Lunter G, Maller J, Hernandez RD, Melton C, Venkat A, Nobrega MA, Bontrop R, Myers S, Donnelly P, Przeworski M, McVean G. A fine-scale chimpanzee genetic map from population sequencing. Science. 2012;336:193–198. doi: 10.1126/science.1216872. - DOI - PMC - PubMed
    1. Auton A, Rui Li Y, Kidd J, Oliveira K, Nadel J, Holloway JK, Hayward JJ, Cohen PE, Greally JM, Wang J, Bustamante CD, Boyko AR. Genetic recombination is targeted towards gene promoter regions in dogs. PLoS Genetics. 2013;9:e1003984. doi: 10.1371/journal.pgen.1003984. - DOI - PMC - PubMed

Publication types

Substances