. 2017 Jun 7:6:e23978.
doi: 10.7554/eLife.23978.

Attentional modulation of neuronal variability in circuit models of cortex

Affiliations

Attentional modulation of neuronal variability in circuit models of cortex

Tatjana Kanashiro et al. Elife. .

Abstract

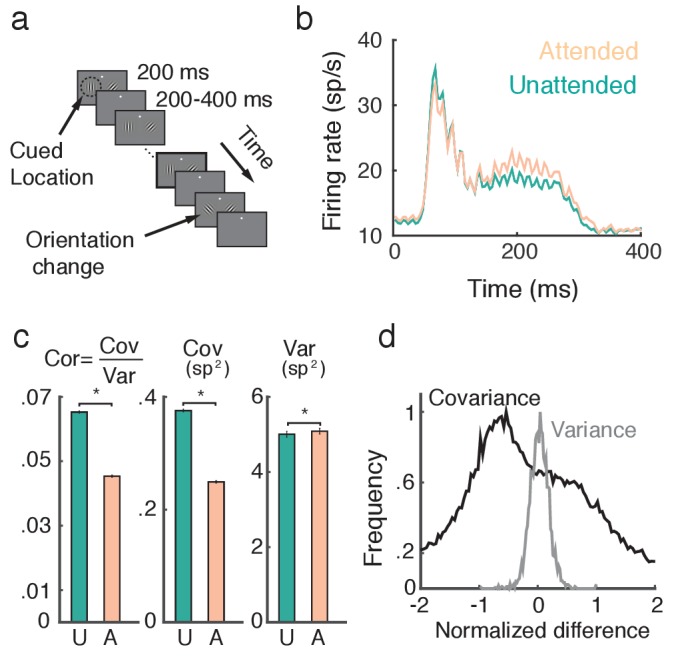
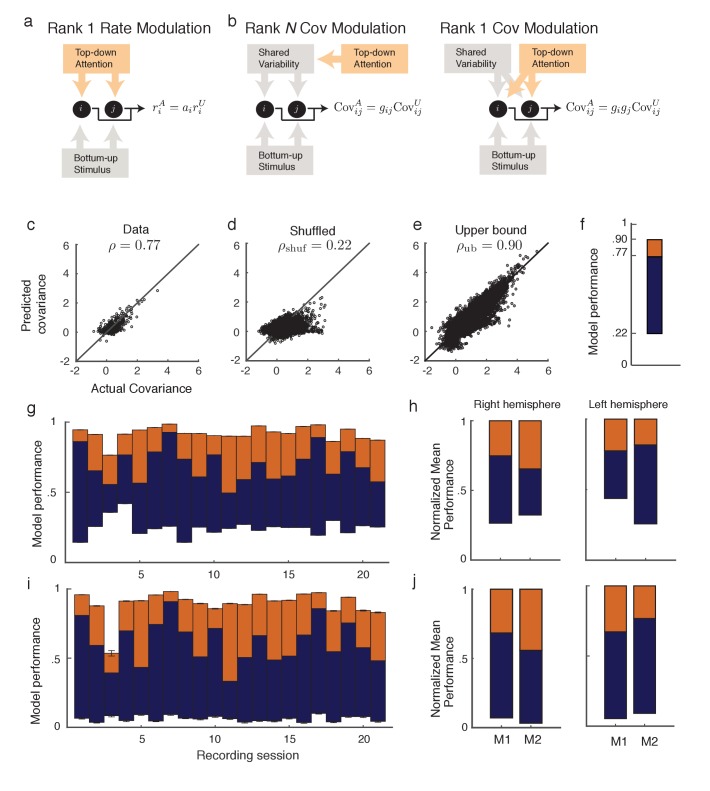
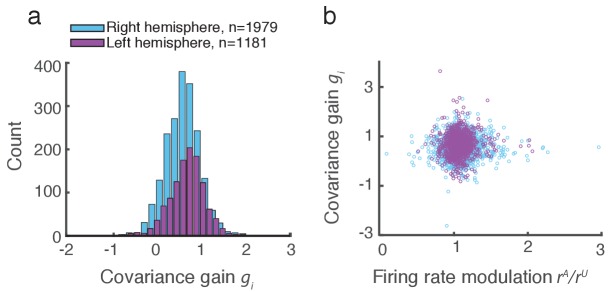
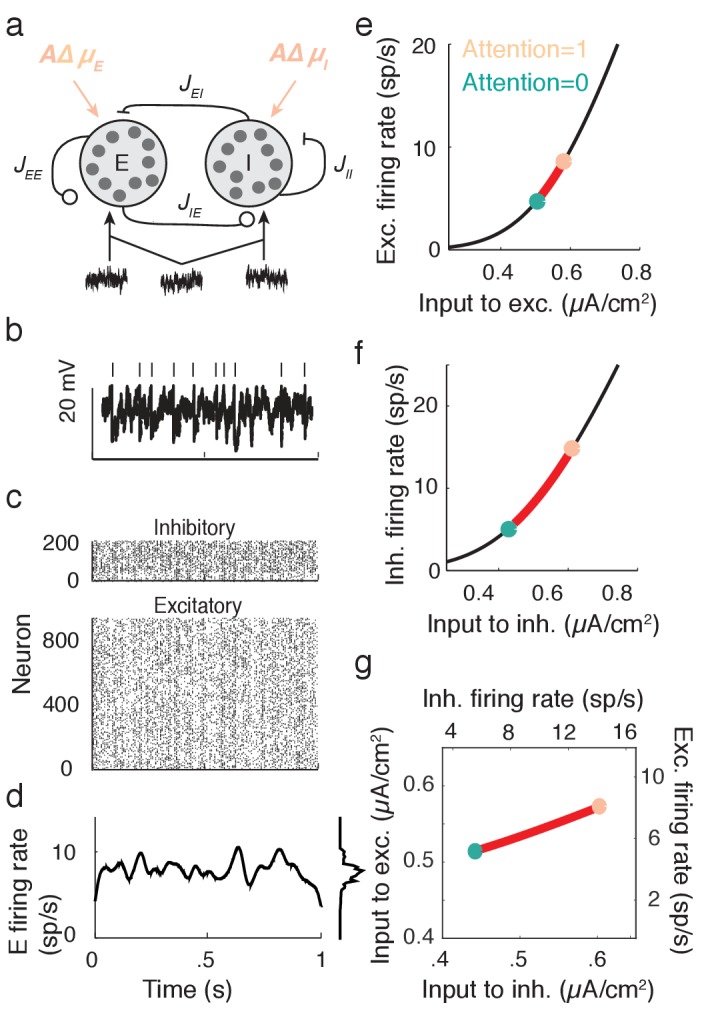
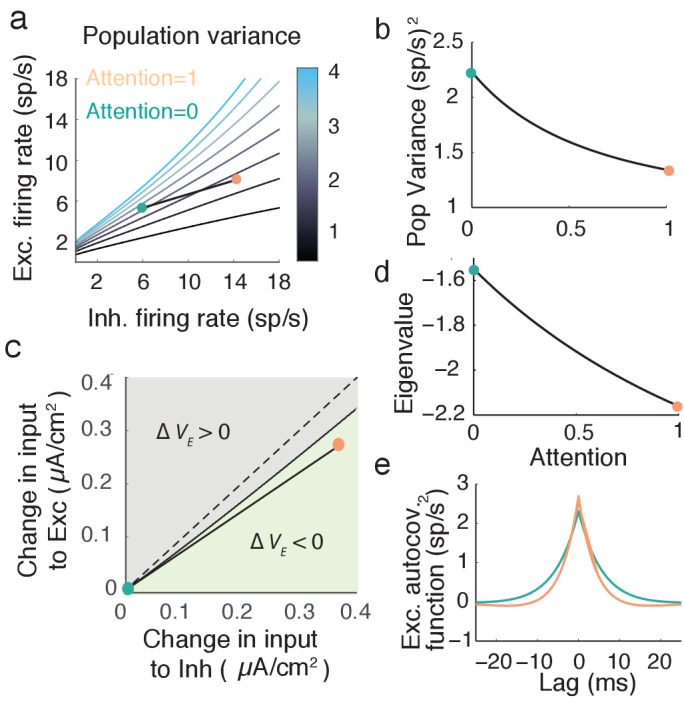
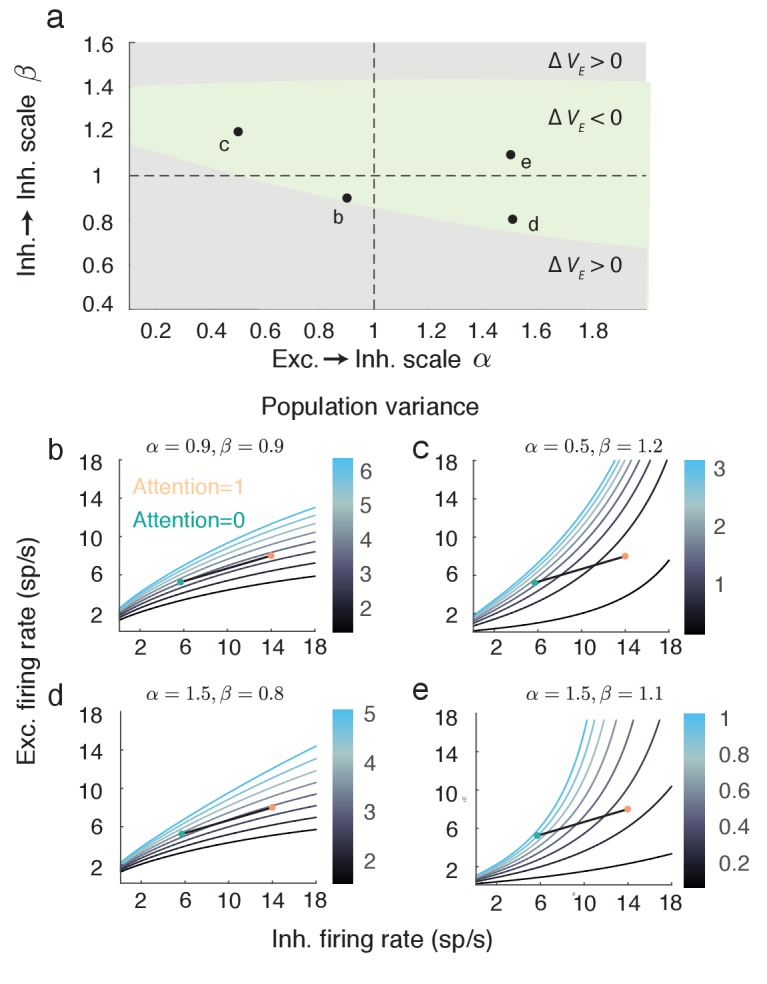
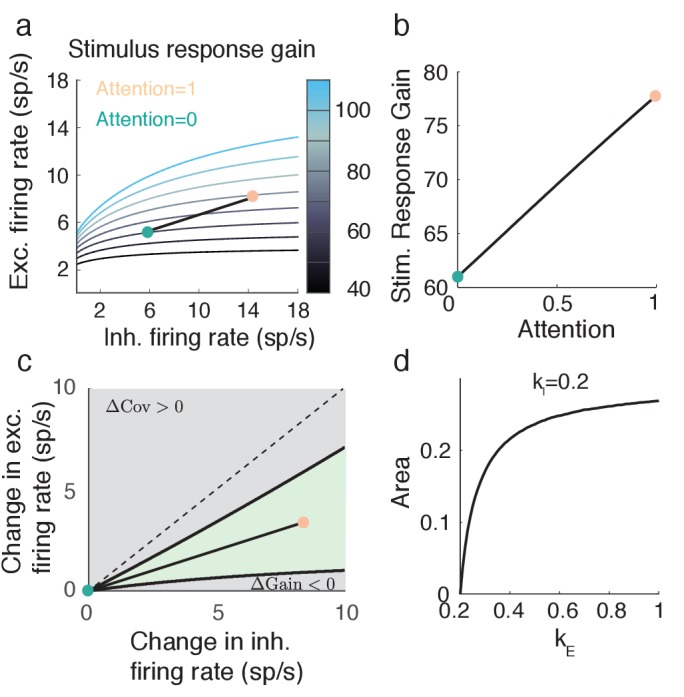
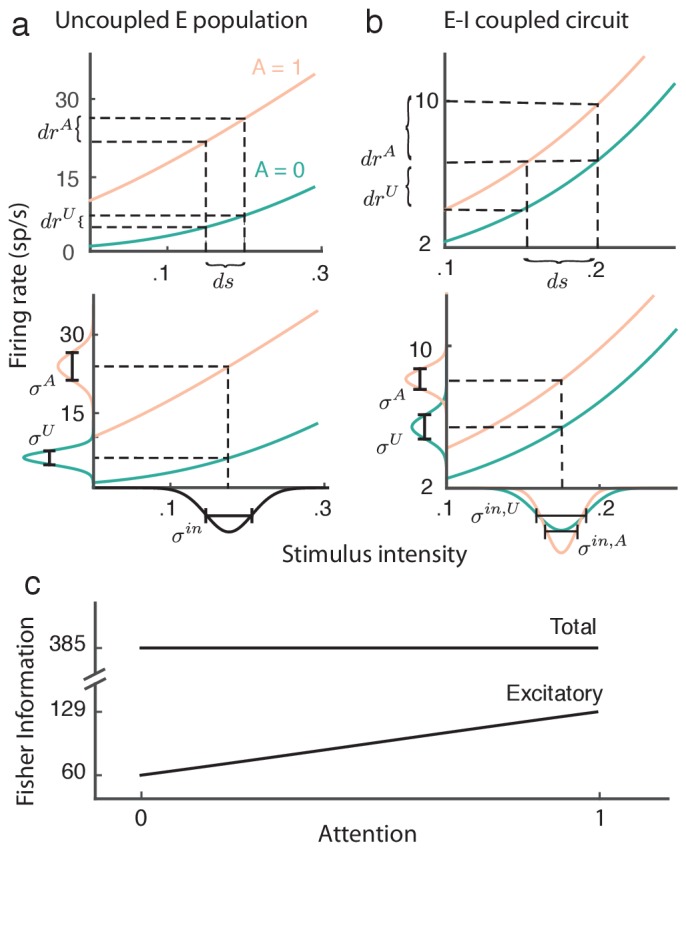
The circuit mechanisms behind shared neural variability (noise correlation) and its dependence on neural state are poorly understood. Visual attention is well-suited to constrain cortical models of response variability because attention both increases firing rates and their stimulus sensitivity, as well as decreases noise correlations. We provide a novel analysis of population recordings in rhesus primate visual area V4 showing that a single biophysical mechanism may underlie these diverse neural correlates of attention. We explore model cortical networks where top-down mediated increases in excitability, distributed across excitatory and inhibitory targets, capture the key neuronal correlates of attention. Our models predict that top-down signals primarily affect inhibitory neurons, whereas excitatory neurons are more sensitive to stimulus specific bottom-up inputs. Accounting for trial variability in models of state dependent modulation of neuronal activity is a critical step in building a mechanistic theory of neuronal cognition.

Keywords: inhibitory feedback; mean field model; neural correlates of attention; neuroscience; noise correlations; rhesus macaque.


Conflict of interest statement

The authors declare that no competing interests exist.

Figures

Figure 1.
Figure 1.. Attention increases firing rates and decreases trial-to-trial covariability of population responses.
(a) Overview of orientation-change detection task; see (Cohen and Maunsell, 2009) for a full description. (b) Firing rates of neurons in the unattended (turquoise) and attended (orange) states, averaged over 3170 units. The slight oscillation in the firing rate was due to the monitor refresh rate. (c) Attention significantly decreased the spike count correlation and covariance and slightly increased variance. Error bars provide the SEM. (d) Histograms of changes in covariance for each unit pair (black) and variance for each unit (gray). In each case we consider the relative change [XAXU]/max(XA,XU), where X is either Cov(ni,nj) or Var(ni). Data was collected from two monkeys over 21 and 16 recording sessions respectively. Signals were analyzed over a 200 ms interval, starting 60 ms after stimulus onset. DOI: http://dx.doi.org/10.7554/eLife.23978.003
Figure 2.
Figure 2.. Rank one structure of attentional modulation of spike count covariance.
(a) Attentional modulation of firing rate. Firing rates of neurons i and j (black circles are modulated by bottom-up stimulus and top-down attention. (b) Two possible models of attentional modulation of covariance. Left: High-rank covariance modulation, in which attention modulates the shared variability of each pair of neurons. Right: Low-rank covariance modulation, in which attention modulates each neuron individually rather than in a pairwise manner. (c–e) The measured covariance values plotted against those predicted by the rank-1 model for data collected in one recording session, for c, the actual data (ρ=0.77), d, shuffled data (ρshuf=0.22, 100 shuffles), and (e) artificial upper-bound data (ρub=0.90, 10 realizations of the upper bound model). (f) Synthesis of c-e in a bar plot. The orange area represents the loss of model performance compared to the upper bound model, and the blue area represents the increase in model performance compared to model applied to shuffled data. (g) Rank-1 model performance reported for 21 recording sessions from one monkey. Each bar represents one recording session. Recordings from a mean of N=53.5 units in the right-hemisphere were analyzed, with maximum and minimum N of 80 and 35, respectively. Error bars denote standard error of the mean. (h) Mean normalized performance (relative to ρub) for both hemispheres of two monkeys (M1 and M2). (i), Analysis as in (g), using leave-one-out cross-validation to test the predictive power of the model. (j) Mean normalized performance of the cross-validated data. DOI: http://dx.doi.org/10.7554/eLife.23978.004
Figure 3.
Figure 3.. Covariance gain shows the attenuation of population-wide fluctuations with attention.
(a) Distribution of covariance gains gi computed from the entire data set. (b) The relation between covariance gi and the attention mediated modulation of firing rates riA/riU. The correlation coefficients between the data sets were 0.036 and 0.051 for the right and left hemispheres, respectively. DOI: http://dx.doi.org/10.7554/eLife.23978.005
Figure 4.
Figure 4.. Excitatory-inhibitory network model.
(a) Recurrent excitatory-inhibitory network subject to private and shared fluctuations as well as top-down attentional modulation. (b) Example voltage trace from a LIF model neuron in the network. Top tick marks denote spike times. (c) Spike time raster plot of the spiking activity from the model network. (d) Population-averaged firing rate rE(t) of the excitatory population. Left: frequency distribution of population-averaged firing rate. (e) Transfer function fE between the effective input and the firing rate for a model excitatory neuron. The red segment represents the attentional shift in effective input and hence firing rate. (f), Same as e, but for the inhibitory population. (g) Attention as a path through (r¯E,r¯I) space, and equivalently through (IEeff, IIeff) space. DOI: http://dx.doi.org/10.7554/eLife.23978.006
Figure 5.
Figure 5.. Mean field model shows an attention mediated decrease in population variance.
(a) An attentional path in excitatory-inhibitory firing rate space for which the population variance decreases. Colored contours define iso-lines of population variance in increments of 10 (sp/s)2. The attentional path links the unattended state (A=0; turquoise point) to the attended state (A=1, orange point). (b) Variance values as a function of the attentional path defined in a. (c) The modulation from an unattended state (origin) to an attended state over the input space (ΔμE,ΔμI). Solid black line marks where VE remains unchanged, and the green region where ΔVE=VarA(rE)VarU(rE) is less than zero. (d) The eigenvalue (λ) along the attentional path. With increased attention it becomes more negative, indicating that the state (r¯E, r¯I) is more stable. e, Autocovariance function of the excitatory population rate rE(t) in the attended and unattended state (computed using Equation (19)). DOI: http://dx.doi.org/10.7554/eLife.23978.007
Figure 6.
Figure 6.. The attention mediated reduction in population variance is robust to changes in strength of recurrent connectivity.
(a) Sweep over α=JEE/JIE and β=JEI/JII space (with JEE and JEI fixed) labeling the region where ΔVE=VEU-VEA is positive (grey) and negative (green). (b–e) Attentional path in excitatory-inhibitory firing rate space. The colored contours are as in Figure 5a. All calculations are done using Equations (18–20). DOI: http://dx.doi.org/10.7554/eLife.23978.008
Figure 7.
Figure 7.. Attention model can capture increase in stimulus response gain GE despite decrease in population variance VE.
(a) Attentional path through (r¯E,r¯I) space shows an increase in stimulus response gain. The shown path is the same path as in Figure 5. (b) Values of GE along the path depicted in a. (c) The green region in (r¯E,r¯I) space denotes where ΔVE=VarA(rE)VarU(rE) < 0 and ΔGE=GEAGEU > 0. Black lines are iso-lines of covariance and gain, along which those quantities do not change. (d) Percent area of the green region in c out of a constant rectangle, as the feedforward stimulus gain kE increases, with kI=0.2 held constant. DOI: http://dx.doi.org/10.7554/eLife.23978.009
Figure 8.
Figure 8.. Attention improves stimulus estimation by the excitatory population embedded within excitatory (E)-inhibitory (I) network.
(a) Top: For a uncoupled excitatory population, the stimulus response gain GE increases with attention. Turquoise: unattended state; orange: attended state. Bottom: Population variance VE increases with attention. Stimulus-response curves same as above. Input variance is computed from all input to a population, including external noise and recurrent coupling. The Fisher information for the uncoupled E population is constant with attention because the squared gain GE2 and variance VE increase proportionally (b) Same as (a) but for the E population within the E-I network. Top: GE increases with attention. Bottom: VE decreases with attention, because the net input variance of the E population decreases with attention. (c) Total Fisher information for coupled E-I populations is constant with attention. By contrast, the Fisher information of the excitatory component FIE increases with attention. DOI: http://dx.doi.org/10.7554/eLife.23978.010
Appendix 1—figure 1.
Appendix 1—figure 1.. Detected structure in randomly generated covariance matrices is a finite-size effect.
The model performance (ρshuf) decreases with increasing system size (black curves). The ρshuf computed from the shuffled neural data (red dots) falls in the same area as the synthetic data performance, suggesting that the synthetic data is a reasonable stand-in. DOI: http://dx.doi.org/10.7554/eLife.23978.012
Appendix 1—figure 2.
Appendix 1—figure 2.. The performance of the model ρub (black curves) on synthetic data using increasing numbers of Poisson realizations approaches 1.
The Poisson model computed with the same number of trials as the data is shown for comparison (red dots). DOI: http://dx.doi.org/10.7554/eLife.23978.013
Appendix 1—figure 3.
Appendix 1—figure 3.. Performance of basic analysis on model on individual recording sessions from left hemisphere of monkey 1, and both hemispheres of monkey 2.
The format and colors match that described in Figure 2 of the main text. DOI: http://dx.doi.org/10.7554/eLife.23978.014
Appendix 1—figure 4.
Appendix 1—figure 4.. Performance of leave-one-out cross-validation on model on data from individual recording sessions from the left hemisphere of Monkey 1, and both hemispheres of Monkey 2.
The format and colors match that described in Figure 2 of the main text. DOI: http://dx.doi.org/10.7554/eLife.23978.015
Appendix 1—figure 5.
Appendix 1—figure 5.. Overlap analysis of gain parameters.
(a) Schematic of overlap analysis. A set of n2i-1 neurons is divided into two sets S1 and S2 of i, which overlap by exactly one neuron, indexed without loss of generality as neuron i. Parameter gi is computed using S1 and S2, resulting in two estimates gi(1) and gi(2). (b) Spread of g estimates for the data (black), as well as the upper (blue) and lower (green) bounds, from one day of recordings in one monkey. (c) Mean variance of the g estimates computed from the data (abscissa) vs from the upper bound (ordinate), normalized by the mean shuffled variance. Each color denotes one of the monkeys, circles denote the right hemisphere recordings, and plusses denote the left hemisphere recordings. The gray regions consist of those points that are beyond 0.5, and therefore closer to the lower bound than the upper bound. DOI: http://dx.doi.org/10.7554/eLife.23978.016
Appendix 1—figure 6.
Appendix 1—figure 6.. Spiking model and simulations.
(a,b) Example voltage trace from an excitatory model neuron in the unattended (a) and attended (b) states. Top tick marks denote spike times. (c) Raster plot of neurons in the unattended state. Neurons 1 to 1000 are excitatory, and 1001 to 1200 are inhibitory. (d) Raster plot of neurons in the attended state. (e) Excitatory population-averaged firing rates for the unattended (turquoise) and attended (orange) states. Right: frequency distributions of population-averaged firing rates. (f) Mean pairwise spike count covariance for different counting windows. Other than an increase in synchrony on very small timescales due to gamma oscillations, the spike count covariance decreases with attention regardless of counting window. (g) Ratio RCov of attended and unattended spike count covariance, as a function of counting window. (h, i) Derived (solid turquoise) and simulated (muted turquoise) spike train cross-covariance functions of excitatory neurons in the unattended (h) and attended (i) states, averaged over pairs. (j) Spike train cross-covariance functions of excitatory neurons in the unattended and attended states, normalized to peak at 1. (k, l) Normalized input current cross-correlation functions of excitatory inputs to pairs of neurons (dashed green), inhibitory inputs to pairs of neurons (dashed red), excitatory and inhibitory inputs to pairs of neurons (blue), and summed excitatory and inhibitory recurrent inputs to pairs of neurons (black), in the unattended (k) and attended (l) states. (m) Attended (orange) vs unattended (turquoise) recurrent input cross-correlation functions. The excitatory cross-correlation function is narrower, just as for the output cross-covariance function, so the effects are happening on the level of inputs. DOI: http://dx.doi.org/10.7554/eLife.23978.017

Similar articles

Cited by

References

    1. Alitto HJ, Dan Y. Cell-type-specific modulation of neocortical activity by basal forebrain input. Frontiers in Systems Neuroscience. 2012;6:79. doi: 10.3389/fnsys.2012.00079. - DOI - PMC - PubMed
    1. Ardid S, Wang XJ, Compte A. An integrated microcircuit model of attentional processing in the neocortex. Journal of Neuroscience. 2007;27:8486–8495. doi: 10.1523/JNEUROSCI.1145-07.2007. - DOI - PMC - PubMed
    1. Averbeck BB, Latham PE, Pouget A. Neural correlations, population coding and computation. Nature Reviews Neuroscience. 2006;7:358–366. doi: 10.1038/nrn1888. - DOI - PubMed
    1. Beck J, Bejjanki VR, Pouget A. Insights from a simple expression for linear fisher information in a recurrently connected population of spiking neurons. Neural Computation. 2011;23:1484–1502. doi: 10.1162/NECO_a_00125. - DOI - PubMed
    1. Ben-Yishai R, Bar-Or RL, Sompolinsky H. Theory of orientation tuning in visual cortex. PNAS. 1995;92:3844–3848. doi: 10.1073/pnas.92.9.3844. - DOI - PMC - PubMed

Publication types

LinkOut - more resources