

Implant Strategy-Specific Changes in Symptoms in Response to Left Ventricular Assist Devices
- PMID: 28591005
- PMCID: PMC6173804
- DOI: 10.1097/JCN.0000000000000430
Implant Strategy-Specific Changes in Symptoms in Response to Left Ventricular Assist Devices
Abstract
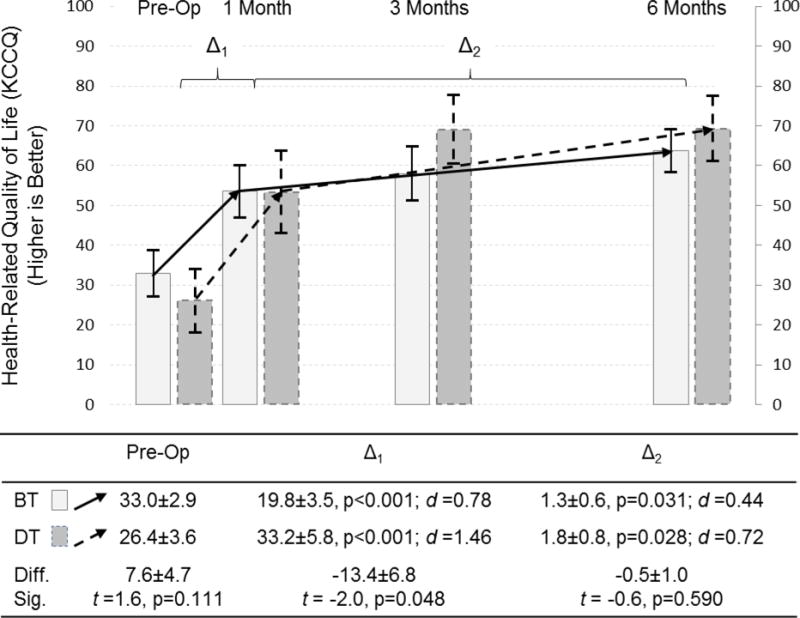
Background: Although we know that the quality of life generally improves after left ventricular assist device (LVAD) implantation, we know little about how symptoms change in response to LVAD.
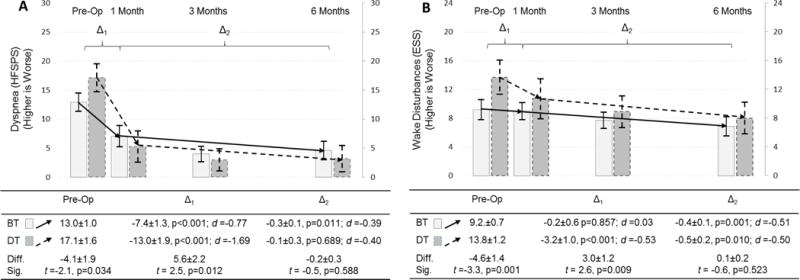
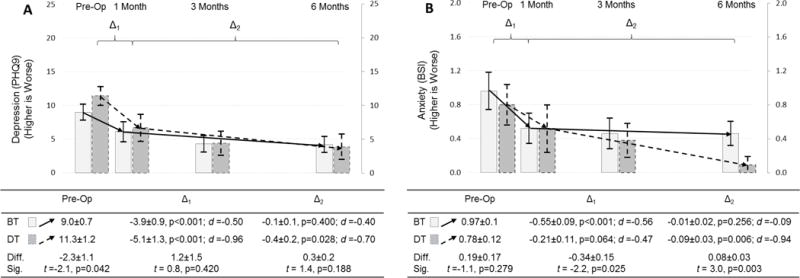
Methods: The purpose of this study was to compare the changes in symptoms between bridge and destination therapy patients as part of a prospective cohort study. Physical (dyspnea and wake disturbances) and affective symptoms (depression and anxiety) were measured before LVAD and at 1, 3, and 6 months after LVAD. Multiphase growth modeling was used to capture the 2 major phases of change: initial improvements between preimplant and 1 month after LVAD and subsequent improvements between 1 and 6 months after LVAD.
Results: The sample included 64 bridge and 22 destination therapy patients as the preimplant strategy. Destination patients had worse preimplant dyspnea and wake disturbances, and they experienced greater initial improvements in these symptoms compared with bridge patients (all P < .05); subsequent change in both symptoms were similar between groups (both P > .05). Destination patients had worse preimplant depression (P = .042) but experienced similar initial and subsequent improvements in depression in response to LVAD compared with bridge patients (both P > .05). Destination patients had similar preimplant anxiety (P = .279) but experienced less initial and greater subsequent improvements in anxiety after LVAD compared with bridge patients (both P < .05).
Conclusion: There are many differences in the magnitude and timing of change in symptom responses to LVAD between bridge and destination therapy patients. Detailed information on changes in specific symptoms may better inform shared decision-making regarding LVAD.
Figures
Similar articles
-
Comorbidities and the decision to undergo or forego destination therapy left ventricular assist device implantation: An analysis from the Trial of a Shared Decision Support Intervention for Patients and their Caregivers Offered Destination Therapy for End-Stage Heart Failure (DECIDE-LVAD) study.Am Heart J. 2019 Jul;213:91-96. doi: 10.1016/j.ahj.2019.04.008. Epub 2019 Apr 25. Am Heart J. 2019. PMID: 31129442 Clinical Trial.
-
Heart Failure Symptom Biology in Response to Ventricular Assist Device Implantation.J Cardiovasc Nurs. 2019 Mar-Apr;34(2):174-182. doi: 10.1097/JCN.0000000000000552. J Cardiovasc Nurs. 2019. PMID: 30489416 Free PMC article.
-
Reduced Anxiety and Depression in Patients With Advanced Heart Failure After Left Ventricular Assist Device Implantation.Psychosomatics. 2017 Jul-Aug;58(4):406-414. doi: 10.1016/j.psym.2017.02.001. Epub 2017 Feb 12. Psychosomatics. 2017. PMID: 28408037
-
Building a bridge to recovery: the pathophysiology of LVAD-induced reverse modeling in heart failure.Surg Today. 2016 Feb;46(2):149-54. doi: 10.1007/s00595-015-1149-8. Epub 2015 Apr 4. Surg Today. 2016. PMID: 25840890 Review.
-
The Perceptions of Important Elements of Caregiving for a Left Ventricular Assist Device Patient: A Qualitative Meta-Synthesis.J Cardiovasc Nurs. 2016 May-Jun;31(3):215-25. doi: 10.1097/JCN.0000000000000242. J Cardiovasc Nurs. 2016. PMID: 25882647 Free PMC article. Review.
Cited by
-
Adverse events in patients with a left ventricular assist device: are patient-reported outcomes affected?Eur J Cardiovasc Nurs. 2022 Apr 9;21(3):254-260. doi: 10.1093/eurjcn/zvab070. Eur J Cardiovasc Nurs. 2022. PMID: 34453523 Free PMC article.
-
Relationship between device acceptance and patient-reported outcomes in Left Ventricular Assist Device (LVAD) recipients.Sci Rep. 2019 Jul 25;9(1):10778. doi: 10.1038/s41598-019-47324-z. Sci Rep. 2019. PMID: 31346241 Free PMC article.
-
Patterns and predictors of dyspnoea following left ventricular assist device implantation.Eur J Cardiovasc Nurs. 2022 Oct 14;21(7):724-731. doi: 10.1093/eurjcn/zvac007. Eur J Cardiovasc Nurs. 2022. PMID: 35138359 Free PMC article.
-
Mental health disorders and emergency resource use and outcomes in ventricular assist device supported patients.Am Heart J. 2021 Oct;240:11-15. doi: 10.1016/j.ahj.2021.05.018. Epub 2021 Jun 3. Am Heart J. 2021. PMID: 34089695 Free PMC article.
-
The Impact of Cardiac Devices on Patients' Quality of Life-A Systematic Review and Meta-Analysis.J Cardiovasc Dev Dis. 2022 Aug 10;9(8):257. doi: 10.3390/jcdd9080257. J Cardiovasc Dev Dis. 2022. PMID: 36005421 Free PMC article. Review.
References
-
- Metra M, Ponikowski P, Dickstein K, et al. Advanced chronic heart failure: A position statement from the Study Group on Advanced Heart Failure of the Heart Failure Association of the European Society of Cardiology. Eur J Heart Fail. 2007;9(6–7):684–694. - PubMed
-
- Mozaffarian D, Benjamin EJ, Go AS, et al. Heart disease and stroke statistics–2015 update: a report from the American Heart Association. Circulation. 2015;131(4):e29–322. - PubMed
-
- Stehlik J, Edwards LB, Kucheryavaya AY, et al. The Registry of the International Society for Heart and Lung Transplantation: 29th official adult heart transplant report–2012. J Heart Lung Transplant. 2012;31(10):1052–1064. - PubMed
-
- Nohria A, Lewis E, Stevenson LW. Medical management of advanced heart failure. JAMA. 2002;287(5):628–640. - PubMed
Publication types
MeSH terms
Grants and funding
LinkOut - more resources
Full Text Sources
Other Literature Sources
Medical
