. 2017 Jun 7;12(6):e0179047.
doi: 10.1371/journal.pone.0179047. eCollection 2017.

Regulation of neural stem cell proliferation and differentiation by Kinesin family member 2a

Affiliations

Regulation of neural stem cell proliferation and differentiation by Kinesin family member 2a

Dong Sun et al. PLoS One. .

Abstract

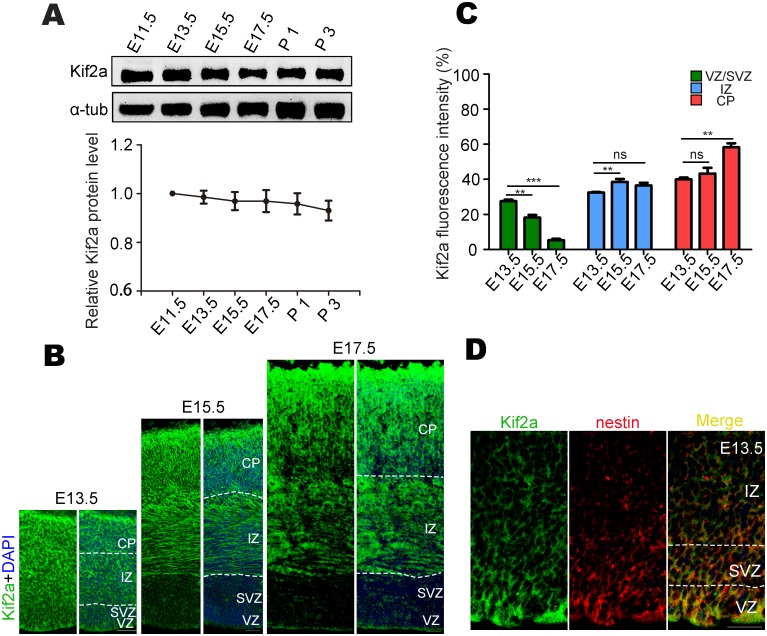
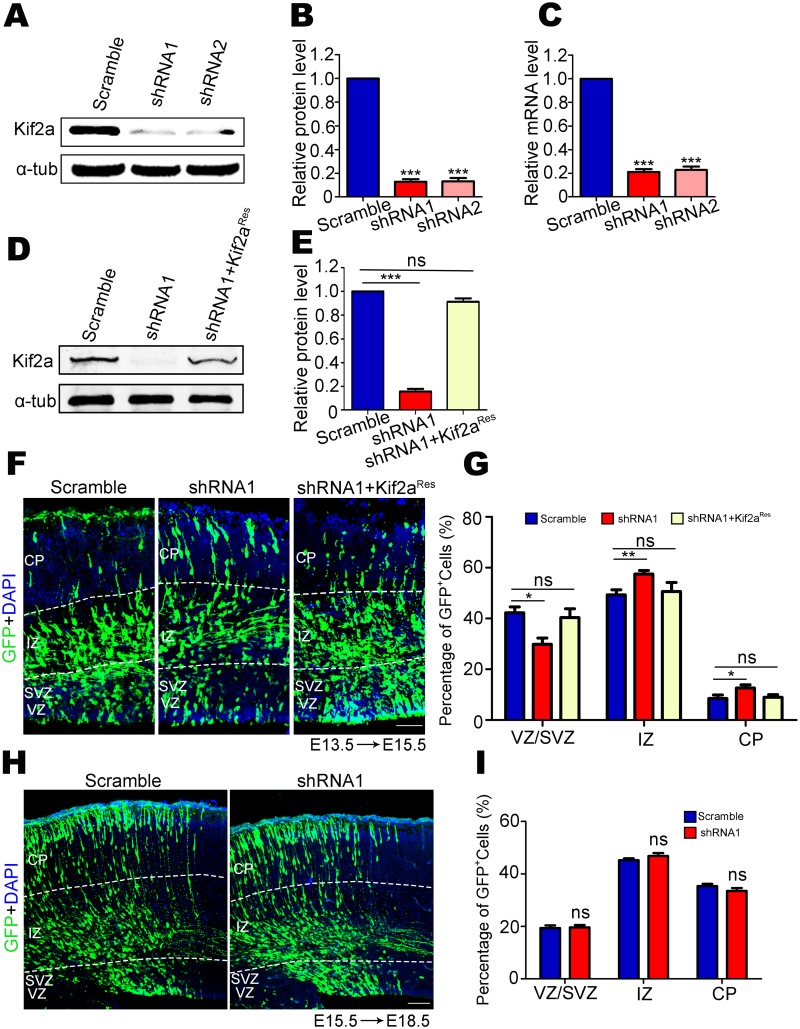
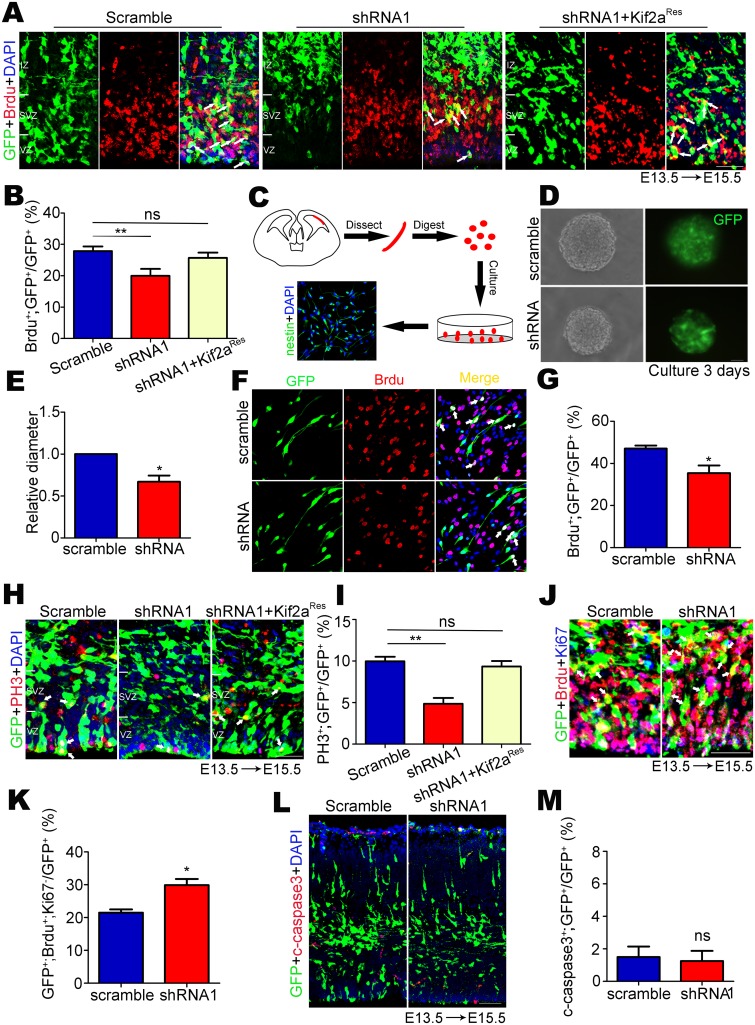
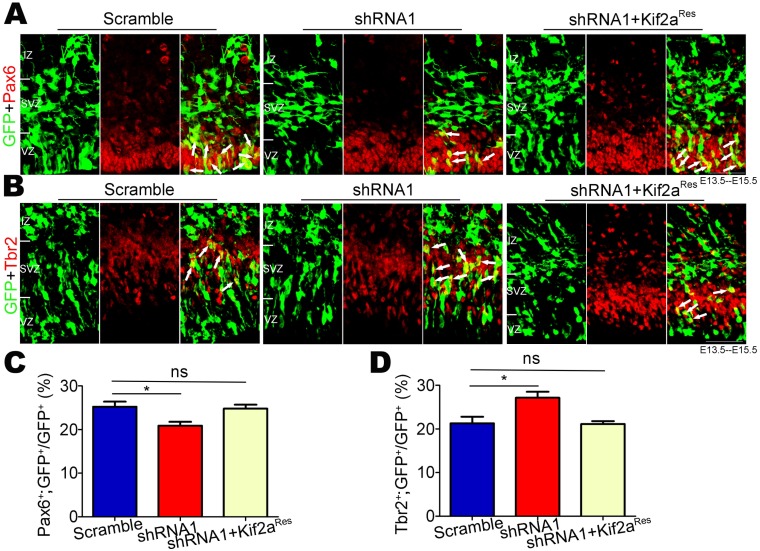
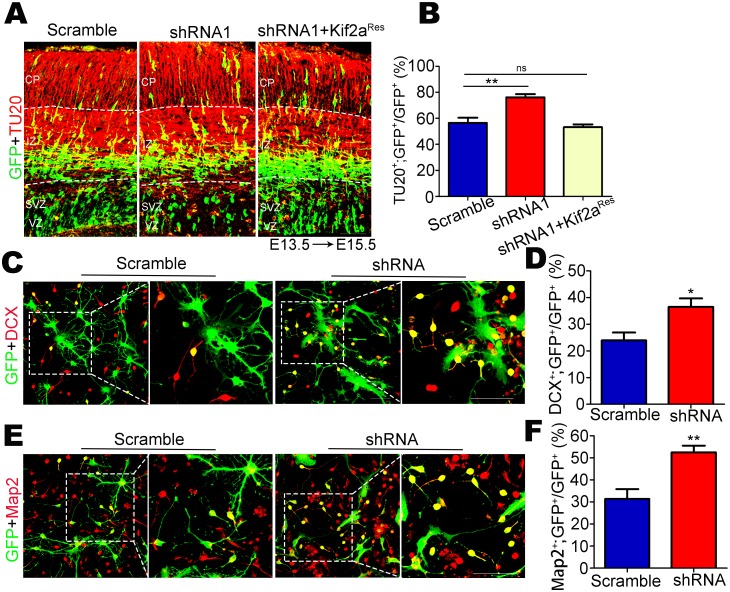
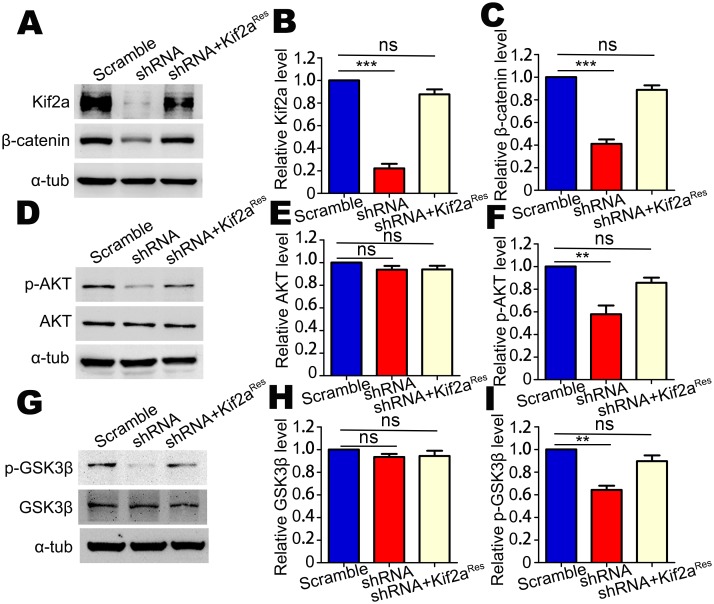
In the developing neocortex, cells in the ventricular/subventricular zone are largely multipotent neural stem cells and neural progenitor cells. These cells undergo self-renewal at the early stage of embryonic development to amplify the progenitor pool and subsequently differentiate into neurons. It is thus of considerable interest to investigate mechanisms controlling the switch from neural stem cells or neural progenitor cells to neurons. Here, we present evidence that Kif2a, a member of the Kinesin-13 family, plays a role in regulating the proliferation and differentiation of neural stem cells or neural progenitor cells at embryonic day 13.5. Silencing Kif2a by use of in utero electroporation of Kif2a shRNA reduced neural stem cells proliferation or self-renewal but increased neuronal differentiation. We further found that knockdown of Kif2a decreased the protein level of β-catenin, which is a critical molecule for neocortical neurogenesis. Together, these results reveal an important function of Kif2a in embryonic neocortical neurogenesis.


Conflict of interest statement

Competing Interests: The authors have declared that no competing interests exist.

Figures

Fig 1
Fig 1. Expression and distribution of Kif2a in developing cortex.
(A) Western blot and quantitative analysis of Kif2a protein levels at different developmental stages. (B) Immunostaining of E13.5, E15.5 and E17.5 brain slices. Kif2a (green) is expressed throughout the whole neocortex at E13.5; however, at E15.5 and E17.5, it is highly expressed in the IZ and CP and weakly detected in VZ/SVZ. IZ, intermediate zone; CP, cortical plate. Scale bars = 50 μm. (C) Quantitative analysis of the fluorescence intensity of Kif2a (green) immunostaining in different regions of neocortex. **P < 0.01, ***P < 0.001, ns = no significant difference; one-way ANOVA followed by Bonferroni post-hoc test. Data are presented as the mean ± SEM. (D) Kif2a (green) is co-expressed with nestin-positive NSCs/NPCs (red) in the VZ/SVZ at E13.5. Scale bars = 40 μm.
Fig 2
Fig 2. Knockdown Kif2a in E13.5 cortical NSCs/NPCs impaired the neocortical localization of newborn cells.
(A) Western blot analysis of Kif2a expression in lysates of NLT cells transfected with scramble shRNA or Kif2a shRNAs. (B) Quantitative analysis of Western blot data in A. n = 3 per group. ***P < 0.001; one-way ANOVA followed by Bonferroni post-hoc test. Data are presented as the mean ± SEM. (C) Quantitative analysis of real-time PCR data for relative mRNA level in NLT cells transfected with scramble shRNA or Kif2a shRNAs. n = 3 per group. ***P < 0.001; one-way ANOVA followed by Bonferroni post-hoc test. Data are presented as the mean ± SEM. (D) Western blot analysis of Kif2a expression in lysates of NLT cells transfected with different plasmids (scramble shRNA, Kif2a shRNA1 or Kif2a shRNA1+Kif2aRes). (E) Quantitative analysis of Western blot data in D. n = 3 per group. ***P < 0.001; ns = no significant difference; one-way ANOVA followed by Bonferroni post-hoc test. Data are presented as the mean ± SEM. (F) Mouse embryos were electroporated with the indicated plasmids (scramble shRNA, Kif2a shRNA1 or Kif2a shRNA1+Kif2aRes) at E13.5 and analyzed at E15.5. GFP (green) represents cells expressing the indicated plasmids. Scale bars = 50 μm. (G) Quantitative analysis of the location of newborn cells in different regions of the neocortex. n = 800–1000 cells from three different brains. *P < 0.05, **P < 0.01, ns = no significant difference; one-way ANOVA followed by Bonferroni post-hoc test. Data are presented as the mean ± SEM. (H) Mouse embryos were electroporated with scramble shRNA or Kif2a shRNA1 at E15.5 and then analyzed at E18.5. GFP (green) represents cells expressing the indicated plasmids. Scale bars = 50 μm. (I) Quantitative analysis of the localization of newborn cells in different regions of neocortex. n = 600–800 cells from three different brains. ns = no significant difference; Student’s t-test. Data are presented as the mean ± SEM.
Fig 3
Fig 3. Kif2a regulated the proliferation or self-renewal of NSCs/NPCs in vivo and in vitro.
(A) Indicated plasmids (scramble shRNA, Kif2a shRNA1 or Kif2a shRNA1+Kif2aRes) were introduced into E13.5 neocortex via in utero electroporation in vivo. Scale bars = 50 μm. (B) Quantitative analysis of the percentage of GFP+;Brdu+ cells among total GFP+ cells showed that Kif2a deficiency impaired the Brdu incorporation of NSCs/NPCs in vivo. n = 800–1000 cells from three different brains. **P < 0.01; ns = no significant difference; one-way ANOVA followed by Bonferroni post-hoc test. Data are presented as the mean ± SEM. (C) Schematic drawing showed the isolation of NSC/NPCs from E13.5 neocortex. (D) The NSCs/NPCs were transfected with lentivirus expressing scramble shRNA or Kif2a shRNA for 3 days. GFP (green) indicated the transfected cells. Scale bars = 50 μm. (E) Quantification of neurospheres size after transfection with scramble shRNA or Kif2a shRNA. n > 100 neurospheres from 3 different experiments. *P < 0.05; Student’s t-test. Data are presented as the mean ± SEM. (F) Cultured NSCs/NPCs were labeled with Brdu for 6 h. Scale bars = 10 μm. (G) Quantification of the percentage of GFP+;Brdu+ among total GFP+ cells showed that knocking down Kif2a inhibited the proliferation of NSCs/NPCs in vitro. n = 1300–1500 cells from 4 different experiments. *P < 0.05; Student’s t-test. Data are presented as the mean ± SEM. (H) Immunostaining of GFP (green) and PH3 (red) of E15.5 neocortex. Scale bars = 50 μm. (I) Quantification of the percentage of GFP+; PH3+ among total GFP+ cells. n = 800–1000 cells from 3 different brains. **P < 0.01, ns = no significant difference; one-way ANOVA followed by Bonferroni post-hoc test. Data are presented as the mean ± SEM. (J) E13.5 embryos were electroporated with scramble shRNA or Kif2a shRNA1, and E15.5 brains with a 24 h Brdu labeling were co-immunostained for GFP (green), Brdu (red) and Ki67 (blue). Scale bars = 50 μm. (K) Quantification of the percentage of GFP+; Brdu+; Ki67- among total GFP+ cells in the VZ and SVZ. n = 600–800 cells from 3 different brains *P < 0.05; Student’s t-test. Data are presented as the mean ± SEM. (L) Immunostaining of GFP (green) and c-caspase3 (red) of E15.5 neocortex. Scale bars = 50 μm. (M) Quantification of the percentage of GFP+; c-caspase3+ cells among total GFP+ cells. n = 4 different brains. ns = no significant difference; Student’s t-test. Data are presented as the mean ± SEM.
Fig 4
Fig 4. Kif2a regulates the switch of NSCs/NPCs from proliferation to differentiation.
(A-B) Indicated plasmids (scramble shRNA, Kif2a shRNA1 or Kif2a shRNA1+Kif2aRes) were introduced into E13.5 neocortex via in utero electroporation, and electroporated brain slices were co-immunostained for GFP (green) with Pax6 (red) or Tbr2 (red) at E15.5. Scale bars = 50 μm. (C-D) Quantification of the percentages of GFP+;Pax6+ or GFP+;Tbr2+ among total GFP+ cells. n = 300–500 cells from three different brains. *P < 0.05, **P < 0.01, ns = no significant difference; one-way ANOVA followed by Bonferroni post-hoc test. Data are presented as the mean ± SEM.
Fig 5
Fig 5. Kif2a is involved in the differentiation of NSCs/NPCs.
(A) Mouse embryos were electroporated with indicated plasmids (scramble shRNA, Kif2a shRNA1 or Kif2a shRNA1+Kif2aRes) at E13.5, and analyzed at E15.5. GFP (green) represents cells expressing the indicated plasmids; TU20 (red) represents immature neurons. Scale bars = 50 μm. (B) Quantitative analysis of the percentage of GFP+;TU20+ cells among the total GFP+ cells showed that more GFP-labeled TU20+ neurons were located in IZ and CP layers after knockdown of Kif2a. n = 800–1000 cells from three different brains. **P < 0.01, ns = no significant difference; one-way ANOVA followed by Bonferroni post-hoc test. Data are presented as the mean ± SEM. (C, E) Cultured NSCs/NPCs transfected with lentivirus expressing scramble shRNA or Kif2a shRNA were incubated in differentiation medium for 3 days. Co-immunostaining for GFP (green) with the neuronal marker DCX (red) in (C) or Map2 (red) in (E). Scale bars = 50 μm. (D, F) Quantification of the percentage of GFP+;DCX+ or GFP+;Map2+ cells among total GFP+ cells showed that knocking down Kif2a increased the number of newborn neurons. n = 600–800 cells from three different experiments. *P < 0.05; **P < 0.01; Student’s t-test. Data are presented as the mean ± SEM.
Fig 6
Fig 6. The expression of β-catenin, GSK3β, p-GSK3β, AKT, and p-AKT in NSCs/NPCs after Kif2a knockdown.
(A) Western blot analysis of the Kif2a and β-catenin levels in lysates of NSCs transfected with indicated plasmids (scramble shRNA, Kif2a shRNA or Kif2a shRNA+Kif2aRes). (B-C) Quantitative analysis of the Western blot data in A. n = 3 per group. ***P < 0.001; ns = no significant difference; one-way ANOVA followed by Bonferroni post-hoc test. Data are presented as the mean ± SEM. (D) Western blot analysis of the AKT and p-AKT levels in lysates of NSCs transfected with indicated plasmids (scramble shRNA, Kif2a shRNA or Kif2a shRNA+Kif2aRes). (E-F) Quantitative analysis of the Western blot data in D. n = 3 per group. **P < 0.01; ns = no significant difference; one-way ANOVA followed by Bonferroni post-hoc test. Data are presented as the mean ± SEM. (G) Western blot analysis of the GSK3β and p-GSK3β levels in lysates of NSCs transfected with indicated plasmids (scramble shRNA, Kif2a shRNA or Kif2a shRNA+Kif2aRes). (H-I) Quantitative analysis of the Western blot data in G. n = 3 for each. **P < 0.01; ns = no significant difference; one-way ANOVA followed by Bonferroni post-hoc test. Data are presented as the mean ± SEM.

Similar articles

Cited by

References

    1. Bradley A (1990) Embryonic stem cells: proliferation and differentiation. Curr Opin Cell Biol 2: 1013–1017. - PubMed
    1. Abranches E, Silva M, Pradier L, Schulz H, Hummel O, et al. (2009) Neural differentiation of embryonic stem cells in vitro: a road map to neurogenesis in the embryo. PLoS One 4: e6286 10.1371/journal.pone.0006286 - DOI - PMC - PubMed
    1. Ju XD, Guo Y, Wang NN, Huang Y, Lai MM, et al. (2014) Both Myosin-10 isoforms are required for radial neuronal migration in the developing cerebral cortex. Cereb Cortex 24: 1259–1268. 10.1093/cercor/bhs407 - DOI - PubMed
    1. Yu H, Wang N, Ju X, Yang Y, Sun D, et al. (2012) PtdIns (3,4,5) P3 recruitment of Myo10 is essential for axon development. PLoS One 7: e36988 10.1371/journal.pone.0036988 - DOI - PMC - PubMed
    1. McConnell SK (1995) Constructing the cerebral cortex: neurogenesis and fate determination. Neuron 15: 761–768. - PubMed

LinkOut - more resources