

Continued decline in blood collection and transfusion in the United States-2015
- PMID: 28591469
- PMCID: PMC5556921
- DOI: 10.1111/trf.14165
Continued decline in blood collection and transfusion in the United States-2015
Abstract
Background: In 2011 and 2013, the National Blood Collection and Utilization Survey (NBCUS) revealed declines in blood collection and transfusion in the United States. The objective of this study was to describe blood services in 2015.
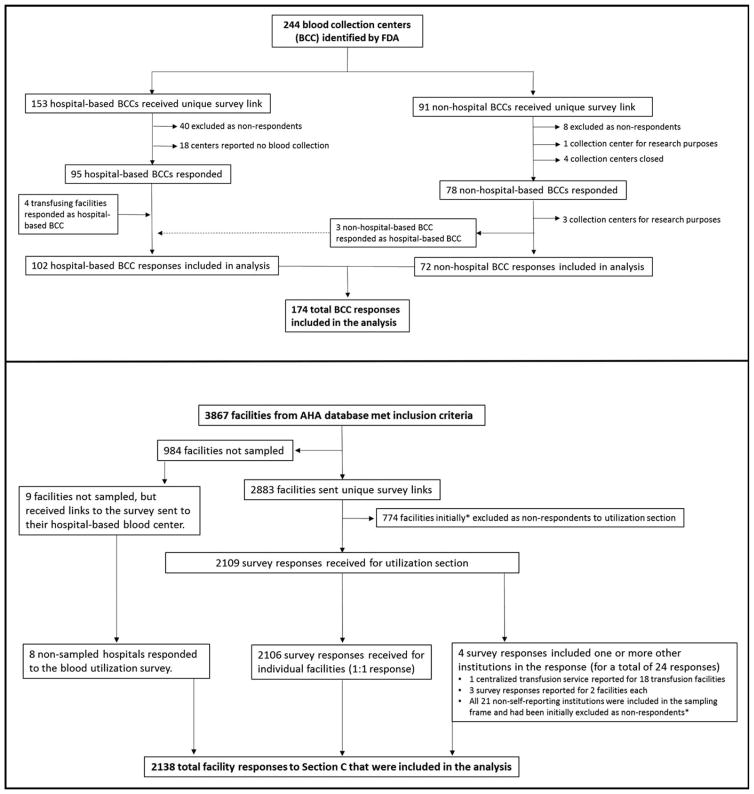
Study design and methods: The 2015 NBCUS was distributed to all US blood collection centers, all hospitals performing at least 1000 surgeries annually, and a 40% random sample of hospitals performing 100 to 999 surgeries annually. Weighting and imputation were used to generate national estimates for units of blood and components collected, deferred, distributed, transfused, and outdated.
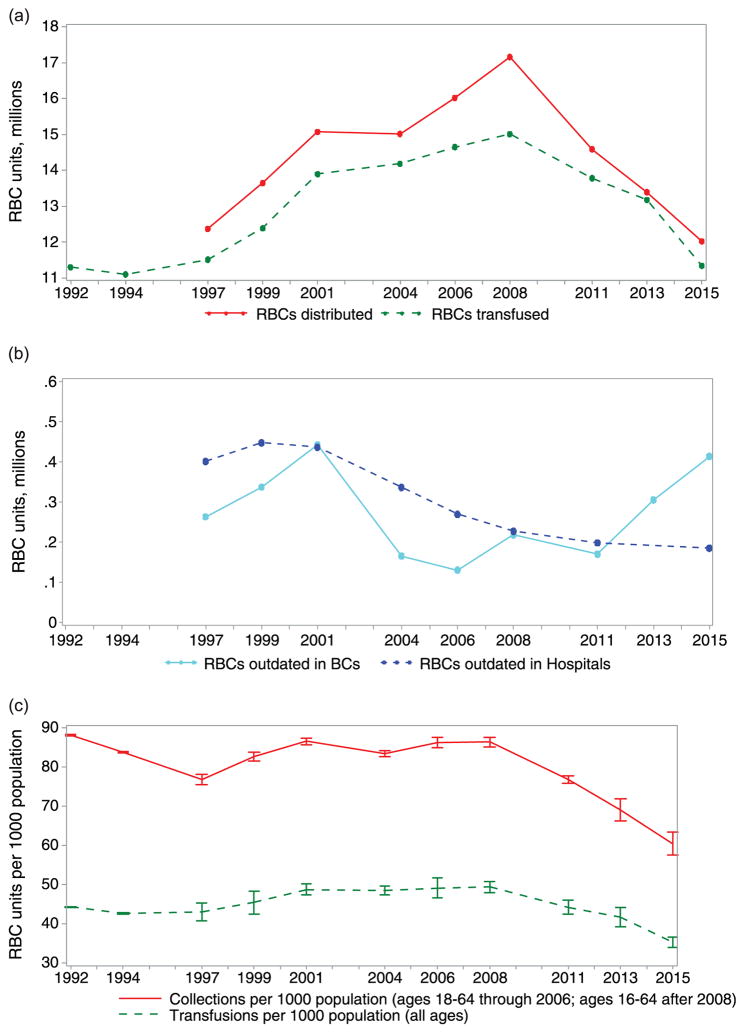
Results: Response rates for the 2015 NBCUS were 78.4% for blood collection centers and 73.9% for transfusing hospitals. In 2015, 12,591,000 units of red blood cells (RBCs) (95% confidence interval [CI], 11,985,000-13,197,000 units of RBCs) were collected, and 11,349,000 (95% CI, 10,592,000-11,747,000) were transfused, representing declines since 2013 of 11.6% and 13.9%, respectively. Total platelet units distributed (2,436,000; 95% CI, 2,230,000-2,642,000) and transfused (1,983,000; 95% CI, 1,816,000 = 2,151,000) declined by 0.5% and 13.1%, respectively, since 2013. Plasma distributions (3,714,000; 95% CI, 3,306,000-4,121,000) and transfusions (2,727,000; 95% CI, 2,594,000-2,859,000) in 2015 declined since 2013. The median price paid per unit in 2015-$211 for leukocyte-reduced RBCs, $524 for apheresis platelets, and $54 for fresh frozen plasma-was less for all components than in 2013.
Conclusions: The 2015 NBCUS findings suggest that continued declines in demand for blood products resulted in fewer units collected and distributed Maintaining a blood inventory sufficient to meet routine and emergent demands will require further monitoring and understanding of these trends.
© 2017 AABB.
Conflict of interest statement
Figures
References
-
- Surgenor DM, Wallace EL, Hao SH, et al. Collection and transfusion of blood in the United States, 1982–1988. N Engl J Med. 1990;322:1646–51. - PubMed
-
- Wallace EL, Surgenor DM, Hao HS, et al. Collection and transfusion of blood and blood components in the United States, 1989. Transfusion. 1993;33:139–44. - PubMed
-
- Wallace EL, Churchill WH, Surgenor DM, et al. Collection and transfusion of blood and blood components in the United States, 1992. Transfusion. 1995;35:802–12. - PubMed
-
- Wallace EL, Churchill WH, Surgenor DM, et al. Collection and transfusion of blood and blood components in the United States, 1994. Transfusion. 1998;38:625–36. - PubMed
-
- Sullivan MT, McCullough J, Schreiber GB, et al. Blood collection and transfusion in the United States in 1997. Transfusion. 2002;42:1253–60. - PubMed
MeSH terms
Grants and funding
LinkOut - more resources
Full Text Sources
Other Literature Sources
Medical
