. 2017 Jun 6;19(10):2005-2013.
doi: 10.1016/j.celrep.2017.05.041.

Phosphorylation of TXNIP by AKT Mediates Acute Influx of Glucose in Response to Insulin

Affiliations

Phosphorylation of TXNIP by AKT Mediates Acute Influx of Glucose in Response to Insulin

Althea N Waldhart et al. Cell Rep. .

Abstract

Growth factors, such as insulin, can induce both acute and long-term glucose uptake into cells. Apart from the rapid, insulin-induced fusion of glucose transporter (GLUT)4 storage vesicles with the cell surface that occurs in muscle and adipose tissues, the mechanism behind acute induction has been unclear in other systems. Thioredoxin interacting protein (TXNIP) has been shown to be a negative regulator of cellular glucose uptake. TXNIP is transcriptionally induced by glucose and reduces glucose influx by promoting GLUT1 endocytosis. Here, we report that TXNIP is a direct substrate of protein kinase B (AKT) and is responsible for mediating AKT-dependent acute glucose influx after growth factor stimulation. Furthermore, TXNIP functions as an adaptor for the basal endocytosis of GLUT4 in vivo, its absence allows excess glucose uptake in muscle and adipose tissues, causing hypoglycemia during fasting. Altogether, TXNIP serves as a key node of signal regulation and response for modulating glucose influx through GLUT1 and GLUT4.

Keywords: AKT; GLUT4; TXNIP; glucose; insulin.


Figures

Figure 1
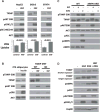
Figure 1. Growth Factor Caused Upshift in TXNIP Mobility on SDS-PAGE
(A) HepG2, SKBr3, and BT474 cells were serum-starved for 4 hr and then treated with the indicated growth factor for 15 min. Glucose uptake under the same conditions was measured using 3H-2deoxyglucose (2DG) (n = 3, mean ± SEM). (B) Differentiated 3T3L1 adipocytes were treated with insulin, and primary TXNIP WT and KO MEFs were treated with IGF for 15 min. (C) The AMPK WT and double-knockout (α1 and α2) MEFs were treated with either IGF or 2DG for 15 min after serum starvation. The upshift detected by total TXNIP antibody correlated with signals from the pTXNIPS308 antibody. While AMPK activation-induced TXNIP 308 phosphorylation can only be seen in WT MEFs, IGF-induced phosphorylation can be seen in both cell lines. (D) HepG2 cells were treated with HGF, 2DG, or HGF and 2DG for 15 min and probed with various antibodies.
Figure 2
Figure 2. AKT Phosphorylated TXNIP at S308 on the Plasma Membrane
(A) HepG2 cells were pretreated for 1 hr with various inhibitors before a 15 min stimulation by HGF: PI3K inhibitor BKM120 (1 μM), PDK1 inhibitor GSK2334470 (3μM), AKT inhibitors MD2206 (1 μM) and AZD5363 (1 μM), or SGK inhibitor GSK650394 (10 μM). (B) Live-cell confocal imaging of HepG2 cells stably express GFP-TXNIP WT or K233A/R238A mutant. (C) In vitro kinase assay using commercial GST-AKT (full-length) and His-TXNIP from bacteria. AKT phosphorylated TXNIP on S308 only in the presence of PIP3-containing liposomes without the AKT inhibitor AZD5363 (AZD). (D) HepG2 cells stably expressing HA-TXNIP WT, S308A, or K233A/R238A mutant were treated with HGF with or without MG132 (proteasome inhibitor) or MK2206 pretreatment. (E) SkBr3 cells stably expressing HA-TXNIP WT, S308A, or K233A/R238A mutant were treated with EGF with or without MK2206 pretreatment.
Figure 3
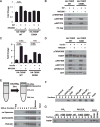
Figure 3. TXNIP Mediated AKT Activation-Induced Glucose Uptake in Cells
(A) Glucose uptake in TXNIP KO primary MEFs re-expressing HA-TXNIP WT or S308A mutant. Cells were either pretreated with control DMSO or 1 μM MK2206 for 1 hr, then treated with IGF for 15 min before adding 3H-2DG for 15 more min. Fold changes in WT and S308A cells were normalized to their respective controls (n = 3, mean ± SEM). (B) Western blots corresponding to the cells used in (A). (C) A TXNIP KO clone of 3T3L1 cells, generated using CRISPR technology, was differentiated into adipocytes and infected with virus to re-express HA-TXNIP WT or S308A. The glucose influx was measured by 3H-2DG uptake as in (A) (n = 3, mean ± SEM). (D) Western blots corresponding to cells used in (C). (E) Schematic of the liposome floatation assay and TXNIP western blot to show the top two fractions containing TXNIP floated with liposomes. An oversaturating amount of protein was used for these assays. (F) Top two fractions of liposome float assay testing the interaction between WT TXNIP protein and various phosphoinositide-containing liposomes. (G) Differential interaction between WT, P308 (protein phosphorylated on S308), and S308A mutant TXNIP with PI(4,5)P2- and PIP3-containing liposomes. The P308 protein shows characteristic upshift in the blots.
Figure 4
Figure 4. TXNIP Regulation of GLUT4
(A) GLUT4 endocytosis assay in WT 3T3 adipocytes (n= 3), TXNIP KO adipocytes (n= 3), and KO adipocytes transfected with TXNIP (n= 4). Rate lines ± SEM. The data were scaled to 15 min for KO. Internalization index (proportional to internalization rate constant) was calculated from the slope of rate lines. Averages ± SEM are shown. (B) Ratio of cell-surface GLUT4 to total-cellular GLUT4 in differentiated WT 3T3L1 and TXNIP KO adipocytes using the HA-GLUT4-GFP reporter under basal or 1 nM insulin stimulated (30 min) conditions (n = 9, means ± SEM). p value calculated using Student’s t test for (A) and (B). (C–F) Representative combined PET and CT (computed tomography) images of a WT and a KO mouse are normalized for visual comparison and displayed on identical color maps in Hounsfield units (HU) for CT data and standard uptake value (SUV) for PET data. The distribution of 18F-FDG uptake in skeletal muscle tissue (quadriceps femoris muscle) (D), epididymal white adipose tissue (E), and liver (F) are shown. The data are presented as percent injected dose per gram (percent ID/g horizontal lines and the error bars represent the mean ± SEM). (G) Blood glucose level after overnight fasting. For (D)–(G), data were analyzed via linear mixed-effects models with random intercepts for littermates (n = 6). All p values were false discovery rate (FDR)-corrected for multiple testing, and their respective FDR q-values are shown). (H) Western blot of skeletal muscle showing no change in GLUT4 expression between WT and KO animals before and after fasting.

References

    1. Al-Hasani H, Kunamneni RK, Dawson K, Hinck CS, Müller-Wieland D, Cushman SW. Roles of the N- and C-termini of GLUT4 in endocytosis. J Cell Sci. 2002;115:131–140. - PubMed
    1. Antonescu CN, Foti M, Sauvonnet N, Klip A. Ready, set, internalize: mechanisms and regulation of GLUT4 endocytosis. Biosci Rep. 2009;29:1–11. - PubMed
    1. Augustin R. The protein family of glucose transport facilitators: It’s not only about glucose after all. IUBMB Life. 2010;62:315–333. - PubMed
    1. Blot V, McGraw TE. GLUT4 is internalized by a cholesterol-dependent nystatin-sensitive mechanism inhibited by insulin. EMBO J. 2006;25:5648–5658. - PMC - PubMed
    1. Blot V, McGraw TE. Molecular mechanisms controlling GLUT4 intracellular retention. Mol Biol Cell. 2008a;19:3477–3487. - PMC - PubMed

Publication types

MeSH terms