. 2017 Jun 6;19(10):2026-2032.
doi: 10.1016/j.celrep.2017.05.040.

MicroRNA-Mediated Dynamic Bidirectional Shift between the Subclasses of Glioblastoma Stem-like Cells

Affiliations

MicroRNA-Mediated Dynamic Bidirectional Shift between the Subclasses of Glioblastoma Stem-like Cells

Arun K Rooj et al. Cell Rep. .

Abstract

Large-scale transcriptomic profiling of glioblastoma (GBM) into subtypes has provided remarkable insight into the pathobiology and heterogeneous nature of this disease. The mechanisms of speciation and inter-subtype transitions of these molecular subtypes require better characterization to facilitate the development of subtype-specific targeting strategies. The deregulation of microRNA expression among GBM subtypes and their subtype-specific targeting mechanisms are poorly understood. To reveal the underlying basis of microRNA-driven complex subpopulation dynamics within the heterogeneous intra-tumoral ecosystem, we characterized the expression of the subtype-enriched microRNA-128 (miR-128) in transcriptionally and phenotypically diverse subpopulations of patient-derived glioblastoma stem-like cells. Because microRNAs are capable of re-arranging the molecular landscape in a cell-type-specific manner, we argue that alterations in miR-128 levels are a potent mechanism of bidirectional transitions between GBM subpopulations, resulting in intermediate hybrid stages and emphasizing highly intricate intra-tumoral networking.

Keywords: Polycomb repressive complex; chromatin; exosomes; glioblastoma; heterogeneity; microRNA; non-coding RNA; stem cells; subtype transition.


Conflict of interest statement

The authors have declared no conflict of interest.

Figures
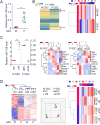
Figure 1
Figure 1. MiR-128 expression drives GSC subtype shift
A. MiR-128 is diversely expressed in GSC subclasses. QPCR analysis of mature miR-128 in GSCs (n=8). Data shown as mean ± SD (** p <0.001). B. Putative miR-128 targets are diversely expressed in GSCs subclasses. 5666 putative miR-128 target genes were assessed based on the value of expression. (p <0.05, fold >2 cutoff is indicated) (left). The expression of miR-128 putative target genes in GSCs stratifies P from M GSCs (n=3). Targets significantly deregulated in M GSCs (n = 569) and P GSCs (n = 741) were queried with a gene signature retrieved from TCGA and identified by clustering with subtype prediction (classical – C, blue; mesenchymal – M, red; proneural – P, magenta; neural – N, green) (right). C. Engineered GSCs with overexpression and knock-down of miR-128. QPCR analysis of mature miR-128 in GSCs (n=3). Data shown as ± SD, (**p<0.001) (left). Deregulation of miR-128 in GSCs shifts subtype-specific gene signature. QPCR analysis of subtype-specific 10-gene signatures in M GSCs (middle) and P GSCs (right). Data are shown as a heat map with cell and gene clustering. NC – negative control (empty pCDH), 128 – overexpression of miR-128 (pCDH-miR-128), aNC – negative control (empty MIR-ZIP), a128 – knockdown of miR-128 (MIR-ZIP-anti-miR-128). D. Deregulation of miR-128 shifts GSC transcriptome clustering. Gene microarray analysis of 3017 genes significantly (p <0.05, fold >2) deregulated in GSCs (n=3) in a miR-128-dependent fashion. Data are shown as a heat map with cell clustering (left) and as a PCA analysis (middle). The expression of genes deregulated by miR-128 in GSCs results in a transitional signature resembling the classical subtype. Targets significantly deregulated in M and P GSC (n = 3017) were queried with a gene signature retrieved from TCGA and identified by clustering with subtype prediction (n= 485, overall error rate >0.05) (classical – C, blue; mesenchymal – M, red; proneural – P, magenta; neural – N, green) (right).
Figure 2
Figure 2. PRC complex proteins and their effectors are miR-128-dependent controllers of GSC subtype shift
A. MiR-128 deregulation affects expression of PRCs, their chromatin marks, and PRC-dependent genes in GSCs. Western blot analysis of selected factors in control and miR-128 de-regulated GSCs (n=3). B. Expression of PRC-dependent genes is shifted by miR-128. Microarray platform analysis of a 30 PRC-dependent gene signature in control and miR-128 de-regulated GSCs. Data are shown as a heat map with cell and gene clustering (n=3). C. Expression of PRC-dependent genes is diversely shifted by Bmi1/Suz12 knockdown and miR-128. Microarray platform analysis of a 30 PRC-dependent gene signature in control, miR-128-overexpressing and Bmi1/Suz12 siRNA-transfected M GSCs. Data are shown as a heat map with cell and gene clustering (n=3). D. Bmi1/Suz12 knockdown deregulates the GSC transcriptome in a subtype-dependent manner. Gene microarray analysis of genes significantly (p <0.05, fold >2) deregulated in GSCs in a Bmi1/Suz12-dependent fashion (n=3). Data are shown as a heat map with cell and gene clustering (left) and as a PCA analysis (middle). The expression of genes deregulated by Bmi1/Suz12 knockdown in M GSCs results in a transitional signature resembling the classical subtype. Genes significantly deregulated in M and P GSC (n=937) were queried with a gene signature retrieved from TCGA and identified by clustering with subtype prediction (n=380, overall error rate >0.05) (classical – C, mesenchymal – M, proneural – P, neural – N) (right).
Figure 3
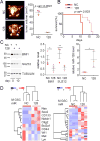
Figure 3. MiR-128 mitigates the aggressive phenotype of M GSCs both in vivo and in vitro
A. MiR-128 overexpression reduces M GSC tumor burden. MRI imaging (left) (scale bar: 2.5 mm); and tumor volume quantification (right) (n=3). Data as mean ± SD. **p<0.01. B. MiR-128 overexpression in M GSC tumors is associated with prolonged survival. Median survival: M GSC control = 11 days, M GSC miR-128 = 16 days. N = 8 mice per group. C. MiR-128 targets PRCs’ components in vivo. Western blot analysis of M GSC cells (day 0) and in M GSC tumors (day 10) (left). Western blot quantification (middle, n = 3) and qPCR analysis of miR-128 expression in tumors (day 10, right, n = 3). Data as mean ± SD, *p< 0.05, **p<0.01. D. MiR-128 overexpression shifts subtype-specific gene signature in vivo. QPCR analysis of a 10-gene subtype-specific signature in M GSC tumors (left). MiR-128 overexpression shifts the expression of PRC-dependent genes in vivo. Microarray platform analysis of a 30 PRC-gene signature in M GSC tumors (n=3). Data as a heat map with cell/gene clustering (right).
Figure 4
Figure 4. Targets of miR-128 and miR-128-dependent PRC associated genes predict patient outcome in GBM subtypes
A. MiR-128 knockdown in P GSC tumors is associated with shorter survival. Micrographs of tumors (left) and survival (right) are shown. N = 4 or 5 mice per group; average survival: P GSC control: 168 days, P GSC amiR-128: 143 days, scale bar: 1 mm (upper), and 200 µm (lower). B. Expression of miR-128 affects the survival of heterogeneous GSC-originated tumors. Micrographs of tumors (left) and survival (right) are shown. N = 4 mice per group; average survival: M GSC miR-128/P GSC control: 19 days, M GSC miR-128/P GSC amiR-128: 9 days, scale bar: 500 µm (upper), and 50 µm (lower). C. MiR-128-dependent transcriptome separates patients’ survival prediction. Genes deregulated in GSCs queried with TCGA gene signature were identified by clustering with class (top bar) and subtype (bottom bar) (left), miR-128 deregulated target genes (middle; value of expression, p <0.05, fold >2, n = 43) and class survival prediction (right). D. MiR-128 deregulation in M GSCs and P GSCs shifts the transcriptome towards a transitional hybrid classical-like subtype.

References

    1. Bhat KP, Balasubramaniyan V, Vaillant B, Ezhilarasan R, Hummelink K, Hollingsworth F, Wani K, Heathcock L, James JD, Goodman LD, et al. Mesenchymal differentiation mediated by NF-kappaB promotes radiation resistance in glioblastoma. Cancer cell. 2013;24:331–346. - PMC - PubMed
    1. Bian EB, Li J, He XJ, Zong G, Jiang T, Li J, Zhao B. Epigenetic modification in gliomas: role of the histone methyltransferase EZH2. Expert opinion on therapeutic targets. 2014;18:1197–1206. - PubMed
    1. Bracken AP, Dietrich N, Pasini D, Hansen KH, Helin K. Genome-wide mapping of Polycomb target genes unravels their roles in cell fate transitions. Genes & development. 2006;20:1123–1136. - PMC - PubMed
    1. Bracken AP, Helin K. Polycomb group proteins: navigators of lineage pathways led astray in cancer. Nature reviews Cancer. 2009;9:773–784. - PubMed
    1. Bronisz A, Wang Y, Nowicki MO, Peruzzi P, Ansari KI, Ogawa D, Balaj L, De Rienzo G, Mineo M, Nakano I, et al. Extracellular vesicles modulate the glioblastoma microenvironment via a tumor suppression signaling network directed by miR-1. Cancer research. 2014;74:738–750. - PMC - PubMed

Publication types