. 2017 Jun 6;19(10):2074-2087.
doi: 10.1016/j.celrep.2017.05.033.

Sonic Hedgehog Activates Phospholipase A2 to Enhance Smoothened Ciliary Translocation

Affiliations

Sonic Hedgehog Activates Phospholipase A2 to Enhance Smoothened Ciliary Translocation

Angela M Arensdorf et al. Cell Rep. .

Abstract

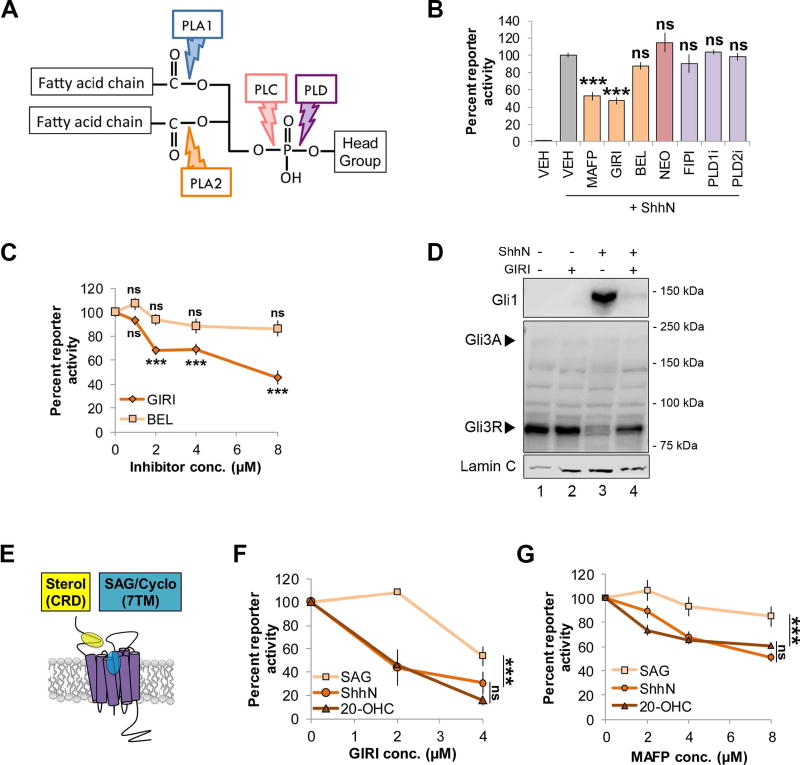
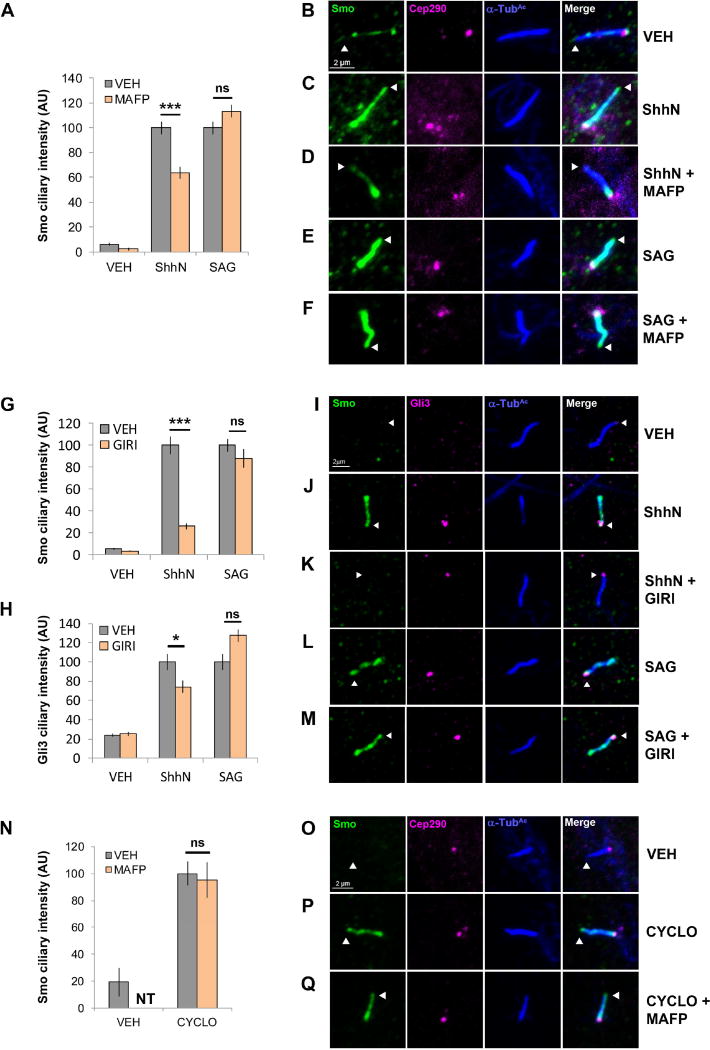
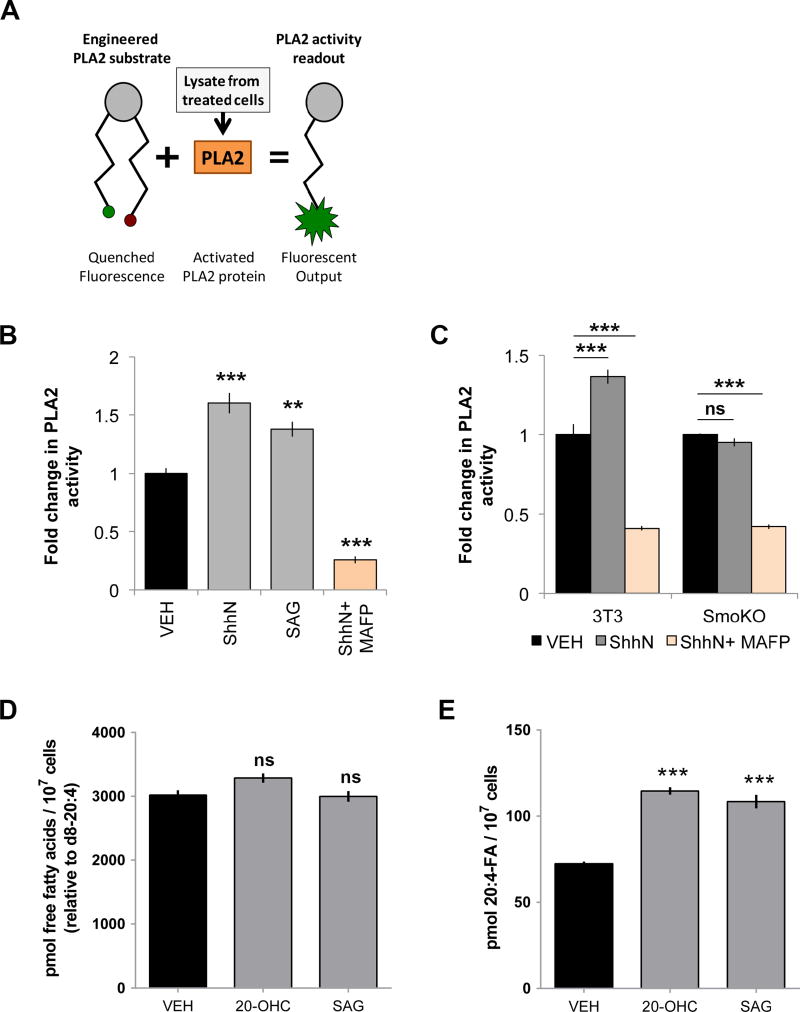
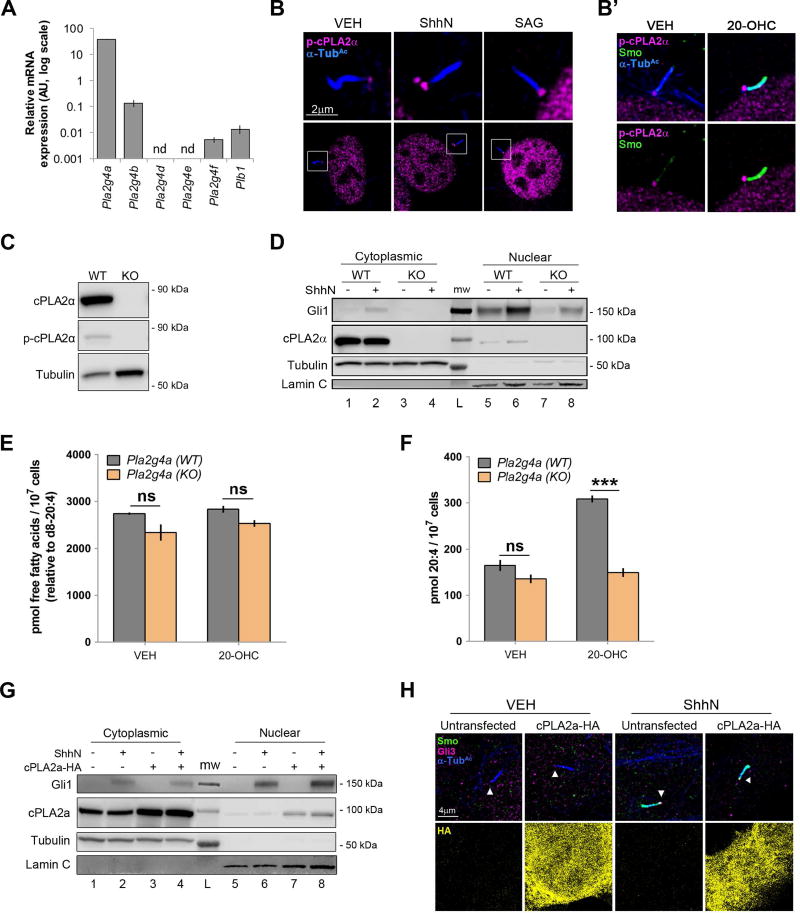
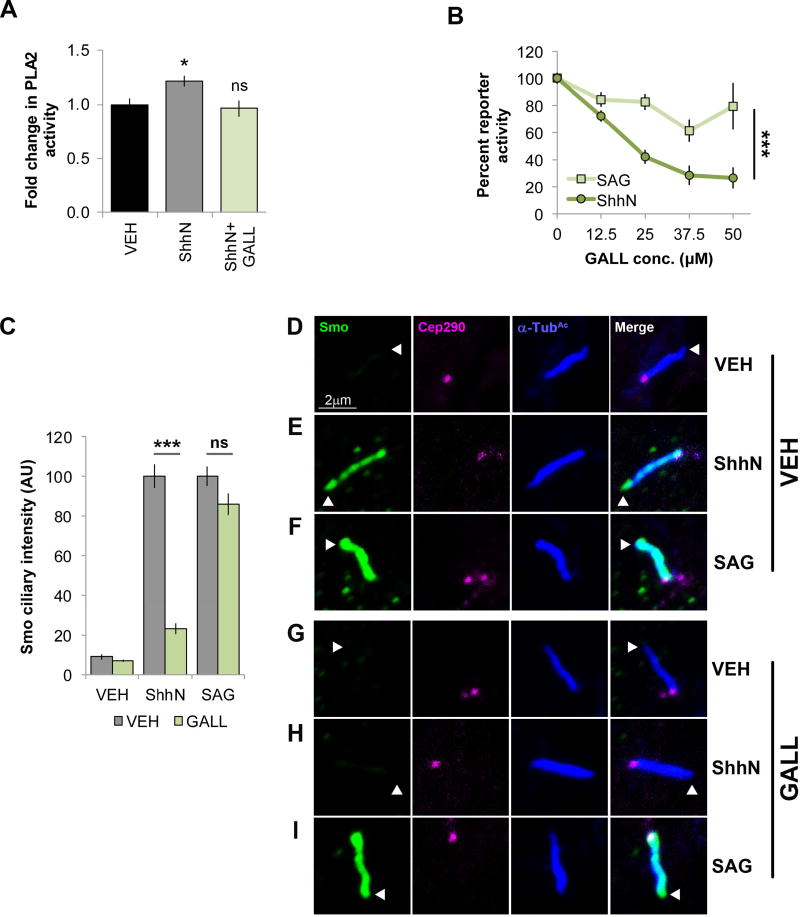
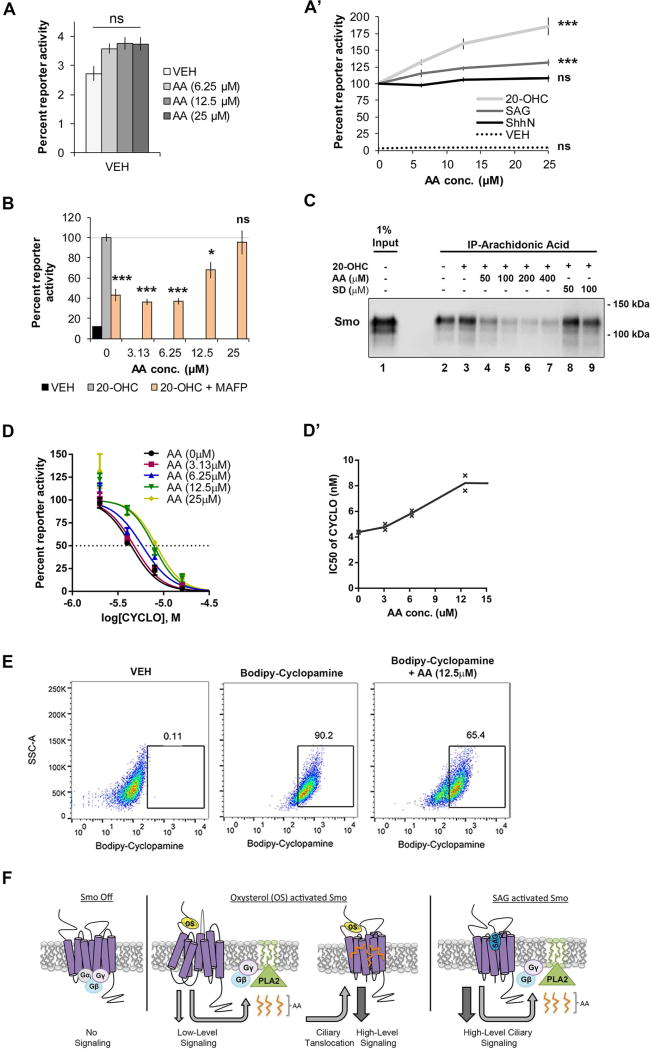
The G protein-coupled receptor Smoothened (Smo) is the signal transducer of the Sonic Hedgehog (Shh) pathway. Smo signals through G protein-dependent and -independent routes, with G protein-independent canonical signaling to Gli effectors requiring Smo accumulation in the primary cilium. The mechanisms controlling Smo activation and trafficking are not yet clear but likely entail small-molecule binding to pockets in its extracellular cysteine-rich domain (CRD) and/or transmembrane bundle. Here, we demonstrate that the cytosolic phospholipase cPLA2α is activated through Gβγ downstream of Smo to release arachidonic acid. Arachidonic acid binds Smo and synergizes with CRD-binding agonists, promoting Smo ciliary trafficking and high-level signaling. Chemical or genetic cPLA2α inhibition dampens Smo signaling to Gli, revealing an unexpected contribution of G protein-dependent signaling to canonical pathway activity. Arachidonic acid displaces the Smo transmembrane domain inhibitor cyclopamine to rescue CRD agonist-induced signaling, suggesting that arachidonic acid may target the transmembrane bundle to allosterically enhance signaling by CRD agonist-bound Smo.

Keywords: Smoothened; Sonic Hedgehog; arachidonic acid; phospholipase A2; primary cilium; signal transduction.


Conflict of interest statement

The authors declare no conflicts of interest.

Figures

Figure 1
Figure 1
cPLA2 inhibitors modulate Shh signaling. For all panels, *** indicates p ≤ 0.0001; ns, p > 0.05. Error bars indicate standard error of the mean (SEM). A. Schematic of a phospholipid showing phospholipase hydrolysis sites. B. Light2 reporter cells were pretreated with PLA2 inhibitors (MAFP (5 µM), GIRI (5 µM) and BEL (5 µM); orange), PLC inhibitor NEO (200 µM; pink) or PLD inhibitors (FIPI (40 nM), PLD1i (40 nM) and PLD2i (40 nM); purple) prior to stimulation with ShhN conditioned media. Statistical significance was determined using a one-way ANOVA. C. Light2 cells were pretreated with cPLA2 inhibitor (GIRI, diamond) or iPLA2 inhibitor (BEL, square) prior to ShhN conditioned media treatment. Statistical significance was determined using a two-way ANOVA. D. NIH3T3 cells were pretreated with GIRI (4 µM) prior to stimulation with ShhN conditioned media. Gli1 and Gli3 protein levels were analyzed in nuclear fractions by western blot. The experiment was performed twice. A representative blot is shown. Arrowheads indicate Gli3 activator and repressor species. Lamin C is the nuclear marker. E. Diagram of Smo ligand binding pockets. F–G. Light2 cells were pretreated with GIRI or MAFP prior to SAG (100 nM, square), 20-OHC (10 µM, triangle) or ShhN conditioned media (circle). Statistical significance was determined using a two-way ANOVA. For all experiments involving Light2 cells, Gli-luciferase reporter activity was normalized to tk-renilla control and expressed relative to the agonist-stimulated control. PL inhibitors were added 2 hours prior to agonist for pretreatment. Assays were repeated a minimum of three times in triplicate and all data pooled.
Figure 2
Figure 2
cPLA2 influences ShhN-, but not SAG-induced Smo ciliary translocation. For all panels *** indicates p ≤ 0.0001; * indicates p ≤ 0.05; ns indicates p > 0.05; nt, not tested. Error bars indicate SEM. A–M. NIH3T3 cells pretreated with MAFP (5 µM) or GIRI (5 µM) were stimulated with ShhN conditioned media or SAG (100 nM) and imaged by immunofluorescence confocal microscopy. Ciliary tips are indicated by arrowheads. Smo and/or Gli3 signal in primary cilia was quantified by counting ≥100 cells over a minimum of 2 experiments. Significance indicated in A, G and H was calculated based upon total cell number analyzed using a two-way ANOVA. N–Q. Smo localization was quantified as above in NIH3T3 cells treated with cyclopamine (10 µM) +/− MAFP (5 µM). Significance was determined using a two-tailed Student’s t-test. For all cilia shown, Smo is green, Gli3 is magenta, the ciliary marker acetylated α-tubulin is blue and the ciliary base marker Cep290-GFP is magenta.
Figure 3
Figure 3
PLA2 is activated in a Smoothened-dependent manner. For all panels *** indicates p ≤ 0.0001; ** indicates p ≤ 0.001; ns indicates p > 0.05. Error bars indicate SEM. A. PLA2 activity assay diagram. B–C. Lysates were prepared from NIH3T3 or Smo−/− MEFs treated with ShhN conditioned media or SAG (100nM) +/− MAFP (5 µM). Results are represented as fold activity change relative to vehicle. The experiment was repeated four times in duplicate and all data pooled. Significance relative to vehicle controls were determined using a one-way ANOVA (B) or two-way ANOVA (C). D–E. Total fatty acid pool in treated and untreated cells was calculated from the sum of individual fatty acids quantified using the d8-20:4 internal standard. E. Absolute levels of 20:4 were determined using mass spectrometry with d8-20:4 internal standard. The experiment was conducted four times and all data pooled. Significance was determined using a one-way ANOVA.
Figure 4
Figure 4
cPLA2α contributes to Smo signaling. For all panels *** indicates p ≤ 0.0001; ns indicates p > 0.05; nd, not detected. Error bars indicate SEM. A. RNA was harvested from NIH3T3 cells and analyzed for expression of cPLA2 genes by qRT-PCR. Analysis was performed three times in triplicate and all results pooled. B–B’. Cells were immunostained using antibody against active phospho-cPLA2α. Images are representative of ~200 cells analyzed over two independent experiments. B’ shows Smo and cPLA2α localization overlay with α-Tub c (top) and without (bottom). C. Western blot of cPLA2α in Pla2g4a wild type and knockout MEFs using total and phospho-specific antibodies. Tubulin is the loading control. D. Western blot of cytoplasmic and nuclear extracts from control and cPLA2α knockout MEFs. Loading controls are Tubulin (cytoplasmic) and Lamin C (nuclear). The experiment was repeated 3 times, a representative blot is shown. E–F. Fatty acid quantification in Pla2g4a wild type and knockout MEFs. The total fatty acid pool 20:4 absolute level was calculated as in Fig. 3D–E. The experiment was performed four times and all data pooled. Significance was determined using a two-way ANOVA. G. NIH3T3 cells were transfected with pCDNA-cPLA2αHA in the absence and presence of ShhN conditioned media. Gli1 protein was analyzed by immunoblot. Tubulin and Lamin C are the cytoplasmic and nuclear loading controls. The experiment was performed twice. A representative blot is shown. H. NIH3T3 cells were transfected with pCDNA-cPLA2αHA (yellow) and stimulated with control (VEH) or ShhN conditioned media. Cilia were examined for Smo (green) and Gli3 (magenta) ciliary localization. Acetylated α tubulin is blue. Arrowhead marks the ciliary tip. Due to excessive signal, HA was split from overlay and is shown below. Approximately 200 cells were analyzed over two independent experiments. Representative cells are shown.
Figure 5
Figure 5
Smoothened activates cPLA2α through Gβγ. For all experiments * indicates p ≤ 0.05; *** indicates p ≤ 0.0001; ns, p > 0.05. Error bars indicate SEM. A. PLA2 activity assays were performed on lysates from NIH3T3 cells stimulated with ShhN conditioned media in the presence or absence of Gβγ inhibitor GALL (25 µM). Results are shown as fold change in activity relative to vehicle control. The experiment was performed three times in triplicate and all data pooled. Significance was determined using a one-way ANOVA. B. Light2 cells were treated with ShhN conditioned media or SAG (100 nM) +/− GALL as indicated. Normalized percent reporter activity is expressed relative to the agonist-stimulated condition set to 100%. The experiment was performed three times in triplicate and all data pooled. Significance was determined using a two-way ANOVA. C. Cells were treated with ShhN conditioned media or SAG (100 nM) +/− GALL (25 µM) as indicated. Smo localization was analyzed in ≥100 cells across two experiments by immunofluorescence confocal microscopy and ciliary signal intensity was quantified. Significance was calculated based upon number of cells using a two-way ANOVA. D–I. Representative images for each condition are shown. Primary cilia are marked by acetylated α-tubulin (α-Tub c, blue) and the base indicated by Cep290-GFP (magenta). Smo is green.
Figure 6
Figure 6
Arachidonic acid binds Smo and synergizes with 20(S)-OHC. For all panels, * indicates p ≤ 0.05; *** indicates p ≤ 0.0001; ns indicates p > 0.05. Error bars indicate SEM. A–A’. Light2 cells were treated with increasing concentrations of arachidonic acid. Normalized baseline reporter activity is shown relative to the vehicle-treated ShhN-stimulated level of reporter activity, set to 100%, shown in A’. A’. Light2 reporter cells were stimulated with ShhN conditioned media, 20(S)-OHC (10 µM) or SAG (100 nM) plus increasing arachidonic acid. Enhancement is shown relative to the vehicle-treated, Smo agonist-stimulated level of reporter activity set to 100% for each agonist. Significance was determined using a two-way ANOVA. B. Light2 cells were treated with 20(S)-OHC (10 µM) +/−MAFP (5 µM). MAFP-treated cells were treated with arachidonic acid, as indicated. The line indicates the baseline 20(S)-OHC stimulated level, set to 100%. Significance was determined relative to this control using a one-way ANOVA. C. Arachidonic acid was coupled to agarose beads using click chemistry and beads were incubated with lysate from SmoYFP-expressing cells in the presence of 20(S)-OHC or vehicle. Binding was competed with cold arachidonic acid. The endocannabinoid N-stearoyldopamine (SD) failed to compete Smo from arachidonic acid beads. The experiment was performed two times. A representative blot is shown. D–D’. Light2 cells were stimulated with 20(S)-OHC (10 µM) and treated with increasing concentrations of cyclopamine and arachidonic acid. D’. X marks show the calculated IC50 for cyclopamine at each arachidonic acid concentration tested. Each X represents one independent experiment done in triplicate. For all reporter assays, experiments were repeated two or three times in triplicate and all data pooled. E. Binding of fluorescent BODIPY-cyclopamine to Smo was monitored by flow cytometry. The experiment was performed three times. A representative experiment is shown. F. A model for cPLA2α modulation of Smo signaling. Initiation of Smo signaling by a CRD oxysterol agonist activates cPLA2α, resulting in lysophospholipid (green) and arachidonic acid (orange) production. Arachidonic acid is proposed to target the TM domain of active Smo to enhance ciliary translocation and bolster signal output. Smo activated by the 7TM agonist SAG induces PLA2, but does not require PLA2-generated lipids for optimal ciliary translocation and high-level signaling.

References

    1. Allen BL, Song JY, Izzi L, Althaus IW, Kang JS, Charron F, Krauss RS, McMahon AP. Overlapping roles and collective requirement for the coreceptors GAS1, CDO, and BOC in SHH pathway function. Dev Cell. 2011;20:775–787. - PMC - PubMed
    1. Arensdorf AM, Marada S, Ogden SK. Smoothened Regulation: A Tale of Two Signals. Trends Pharmacol Sci. 2016;37:62–72. - PMC - PubMed
    1. Balsinde J, Winstead MV, Dennis EA. Phospholipase A(2) regulation of arachidonic acid mobilization. FEBS Lett. 2002;531:2–6. - PubMed
    1. Bechler ME, Brown WJ. Gbeta1gamma2 activates phospholipase A-dependent Golgi membrane tubule formation. Front Cell Dev Biol. 2014;2:0004. - PMC - PubMed
    1. Belgacem YH, Borodinsky LN. Sonic hedgehog signaling is decoded by calcium spike activity in the developing spinal cord. Proc Natl Acad Sci U S A. 2011;108:4482–4487. - PMC - PubMed

Publication types

LinkOut - more resources