. 2017 Jun 6;25(6):1254-1268.e7.
doi: 10.1016/j.cmet.2017.05.007.

Cytochrome c Oxidase Activity Is a Metabolic Checkpoint that Regulates Cell Fate Decisions During T Cell Activation and Differentiation

Affiliations

Cytochrome c Oxidase Activity Is a Metabolic Checkpoint that Regulates Cell Fate Decisions During T Cell Activation and Differentiation

Tatyana N Tarasenko et al. Cell Metab. .

Abstract

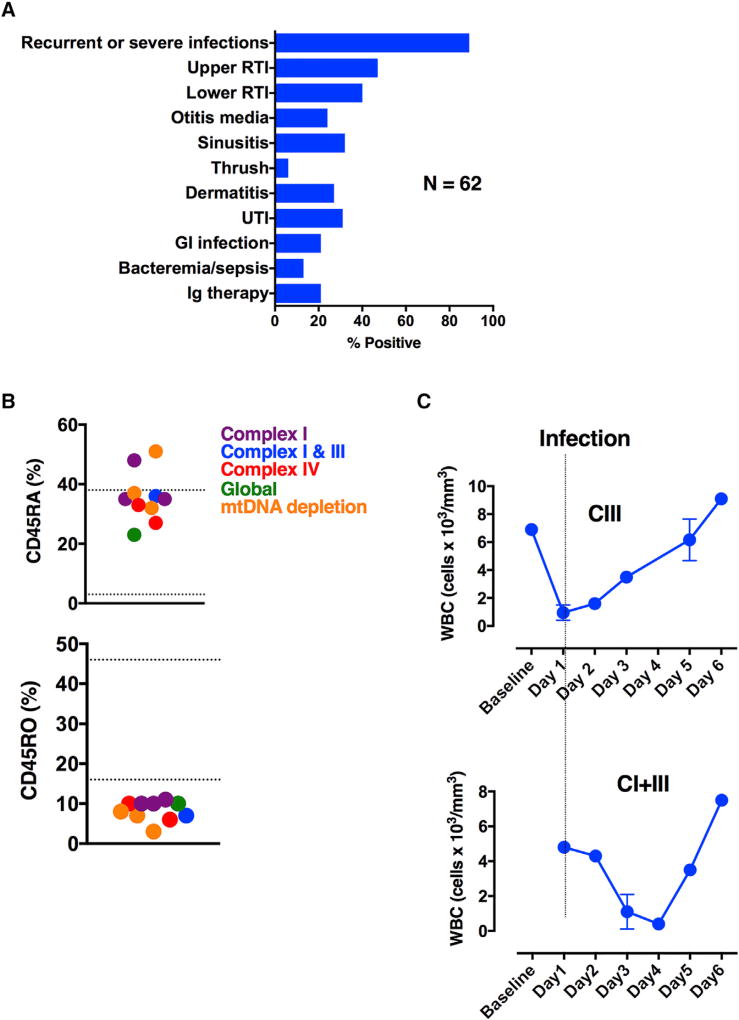
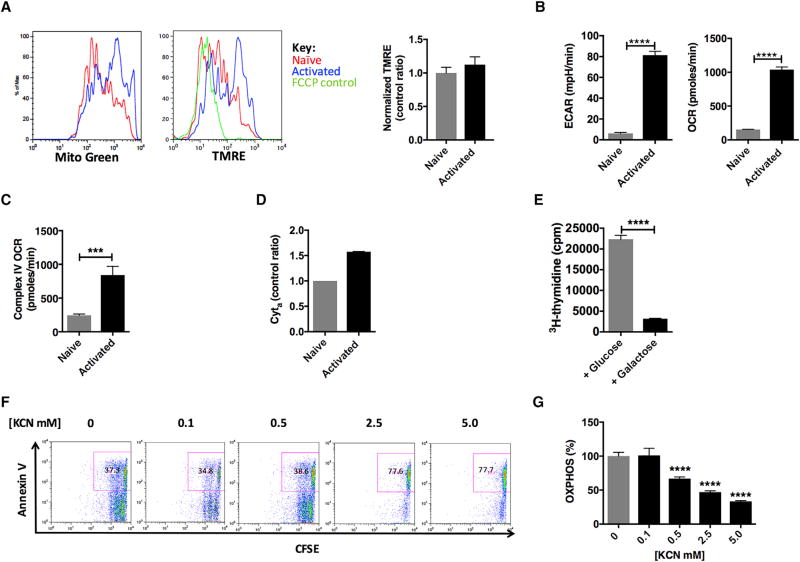
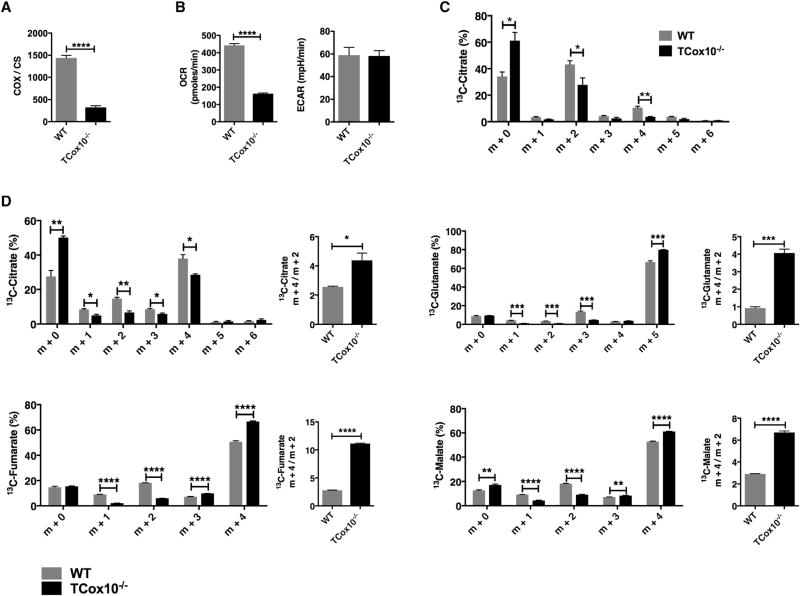
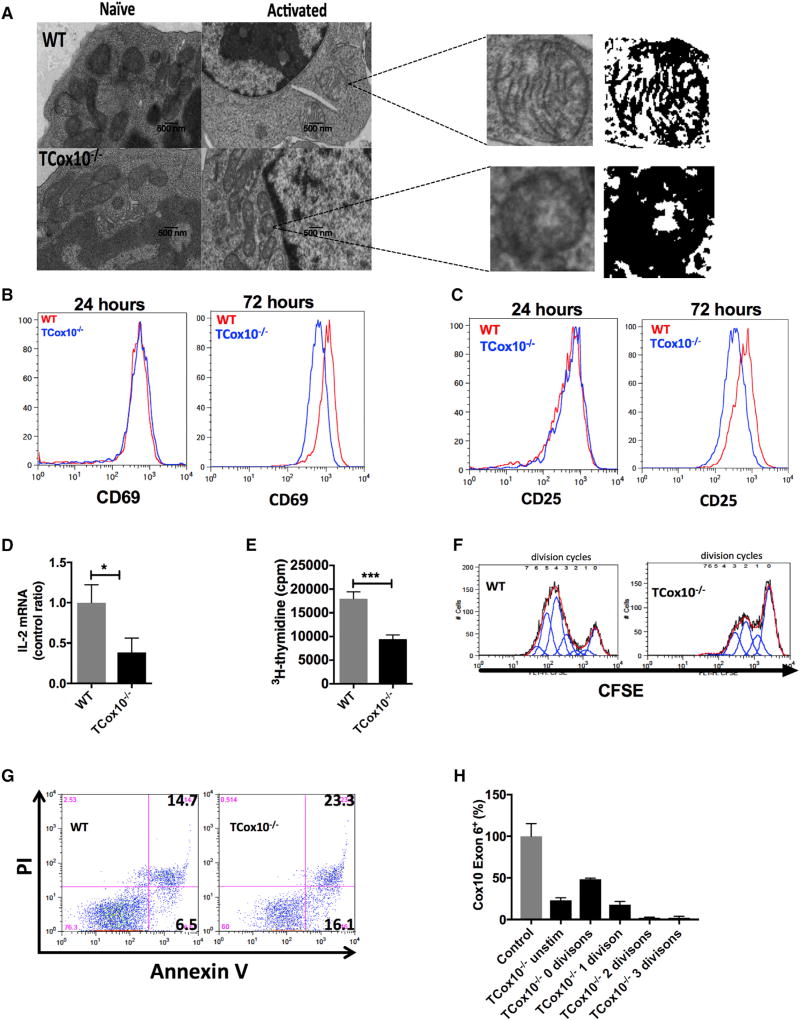
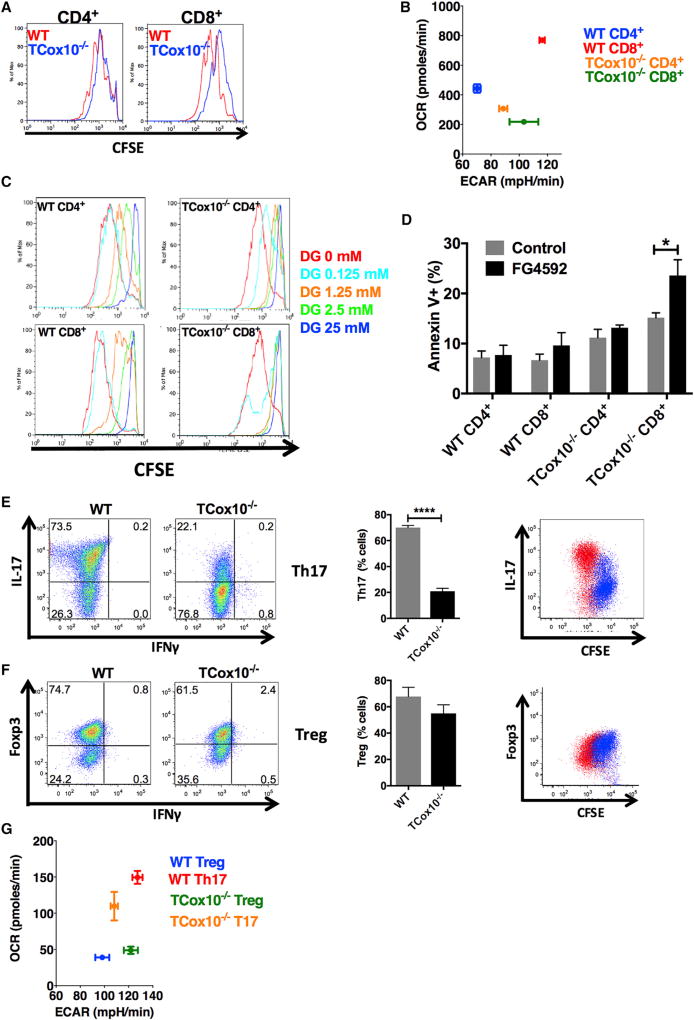
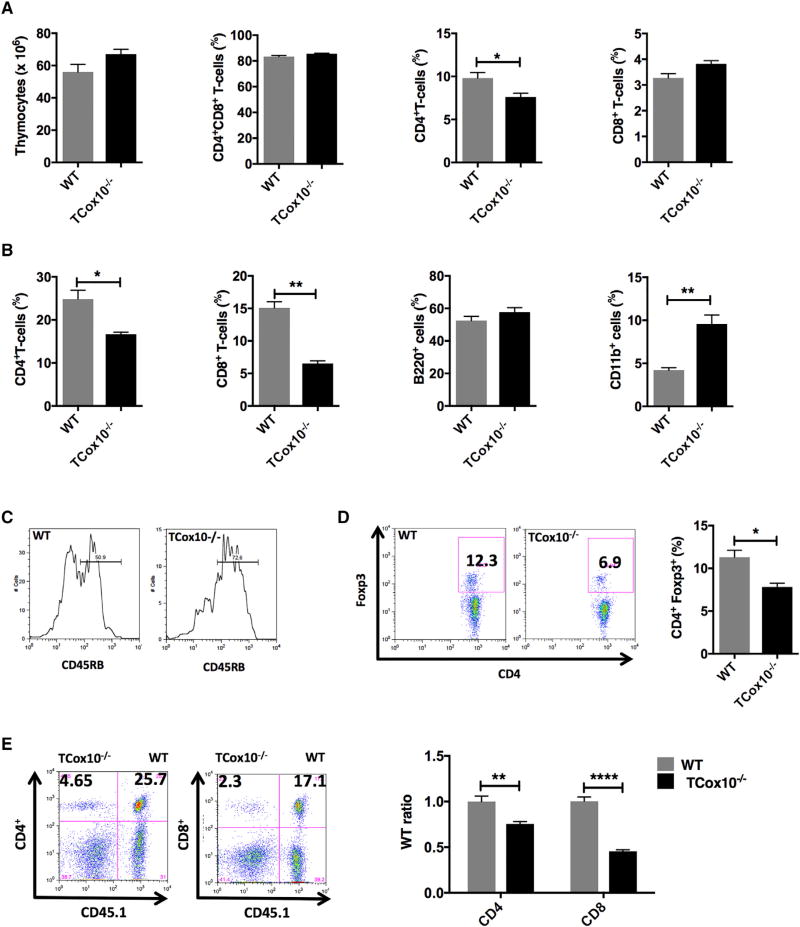
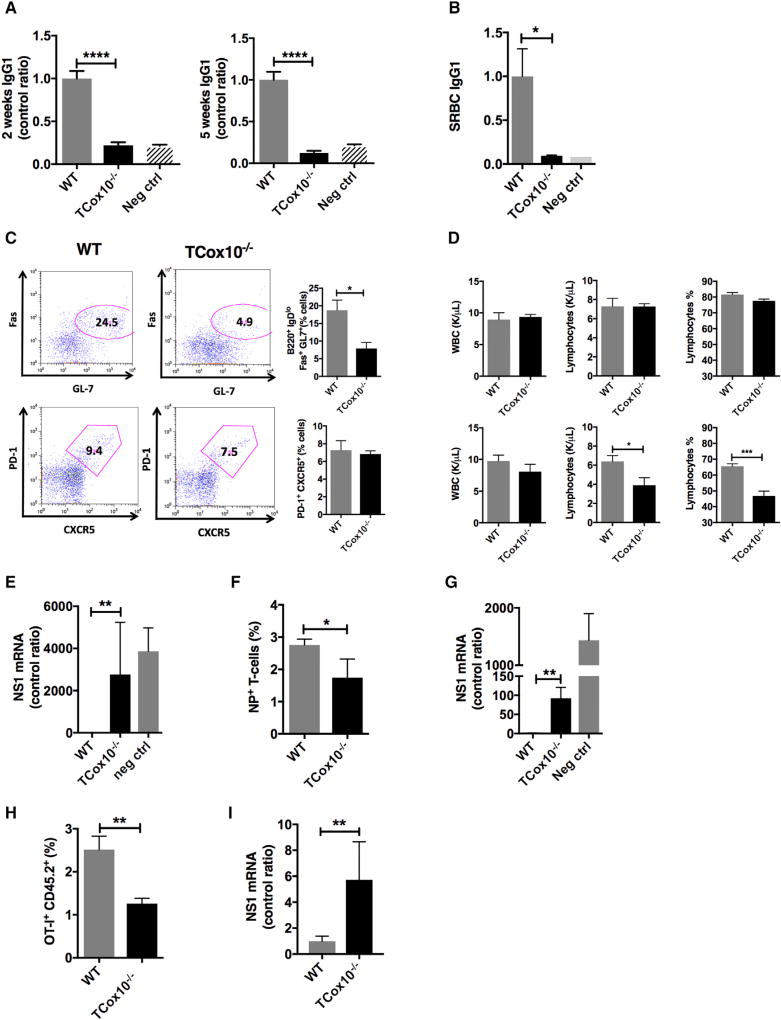
T cells undergo metabolic reprogramming with major changes in cellular energy metabolism during activation. In patients with mitochondrial disease, clinical data were marked by frequent infections and immunodeficiency, prompting us to explore the consequences of oxidative phosphorylation dysfunction in T cells. Since cytochrome c oxidase (COX) is a critical regulator of OXPHOS, we created a mouse model with isolated dysfunction in T cells by targeting a gene, COX10, that produces mitochondrial disease in humans. COX dysfunction resulted in increased apoptosis following activation in vitro and immunodeficiency in vivo. Select T cell effector subsets were particularly affected; this could be traced to their bioenergetic requirements. In summary, the findings presented herein emphasize the role of COX particularly in T cells as a metabolic checkpoint for cell fate decisions following T cell activation, with heterogeneous effects in T cell subsets. In addition, our studies highlight the utility of translational models that recapitulate human mitochondrial disease for understanding immunometabolism.

Keywords: COX10; T-lymphocytes; cytochrome c oxidase; immunometabolism; mitochondria; mitochondrial disease; oxidative phosphorylation.


Figures

Figure 1
Figure 1. Patients with Mitochondrial Disease Have Clinical Indicators of Immunodeficiency
(A) Chart review of immune symptoms from patients with primary mitochondrial disease (N = 55). (B) Clinical flow cytometry for naive (CD45RA+) and memory (CD45RO+) T cells in patients with various mitochondrial diseases (n = 10). Hashed lines indicate normal range of values. (C) White blood cell counts during infection. Error bars denote SEM.
Figure 2
Figure 2. Mitochondria Are Required in Activated Mouse Splenic T Cells
WT T cells were stimulated with anti-CD3/CD28 for 24 hr. (A) Mitochondrial content with MitoGreen (n = 3) and membrane potential ψm (TMRE, tetramethylrhodamine, ethyl ester, n = 3 per condition) and normalized membrane potential (bar graph). (B) Extracellular flux analysis of naive and activated WT T cells (n = 4–5). (C) Complex IV activity (n = 10 per condition). (D) Cytochrome a content (n = 3 per condition). (E) Cellular proliferation in glucose or galactose media (n = 3 per condition). (F) Cell proliferation and apoptosis (inset) with potassium cyanide (KCN) (n = 4 per condition). (G) Extracellular flux analysis in the presence of KCN (n = 4 per condition). Experiments were performed three or more times with representative data shown. ECAR, extracellular acidification rate; OCR, oxygen consumption rate; TMPD, (tetramethyl-p-phenylenediamine). ***p < 0.001, ****p < 0.0001. Error bars denote SEM.
Figure 3
Figure 3. Mouse Model of T Cell Cytochrome c Oxidase Deficiency TCox10−/−
(A) Cytochrome c oxidase (COX) enzyme activity (n = 5 per condition) normalized to citrate synthase (CS). (B) OCR and ECAR. (C) Citrate labeling following treatment with 13C-glucose (n = 3 per condition). (D) TCA cycle flux following treatment with 13C-glutamine (n = 3 per condition). **p < 0.01, ***p < 0.001, ****p < 0.0001. Error bars denote SEM.
Figure 4
Figure 4. TCox10−/− T Cells Show Abnormal Activation In Vitro
(A) Transmission electron microscopy of a representative sample with mitochondrial masks (n = 4–5 per condition). (B) CD69 expression (n = 3 per condition). (C) CD25 expression (n = 3 per condition). (D) IL-2 mRNA expression (n = 3–5 per condition). (E) Proliferation with 3H-thymidine (n = 6 per condition). (F) Proliferation with CFSE (n = 3 per condition). (G) Apoptosis in activated T cells (n = 3 per condition). (H) Cox10 Exon 6 status in TCox10−/− cells sorted by division cycle (n = 3–4 per condition). Experiments were performed three or more times with representative data shown. ****p < 0.0001. Error bars denote SEM.
Figure 5
Figure 5. TCox10−/− Effector T Cells Are Differentially Affected by COX Dysfunction
(A) Proliferation by CFSE (n = 3 per condition). (B) Metabotype by extracellular flux analysis (n = 6–9 per condition). (C) Cell proliferation during 2-DG treatment (n = 3 per condition). (D) Apoptosis during FG4592 treatment (n = 3 per condition). (E and F) In vitro differentiation of (E) Th17 (n = 3 per condition) and (F) Treg (n = 3 per condition). Bar graphs (middle) summarize data. Proliferation and lineage-specific marker (right). (G) Metabotype in activated Th17 and Treg cells (n = 5–9 per condition). 2-DG, 2-deoxyglucose; Th17, T helper 17; Treg, regulatory T cells. Experiments were performed three or more times with representative data shown. *p < 0.05, ****p < 0.0001. Error bars denote SEM.
Figure 6
Figure 6. T Cell Populations Are Altered in TCox10−/− Mice In Vivo
(A) Thymic T cell populations (n = 3 per condition). (B) Splenic cell populations (n = 3 per condition). (C) CD45RB expression on splenic T cells (n = 3 per condition). (D) Regulatory T cells (n = 3 per condition). (E) Bone marrow transfer studies (n = 4 per condition). Experiments were performed three or more times with representative data shown. *p < 0.05, **p < 0.01, ****p < 0.0001. Error bars denote SEM.
Figure 7
Figure 7. Abnormal Vaccine Responses in TCox10−/− Mice In Vivo
(A) Antibody response to TNP-CGG (n = 11 of 13). (B) Antibody response to sheep red blood cell (SRBC) immunization (n = 4 per condition). (C) Germinal center formation (n = 3 per condition); bar graphs (right). (D) Peripheral lymphocytes at baseline (top) and during H3N2 (X31) influenza infection (bottom) (n = 5 per condition). (E) Viral titers following X31 influenza immunization and rechallenge (n = 3–6 per condition). (F) Viral-specific T cells following X31 immunization and PR8 influenza challenge (n = 5 per condition). (G) Viral titers following X31 immunization and PR8 influenza challenge (n = 4 per condition). (H) Expansion of OT-I cells following challenge with X31-OVA (n = 5 per condition). (I) Viral lung titer for NS1 (n = 5 per condition). TNP-CGG, 2,4,6-trinitrophenyl chicken gamma globulin; neg ctrl, negative control; X31-OVA, X31 influenza virus containing ovalbumin; NS-1,influenza non-structural protein 1. Experiments (n = 3 per condition) were performed three or more times with representative data shown. *p < 0.05, **p < 0.01, ****p < 0.0001. Error bars denote SEM.

References

    1. Antico Arciuch VG, Elguero ME, Poderoso JJ, Carreras MC. Mitochondrial regulation of cell cycle and proliferation. Antioxid. Redox Signal. 2012;16:1150–1180. - PMC - PubMed
    1. Antonicka H, Leary SC, Guercin GH, Agar JN, Horvath R, Kennaway NG, Harding CO, Jaksch M, Shoubridge EA. Mutations in COX10 result in a defect in mitochondrial heme A biosynthesis and account for multiple, early-onset clinical phenotypes associated with isolated COX deficiency. Hum. Mol. Genet. 2003;12:2693–2702. - PubMed
    1. Bairoch A, Apweiler R. The SWISS-PROT protein sequence data bank and its supplement TrEMBL in 1999. Nucleic Acids Res. 1999;27:49–54. - PMC - PubMed
    1. Balaban RS, Mootha VK, Arai A. Spectroscopic determination of cytochrome c oxidase content in tissues containing myoglobin or hemoglobin. Anal. Biochem. 1996;237:274–278. - PubMed
    1. Beier UH, Angelin A, Akimova T, Wang L, Liu Y, Xiao H, Koike MA, Hancock SA, Bhatti TR, Han R, et al. Essential role of mitochondrial energy metabolism in Foxp3+ T-regulatory cell function and allograft survival. FASEB J. 2015;29:2315–2326. - PMC - PubMed

LinkOut - more resources