. 2017 Jun 6;25(6):1362-1373.e5.
doi: 10.1016/j.cmet.2017.05.011.

Interrupted Glucagon Signaling Reveals Hepatic α Cell Axis and Role for L-Glutamine in α Cell Proliferation

Affiliations

Interrupted Glucagon Signaling Reveals Hepatic α Cell Axis and Role for L-Glutamine in α Cell Proliferation

E Danielle Dean et al. Cell Metab. .

Abstract

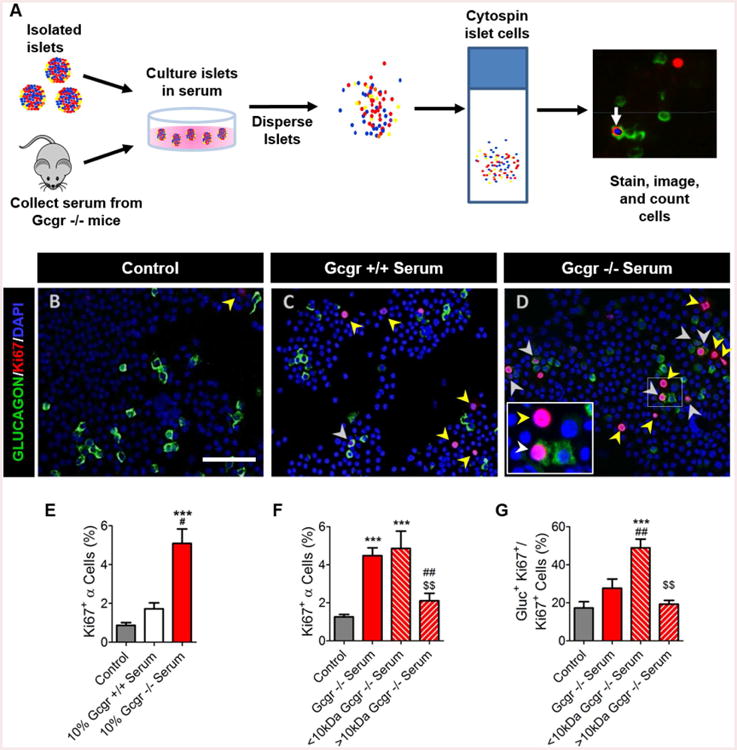
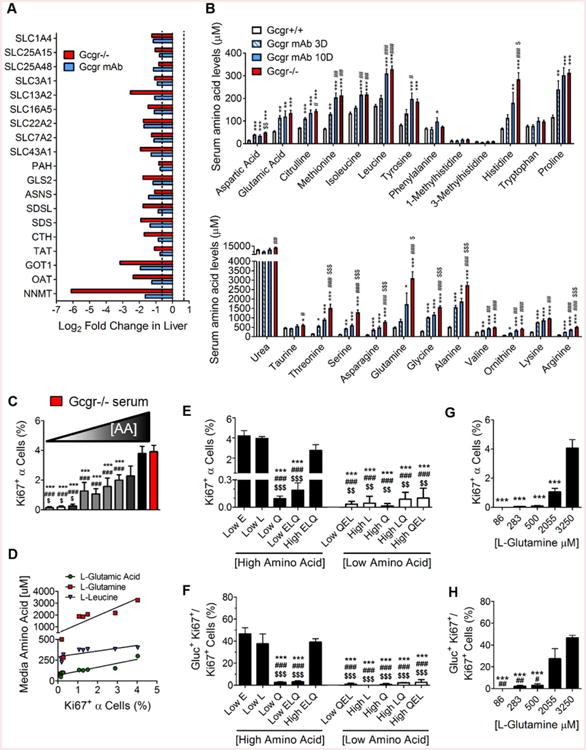
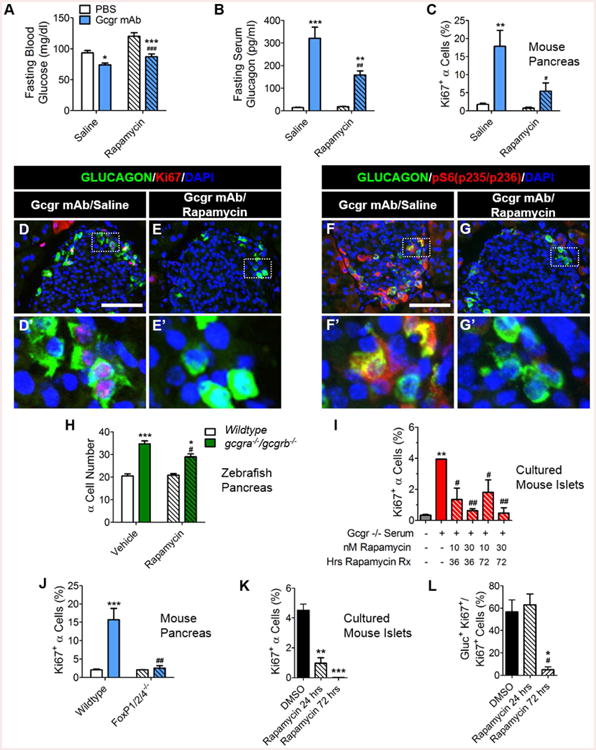
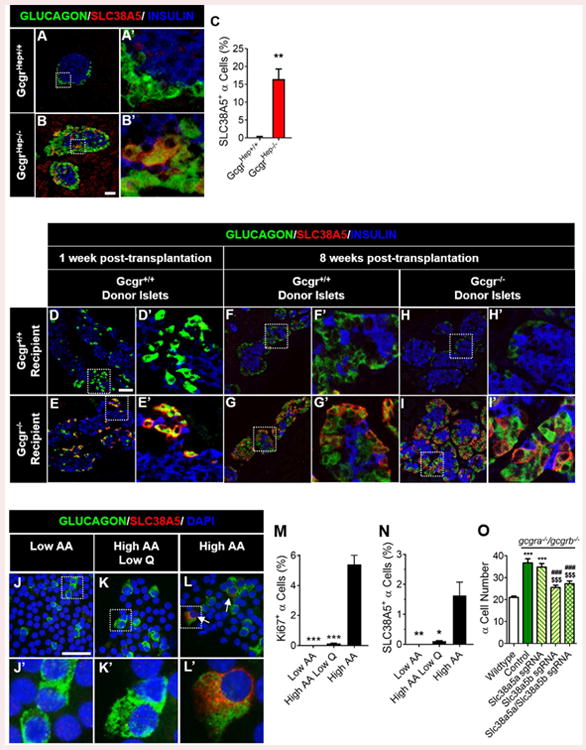
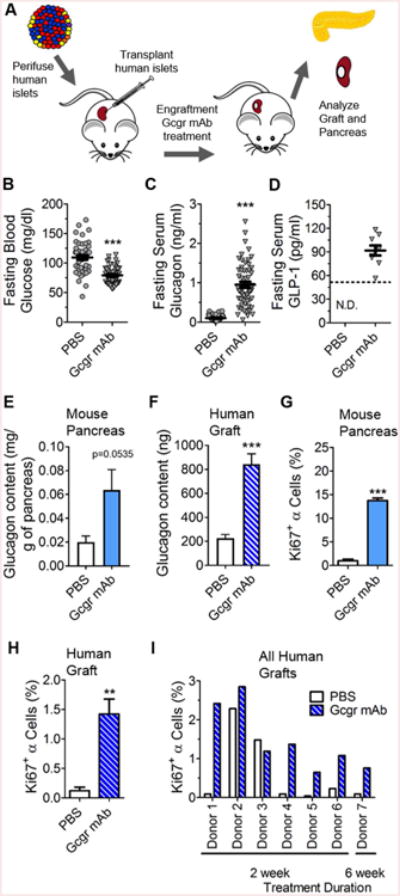
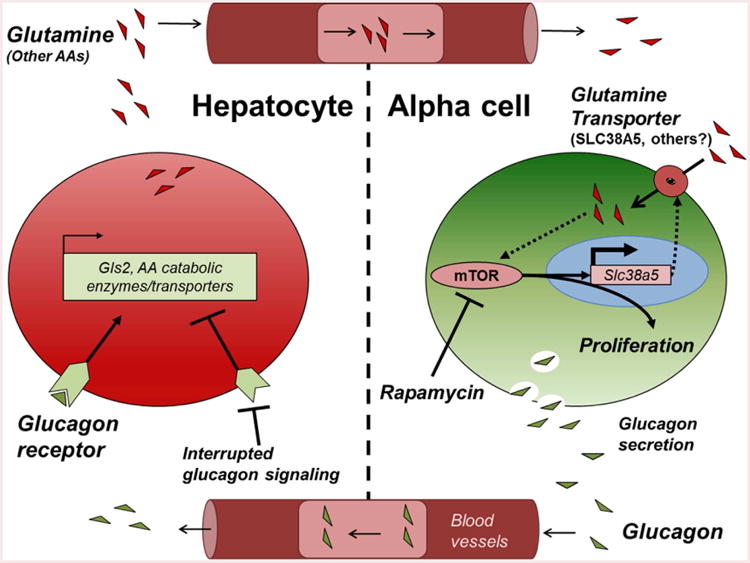
Decreasing glucagon action lowers the blood glucose and may be useful therapeutically for diabetes. However, interrupted glucagon signaling leads to α cell proliferation. To identify postulated hepatic-derived circulating factor(s) responsible for α cell proliferation, we used transcriptomics/proteomics/metabolomics in three models of interrupted glucagon signaling and found that proliferation of mouse, zebrafish, and human α cells was mTOR and FoxP transcription factor dependent. Changes in hepatic amino acid (AA) catabolism gene expression predicted the observed increase in circulating AAs. Mimicking these AA levels stimulated α cell proliferation in a newly developed in vitro assay with L-glutamine being a critical AA. α cell expression of the AA transporter Slc38a5 was markedly increased in mice with interrupted glucagon signaling and played a role in α cell proliferation. These results indicate a hepatic α islet cell axis where glucagon regulates serum AA availability and AAs, especially L-glutamine, regulate α cell proliferation and mass via mTOR-dependent nutrient sensing.

Keywords: Slc38a5; alpha cell; amino acid; amino acid transport; glucagon; glucagon receptor; glutamine; liver; pancreatic islet; proliferation.


Figures

Figure 1
Figure 1. Mouse α-cells proliferate in vitro when cultured in Gcgr-/- mouse serum
(A) Schematic for in vitro α-cell proliferation assay to quantify proliferation rates. Representative images of dispersed islet cells cultured in (B) control media, (C) Gcgr+/+ mouse serum- or (D) Gcgr-/- mouse serum-treated media. Glucagon (green), Ki67 (red), and DAPI (blue) are shown. Proliferating α-cells (Ki67+ glucagon+) and non α-cells (Ki67+ glucagon-) are indicated by white or yellow arrows, respectively. White bar indicates 75μm. (E) Quantification of α-cell proliferation following culture in mouse serum-treated media. Control media with no mouse serum added (grey), 10% Gcgr+/+ mouse serum-(white), and 10% Gcgr-/- mouse serum-(red) treated are shown. ***p<0.001 vs control, #p<0.05 vs. Gcgr+/+ mouse serum; n=3-12. Quantification of Gcgr-/- size fractionated mouse serum induced (F) α-cell proliferation and (G) percentage of cells proliferating in each fractionated mouse serum-treated media condition that are α-cells. Control media with no mouse serum added (grey), 10% Gcgr-/- whole mouse serum-(red), 10% Gcgr-/- <10kDa mouse serum-(red left hashed), and 10% Gcgr-/- <10kDa mouse serum-(red right hashed) treated media islets are shown. ***p<0.001 vs control, ##p<0.01 vs. Gcgr-/-, and $$p<0.01 vs. <10kDa Gcgr-/-; n=3-13. Data are mean ± SEM.
Figure 2
Figure 2. L-glutamine and other AA promote selective α-cell proliferation
(A) Log2 fold changes in expression of liver AA catabolism genes in Gcgr-/- (red) and GCGR mAb (blue)-treated mice relative to PBS-treated Gcgr+/+ mice; n=3. (B) Mouse serum AA levels measured by HPLC in Gcgr-/- (red), GCGR mAb-treated for 10 days (blue), GCGR mAb-treated for 3 days (blue/white hatched), and PBS-treated (white) *p<0.05, **p<0.01, ***p<0.001 vs PBS-treated Gcgr+/+. #p<0.05, ##p<0.01 vs. GCGR mAb-treated 3 day; $p<0.05, $$p<0.01, $$$p<0.001 vs. GCGR mAb-treated 10 day; n=5-10. (C) Quantification of α-cell proliferation in response to media with increasing AA concentration media. White (low) to gray (intermediate) to black (high) color indicates combined concentration of all AA in each media condition (see Table S4 for combined and individual AA media concentrations. Each bar corresponds to one of the conditions in labeled Media #1-9 in order from left to right); n=3-8. The red bar indicates 10% Gcgr-/- mouse serum-supplemented media similar to Figure 1E. ***p<0.001 vs Gcgr-/- mouse serum-supplemented media (red), ###p<0.01 vs. highest AA media-treated islets (black), and $p<0.05 vs. highest AA media-treated islets (dark gray). (D) Linear regression analyses of AA concentration in each media condition versus the α-cell proliferation rate with each media. Significant correlation related to L-glutamate (blue triangles), Q (red squares) and L-leucine (green triangles) concentrations are noted. Quantification of (F) α-cell proliferation and (G) percentage of cells proliferating that are α-cells in response to altering individual AA levels in cultured mouse islets. Combined high AA media and combined low AA media are represented with black and white bars, respectively. n=3-12, ***p<0.001 vs low L-glutamate (Low E)-treated islets, ###p<0.001 vs. low L-leucine (Low L)-treated islets, and $$p<0.01; $$$p<0.001 vs. high L-glutamate, L-leucine, and Q media (High ELQ)-treated islets. (H) Quantification of Q dose response stimulated α-cell proliferation and (I) percentage of cells proliferating that are α-cells in cultured mouse islets. n=3, ***p<0.001 vs 3250 μM Q, ##p<0.01 vs 2055 μM Q. Data are mean ± SEM.
Figure 3
Figure 3. mTOR signaling and FoxP transcription factor are essential for α-cell proliferation in response to interrupted glucagon signaling
(A) Fasting blood glucose (mg/dl) n=5, (B) serum glucagon (pg/ml) n=5, and (C) α-cell proliferation (n=3) in mice after cotreatment with GCGR mAb and rapa. Saline/PBS treated (white bars), Saline/GCGR mAb treated (blue bars), rapa/PBS treated (white left hashed bars) and rapa/GCGR mAb treated (blue left hashed bars) are shown. *p<0.05, **p<0.01, and ***p<0.001 vs PBS treated and #p<0.05, ##p<0.01, and ###p<0.001 vs. Saline treated. (D-E) Representative images of pancreatic islet α-cell proliferation in Saline/GCGR mAb- and rapa/GCGR mAb-treated mice. Glucagon (green), Ki67 (red), and DAPI (blue) are shown. White scale bars indicate 100μm. White dashed boxes indicate region selected for insets. (F-G) Representative images of pancreatic islet α-cell expression of pS6 protein in Saline/GCGR mAb- and rapa/GCGR mAb-treated mice. Glucagon (green), pS6(pS235/S236) (red), and DAPI (blue) are shown. (H) α-cell number in 7dpf wildtype and gcgra-/-gcgrb-/- zebrafish larvae primary islet after treatment with rapa for 3 days. Wildtype/vehicle treated (white), gcgra-/-gcgrb-/-/vehicle treated (green), Wildtype/rapa treated (white left hashed) and gcgra-/-gcgrb-/-/rapa treated (green left hashed) are shown. *p<0.05 and ***p<0.001 vs Wildtype and #p<0.05 vs. vehicle treated; n=8-11. (I) α-cell proliferation in rapa and 10% Gcgr-/- mouse serum co-supplemented media cultured mouse islets. Control RPMI media (#7 Table S4) with no mouse serum added (grey), Gcgr-/- whole mouse serum (with medium combined AA levels plus vehicle)-supplemented media (red) and Gcgr-/- mouse serum and rapa co-supplemented media cultured mouse islets (red left hashed) are shown. **p<0.01 vs control media and #p<0.05 and ##p<0.01 vs. Gcgr-/- mouse serum (with medium combined AA levels plus vehicle)-supplemented media; n=2-3. (J) α-cell proliferation in GCGR mAb-treated FoxP1/2/4-/- mice is shown. Wildtype/PBS-treated (white), Wildtype/GCGR mAb-treated (blue), FoxP1/2/4-/-/PBS-treated (white left hashed) and FoxP1/2/4-/-/GCGR mAb-treated (blue left hashed) are shown. ***p<0.001 vs PBS-treated and ##p<0.01 vs. Saline-treated; n=3. (J) Quantification of rapa effects on AA-stimulated α-cell proliferation and (K) percentage of cells proliferating that are α-cells in cultured mouse islets treated for 3 days. Highest AA media with DMSO added (black), highest AA media with 30nM rapa added for the last 24 hours of culture (black left hashed), highest AA media with 30nM rapa added for 3 days culture (black right hashed); *p<0.05, **p<0.01 and **p<0.001 vs DMSO-treated, and #p<0.05 vs rapa 24 hrs-treated; n=2-3. Data are mean ± SEM.
Figure 4
Figure 4. SLC38A5 is upregulated in α-cells and required for expansion of α-cells in response to interrupted glucagon signaling
Representative images of pancreatic islet α-cell SLC38A5 expression are shown in (A) control GcgrHep+/+ and (B) GcgrHep-/- mouse pancreas. Glucagon (green), SLC38A5 (red), and insulin (blue) are shown. White scale bars indicate 50μm. White dashed boxes indicate region selected for insets. (C) Quantification of SLC38A5+ α-cells in GcgrHep+/+ (white) and GcgrHep-/- (red) mouse pancreas; **p<0.01; n=3. (D-I) Representative images of pancreatic islet α-cell SLC38A5 expression in Gcgr+/+ and Gcgr-/-islets from subcapsular renal transplantation into Gcgr+/+ and Gcgr-/- mice (n=3). SLC38A5 expression is shown at (D-E) one week and (F-I) eight weeks post-transplantation. Representative images of pancreatic islet α-cell SLC38A5 expression are shown in dispersed islets cultured in in (J) Low AA, (K) High AA Low Q, or (L) High AA media for four days. Glucagon (green), SLC38A5 (red), and dapi (blue) are shown. White arrows indicate SLC38A5+ α-cells. Quantification of (M) α-cell proliferation and (N) SLC38A5+ α-cells in isolated islets cultured in Low AA, High AA Low Q, or High AA media for four days. *p<0.05, **p<0.01 and **p<0.001 vs High-AA treated; n=3. (O) α-cell number after knockdown of slc38a5 genes in 6dpf wildtype (white) and gcgra-/-gcgrb-/- (green-control) zebrafish larvae primary islet. α-cell number in slc38a5a sgRNA-treated gcgra-/-gcgrb-/- (yellow with green left-hashed), slc38a5b sgRNA-treated gcgra-/-gcgrb-/- (yellow with green right-hashed) or slc38a5a/slc38a5b sgRNA-treated gcgra-/-gcgrb-/- (yellow with green double-hatched) are also shown. ***p<0.001 vs Wildtype, ###p<0.001 vs. control gcgra-/-gcgrb-/-, and $$$p<0.001 vs. slc38a5a sgRNA-treated gcgra-/-gcgrb-/-; n=7-23. Data are mean ± SEM.
Figure 5
Figure 5. Human pancreatic islet α-cells proliferate when glucagon signaling is interrupted
(A) Experimental design of human islet subcapsular renal transplantation and GCGR mAb treatment. (B) Fasting blood glucose (n=49-50), (C) serum glucagon levels (n=42-55), and (D) serum GLP-1 levels (n=10) on Day 10 in mice treated with either PBS (grey circles) or GCGR mAb (grey triangles). Quantification of (E) mouse pancreatic and (F) human islet donor (Donor 8) graft glucagon content (n=6-8) 4 weeks after GCGR mAb treatment. Quantification of (G) mouse (n=3) and (H) human islet donor (Donor 4) graft α-cell proliferation (n=5-6) 2 weeks after treatment with GCGR mAb. **p<0.01, ***p<0.001 vs PBS-treated; ND not detected. (I) Quantification of human islet α-cell proliferation in individual donor islets grafts from 7 different experiments of NSG mice treated with PBS or GCGR mAb for 2 to 6 weeks. Data are mean ± SEM.
Figure 6
Figure 6. Model for liver-pancreatic islet α-cell axis where L-glutamine and glucagon reciprocally regulate each other
Glucagon is released from pancreatic islet α-cells where it acts on hepatocyte GCGRs to stimulate gluconeogenesis and hepatic glucose output, raising blood glucose. Interrupted glucagon signaling in hepatocytes leads to decreased AA catabolism and increased circulating AA. Of these AA, Q selectively activates α-cell proliferation through both FoxP- and mTOR-dependent mechanisms. mTOR activation in the α-cell leads to upregulation of Slc38a5 expression that further potentiates Q-dependent α-cell proliferation completing an endocrine feedback loop between liver and pancreatic islet α-cells. Glutaminase 2-GLS2, mechanistic target of rapamycin-mTOR, amino acids-AAs.

References

    1. Aamodt KI, Aramandla R, Brown JJ, Fiaschi-Taesch N, Wang P, Stewart AF, Brissova M, Powers AC. Development of a reliable automated screening system to identify small molecules and biologics that promote human betα-cell regeneration. Am J Physiol Endocrinol Metab. 2016;311(5):E859–E868. - PMC - PubMed
    1. An J, Muoio DM, Shiota M, Fujimoto Y, Cline GW, Shulman GI, Koves TR, Stevens R, Millington D, Newgard CB. Hepatic expression of malonyl-CoA decarboxylase reverses muscle, liver and whole-animal insulin resistance. Nat Med. 2004;10(3):268–274. - PubMed
    1. Ben-Zvi D, Barrandon O, Hadley S, Blum B, Peterson QP, Melton DA. Angptl4 links alphα-cell proliferation following glucagon receptor inhibition with adipose tissue triglyceride metabolism. Proc Natl Acad Sci U S A. 2015;112:15498–15503. - PMC - PubMed
    1. Benner C, van der Meulen T, Caceres E, Tigyi K, Donaldson CJ, Huising MO. The transcriptional landscape of mouse beta cells compared to human beta cells reveals notable species differences in long non-coding RNA and protein-coding gene expression. BMC Genomics. 2014;15:620. - PMC - PubMed
    1. Bernal-Mizrachi E, Kulkarni RN, Scott DK, Mauvais-Jarvis A, Stewart AF, Garcia-Ocana A. Human betα-cell proliferation and intracellular signaling part 2: still driving in the dark without a road map. Diabetes. 2014;63:819–831. - PMC - PubMed